Klaas visser 2016 04-05 energy benefits of ac mt lt refrig in supermarkets -...
Natural Ventilation Theatre2
1. CFD analysis of temperature in the cafe on
July 15, from 1-2pm
The temperatures provided by the
model were averages of the space.
The CFD analysis shows that the
temperatures in the occupied
zones are different from the areas
towards the ceiling of the café. This
provides a limitation to our model
– the café’s occupied zone was not
separated from the unoccupied
zones, thereby increasing any tem-
perature peaks.
Table 2:Theatre CO2 concentration levels for models 5 - 12
CO2 concentrations MODEL 4 MODEL 5 MODEL 6 MODEL 7 MODEL 8 MODEL 9 MODEL 10 MODEL 11
above 1500 576 30 34 25 32 60 61 56
total 2920 2920 2920 2920 2920 2920 2920 2920
% above 19.73% 1.03% 1.16% 0.86% 1.10% 2.05% 2.09% 1.92%
CFD analysis of temperature in the theatre
on July 15, from 1-2pm
Temperatures in the theatre vary by
the same amount, which is expect-
ed due to the theatre’s height.
There are about 2OC of variation
between the temperatures from the
lower to the upper levels of the
theatre.
CFD simulation of CO2 concentration levels on July 15.
CO2 concentrations are above 1500ppm 1.92% of the operating hours in the
year, as shown by Table 2. The CFD analysis of CO2 concentrations show that
the higher concentrations of CO2 can be found on the higher levels, towards
the ceiling of the theatre, in red. The occupied levels of the theatre have CO2
concentrations ranging from about 550 – 950ppm.
These numbers show that
lighting loads are very high
for the building. The lighting
strategy could be improved
by light sensors in the
switches in the café, as it
benefits from significant
levels of natural lighting.
SUMMER NIGHT-VENTILATION STRATEGY
1.CROSS VENTILATION in both the cafe and theatre
2.STACK VENTILATION in the theatre for pre-cooling in the morning
±0.00 GROUD LEVEL
CAFE-RECEPTION
+3.70
THEATRE
-0.20
THEATRE
-2.90
STAGEBACK
STAGE
+3.70 CAFE LEVEL
+9.90 TOP ROOF LEVEL
+12.90 TOP STACK LEVEL
-0.20 THEATRE LEVEL
-2.90 THEATRE LEVEL
±0.00 GROUD LEVEL
+3.70 CAFE LEVEL
+9.90 TOP ROOF LEVEL
+12.90 TOP STACK LEVEL
-0.20 THEATRE LEVEL
-2.90 THEATRE LEVEL
CAFE-RECEPTION
+3.70
THEATRE
-0.20
STAFF
CORRIDOR
GUEST
CORRIDOR
2.
2.
1.
WINTER VENTILATION STRATEGY
1.CROSS VENTILATION in the cafe during the operating time
2.STACK VENTILATION in the theatre to decrease carbon dioxcide concentration
1.
2.
1.
±0.00 GROUD LEVEL
+3.70 CAFE LEVEL
+9.90 TOP ROOF LEVEL
+12.90 TOP STACK LEVEL
-0.20 THEATRE LEVEL
-2.90 THEATRE LEVEL
CAFE-RECEPTION
+3.70
THEATRE
-0.20
STAFF
CORRIDOR
GUEST
CORRIDOR
2.
±0.00 GROUD LEVEL
CAFE-RECEPTION
+3.70
THEATRE
-0.20
THEATRE
-2.90
STAGEBACK
STAGE
+3.70 CAFE LEVEL
+9.90 TOP ROOF LEVEL
+12.90 TOP STACK LEVEL
-0.20 THEATRE LEVEL
-2.90 THEATRE LEVEL
SUMMER VENTILATION STRATEGY
1.CROSS VENTILATION in the cafe during the operating time to ventilate the air and reduce carbon dioxide
concentration
2.STACK VENTILATION in the theatre to provide cold air and decrease carbon dioxide concentration
1.
1.±0.00 GROUD LEVEL
+3.70 CAFE LEVEL
+9.90 TOP ROOF LEVEL
+12.90 TOP STACK LEVEL
-0.20 THEATRE LEVEL
-2.90 THEATRE LEVEL
CAFE-RECEPTION
+3.70
THEATRE
-0.20
STAFF
CORRIDOR
GUEST
CORRIDOR
2.
±0.00 GROUD LEVEL
CAFE-RECEPTION
+3.70
THEATRE
-0.20
THEATRE
-2.90
STAGEBACK
STAGE
+3.70 CAFE LEVEL
+9.90 TOP ROOF LEVEL
+12.90 TOP STACK LEVEL
-0.20 THEATRE LEVEL
-2.90 THEATRE LEVEL
M DOW
TH TRE
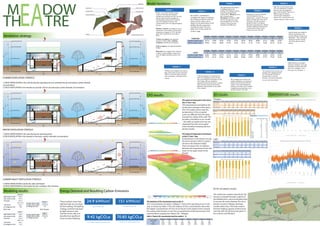
Ventilation strategy
CFD results: IES results
Model Iterations
Theatre :
Cafe :
IES VE simulation results:
The model was created using IES VE. The
structure included the basic outlines of
the building form, and surrounding trees,
to account for some shading. The site is
heavily covered in foliage, and large
London plane trees. The team expects
that the shading capacity of these trees
can help with minimizing solar gains in
the summer, and filtration.
EA
0%
10%
20%
30%
40%
50%
60%
70%
80%
90%
100%
MODEL 1 MODEL 2 MODEL 3 MODEL 4 MODEL 5 MODEL 6 MODEL 7 MODEL 8 MODEL 9 MODEL 10 MODEL 11
THEATRE - Percentage within and outside the comfort range
within comfort range outside comfort range
MODEL 1 MODEL 2 MODEL 3 MODEL 4 MODEL 5 MODEL 6 MODEL 7 MODEL 8 MODEL 9 MODEL 10 MODEL 11
Number dissa sfied 1726 695 1226 533 653 873 827 840 705 549 536
Number sa sfied 1194 2225 1694 2387 2267 2047 2093 2080 2215 2371 2384
Total 2920 2920 2920 2920 2920 2920 2920 2920 2920 2920 2920
Outside comfort range 59.1% 23.8% 42.0% 18.3% 22.4% 29.9% 28.3% 28.8% 24.1% 18.8% 18.4%
Within comfort range 40.9% 76.2% 58.0% 81.7% 77.6% 70.1% 71.7% 71.2% 75.9% 81.2% 81.6%
Temperature (˚C)
CO2 MODEL 4 MODEL 5 MODEL 6 MODEL 7 MODEL 8 MODEL 9 MODEL 10 MODEL 11
Above 1500 576 30 34 25 32 60 61 56
Total 2920 2920 2920 2920 2920 2920 2920 2920
% Above 19.73% 1.03% 1.16% 0.86% 1.10% 2.05% 2.09% 1.92%
Group 6: Meadow Theatre
THEATRE
MODEL
1
MODEL
2
MODEL
3
MODEL
4
MODEL
5
MODEL
6
MODEL
7
MODEL
8
MODEL
9
MODEL
10
MODEL
11
outside comfort zone 59.1% 23.8% 42.0% 18.3% 22.4% 29.9% 28.3% 28.8% 24.1% 18.8% 18.4%
within comfort zone 40.9% 76.2% 58.0% 81.7% 77.6% 70.1% 71.7% 71.2% 75.9% 81.2% 81.6%
CAFÉ
MODEL
1
MODEL
2
MODEL
3
MODEL
4
MODEL
5
MODEL
6
MODEL
7
MODEL
8
MODEL
9
MODEL
10
MODEL
11
outside comfort zone 62.8% 35.9% 46.1% 42.1% 41.6% 43.2% 44.9% 48.8% 32.2% 24.6% 23.5%
within comfort zone 37.2% 64.1% 54.0% 58.1% 58.4% 56.8% 54.9% 51.0% 67.7% 75.3% 76.3%
MODEL 1
Model 1 was a basic shoebox model
created to test that the ventilation
strategy was working. From this, we were
able to confirm that the strategy was
working. Peak temperatures in summer
were at 25 degrees, however, CO2
concentrations were very high throughout
the year.
Window controls were based on the air
temperature of the theatre. Closed when
temperature dropped to 19OC, and fully
open when temperatures were above
25OC.
Theatre occupancy was expected
between 12-2pm, 6-8pm. Lighting
schedules coincide with occupancy.
Café occupancy was expected between
8-10pm
Materials were assigned their respective
u-values. Lowest possible u-values were
used, and highest possible g-values were
used.
MODEL 2
For model 2, we decided to
investigate the impacts of reducing
the occupancy levels for both the
theatre and the café to see its
impacts on the performance of the
building. All other parameters
remained the same. We saw a
higher level of times within the
comfort range.
MODEL 3
We experimented the impacts
of adding heating to the
building. The building would be
heated once temperatures
reached 18OC. Windows were
also constantly open.
Occupancy was back at 100%,
and the café operation hours
were changed from 7am-7pm.
Comfort criteria was only
achieved at the 50% level.
MODEL 4
Heating was removed. Window
controls depend on the air
temperature – closed at 19OC and
below, and fully open when 25 OC
and above. We also assumed a
gradual increase in occupancy
during the operating hours. Results
showed a significant improvement
in the thermal comfort in the
theatre, but not in the café.
MODEL 5
High CO2 concentrations were
yet to be addressed. In model 5,
thermal mass was assigned to
each of the materials. There are 4
different types of window
controls were employed to
address CO2 concentrations and
maintain thermal comfort criteria.
MODEL 6
Internal blinds were added to
address overheating in the
summer. Blinds are open from
September – May, and closed
during the summer months,
when solar gains are above
50w/m2
MODEL 7
Night ventilation was added,
and stack ventilation, and cross
ventilation windows were fully
open from midnight to 7am,
from June 15 to October 1.
MODEL 8
The material of the chimney was
changed. We originally planned
for a transparent chimney to
provide views to the sky.
However, the team has decided
to use a concrete instead.
MODEL 9
More changes were made to the
window schedules in an attempt to
address the low levels of thermal
comfort in the café. Heating was
added to the model, which resulted
in significant improvements to the
thermal comfort in the café.
MODEL 11
Windows were added to the interior
glass wall to allow for the movement
of hot air from the theatre into the
café, as necessary, during the winter
months.
MODEL 10
It became apparent to the group that
there was a significant amount of heat
that was moving from the theatre to the
café. A glass wall was installed to
separate the café and the stack, to better
direct the heat towards the chimney.
Significant improvements to the model
were realized.
Temperature (˚C) MODEL 1 MODEL 2 MODEL 3 MODEL 4 MODEL 5 MODEL 6 MODEL 7 MODEL 8 MODEL 9 MODEL 10 MODEL 11
Number dissa sfied 2978 1702 2185 1994 1215 1261 2132 2316 1526 1165 1117
Number sa sfied 1767 3036 2560 2751 1705 1659 2605 2421 3211 3572 3620
Total 4745 4738 4738 4738 2920 2920 4745 4745 4745 4745 4745
Outside comfort zone 62.8% 35.9% 46.1% 42.1% 41.6% 43.2% 44.9% 48.8% 32.2% 24.6% 23.5%
Within comfort zone 37.2% 64.1% 54.0% 58.1% 58.4% 56.8% 54.9% 51.0% 67.7% 75.3% 76.3%
CO2 concentra on (ppm) MODEL 5 MODEL 6 MODEL 7 MODEL 8 MODEL 9 MODEL 10 MODEL 11
Min 405 403 403 0 400 400 400
Max 2721 1379 1382 1420 1844 2020 2015
Above 1500 151 0 0 0 0 0 0
Total 4745 4744 4744 4744 4744 4744 4744
% Above 3.18% 0.00% 0.00% 0.00% 0.00% 0.00% 0.00%
0%
10%
20%
30%
40%
50%
60%
70%
80%
90%
100%
MODEL 1 MODEL 2 MODEL 3 MODEL 4 MODEL 5 MODEL 6 MODEL 7 MODEL 8 MODEL 9 MODEL 10 MODEL 11
CAFE - Percentage within and outside the comfort range
Within comfort zone Outside comfort zone
Comfort Criteria
Month Lower bound Upper bound
January 16.5 22.5
February 17 23
March 18 24.5
April 19.5 25.5
May 20.5 26.5
June 21.5 27.5
July 22 28.5
August 22 28.5
September 19 26
October 19.5 25.5
November 18 24
December 16.5 22.5
Modeling results: Energy Demand and Resulting Carbon Emissions
ACH-Cafe ACH-Theatre
TEMPERATURE results
-5
0
5
10
15
20
25
30
35
temperature(oC)
Outdoor temperatures and theatre temperatures, annual at 11:30-14:30,18:30-21:30
Outdoor temperatures (DSY) Theatre temperature
-10
-5
0
5
10
15
20
25
30
35
40
January
February
March
April
May
June
July
August
September
October
November
December
Outdoor temperatures and cafe temperatures,annual at 7:30-19:30
Outdoor temperature (DSY) Café temperature
temperature(oC)