Hifi Babe North Delhi Call Girl Service Fun Tonight
1 introductory slides (1)
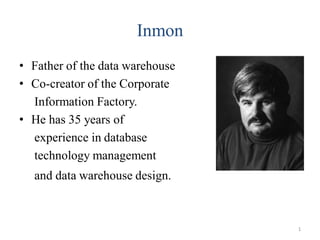
1. Inmon
• Father of the data warehouse
• Co-creator of the Corporate
Information Factory.
• He has 35 years of
experience in database
technology management
and data warehouse design.
1
2. Inmon-Cont’d
• Bill has written about a variety
of topics on the building, usage,
& maintenance of the data warehouse
& the Corporate Information Factory.
• He has written more than 650
articles (Datamation, ComputerWorld,
and Byte Magazine).
• Inmon has published 45 books.
– Many of books has been translated to Chinese, Dutch,
French, German, Japanese, Korean, Portuguese, Russian,
and Spanish.
2
3. Introduction
• What is Data Warehouse?
A data warehouse is a collection of integrated
databases designed to support a DSS.
• According to Inmon’s (father of data warehousing)
definition
– It is a collection of integrated, subject-oriented
databases designed to support the DSS function,
where each unit of data is non-volatile and
relevant to some moment in time.
3
4. Characteristics of Data Warehouse
• Subject oriented. Data are organized based on how
the users refer to them.
• Integrated. All inconsistencies regarding naming
convention and value representations are removed.
• Nonvolatile. Data are stored in read-only format and
do not change over time.
• Time variant. Data are not current but normally time
series.
4
7. Data Integrated
• Integration –consistency naming conventions and
measurement attributers, accuracy, and common
aggregation.
• Establishment of a common unit of measure for all
synonymous data elements from dissimilar database.
• The data must be stored in the DW in an integrated,
globally acceptable manner
7
9. Time Variant
• Every piece of data contained within the warehouse
must be associated with a particular point in time if
any useful analysis is to be conducted with it.
• Another aspect of time variance in DW data is that,
once recorded, data within the warehouse cannot be
updated or changed.
9
10. Nonvolatility
• Typical activities such as deletes, inserts, and changes
that are performed in an operational application
environment are completely nonexistent in a DW
environment.
• Only two data operations are ever performed in the
DW: data loading and data access.
10
11. Why Do We Need Data Warehouses?
• Consolidation of information resources
• Improved query performance
• Separate research and decision support functions
from the operational systems
• Foundation for data mining, data visualization,
advanced reporting and OLAP tools
11
12. Data Warehouse Usage
• Three kinds of data warehouse applications
– Information processing
• supports querying, basic statistical analysis, and reporting
using crosstabs, tables, charts and graphs
– Analytical processing
• multidimensional analysis of data warehouse data
• supports basic OLAP operations, slice-dice, drilling, pivoting
– Data mining
• knowledge discovery from hidden patterns
• supports associations, constructing analytical models,
performing classification and prediction, and presenting the
mining results using visualization tools
12
13. Data Warehouses, Data Marts, and
Operational Data Stores
• Data Warehouse – The queryable source of data in the
enterprise. It is comprised of the union of all of its
constituent data marts.
• Data Mart – A logical subset of the complete data
warehouse. Often viewed as a restriction of the data
warehouse to a single business process or to a group
of related business processes targeted toward a
particular business group.
• Operational Data Store (ODS) – A point of integration
for operational systems that developed independent of
each other. Since an ODS supports day to day
operations, it needs to be continually updated.
1
14. • Goals
• Structure
• Size
• Performance optimization
• Technologies used
How Do Data Warehouses Differ From
Operational Systems?
2
16. Data Warehouse vs. Operational DBMS
• OLTP (on-line transaction processing)
– Major task of traditional relational DBMS
– Day-to-day operations: purchasing, inventory, banking,
manufacturing, payroll, registration, accounting, etc.
• OLAP (on-line analytical processing)
– Major task of data warehouse system
– Data analysis and decision making
• Distinct features (OLTP vs. OLAP):
– User and system orientation: customer vs. market
– Data contents: current, detailed vs. historical, consolidated
– Database design: ER + application vs. star + subject
– View: current, local vs. evolutionary, integrated
– Access patterns: update vs. read-only but complex queries 4
17. OLTP vs. OLAP
OLTP OLAP
users clerk, IT professional knowledge worker
function day to day operations decision support
DB design application-oriented subject-oriented
data current, up-to-date
detailed, flat relational
isolated
historical,
summarized, multidimensional
integrated, consolidated
usage repetitive ad-hoc
access read/write
index/hash on prim. key
lots of scans
unit of work short, simple transaction complex query
# records accessed tens millions
#users thousands hundreds
DB size 100MB-GB 100GB-TB
metric transaction throughput query throughput, response
5
18. From Tables and Spreadsheets to Data Cubes
• A data warehouse is based on a multidimensional data model which
views data in the form of a data cube
• A data cube, such as sales, allows data to be modeled and viewed in
multiple dimensions
– Dimension tables, such as item (item_name, brand, type), or
time(day, week, month, quarter, year)
– Fact table contains measures (such as dollars_sold) and keys to
each of the related dimension tables
• In data warehousing literature, an n-D base cube is called a base
cuboid. The top most 0-D cuboid, which holds the highest-level of
summarization, is called the apex cuboid. The lattice of cuboids
forms a data cube. 6
19. Dimension and Fact tables
price
category
pname
pid country
state
city
locid
sales
locid
timeid
pid
holiday_flag
week
date
timeid month quarter year
(Fact table)
SALES
TIMES
PRODUCTS LOCATIONS
(Dimension)
(Dimension table) (Dimension table)
The main relation, which relates dimensions to a measure, is
called the fact table. Each dimension can have additional
attributes and an associated dimension table.
E.g., Products(pid, pname, category, price)
Fact tables are much larger than dimensional tables.
20. Conceptual Modeling of Data Warehouses
• Modeling data warehouses: dimensions & measures
Star schema: A fact table in the middle connected to a set of
dimension tables
Snowflake schema: A refinement of star schema where some
dimensional hierarchy is normalized into a set of smaller
dimension tables, forming a shape similar to snowflake
Fact constellations: Multiple fact tables share dimension tables,
viewed as a collection of stars, therefore called galaxy
schema or fact constellation
1
21. Terms
• Fact table
• Dimension tables
• Measures
sale
orderId
date
custId
prodId
storeId
qty
amt
customer
custId
name
address
city
product
prodId
name
price
store
storeId
city
2
22. Star
customer custId name address city
53 joe 10 main sfo
81 fred 12 main sfo
111 sally 80 willow la
product prodId name price
p1 bolt 10
p2 nut 5
store storeId city
c1 nyc
c2 sfo
c3 la
sale oderId date custId prodId storeId qty amt
o100 1/7/97 53 p1 c1 1 12
o102 2/7/97 53 p2 c1 2 11
105 3/8/97 111 p1 c3 5 50
3
24. Example of Star Schema
time_key
day
day_of_the_week
month
quarter
year
time
location_key
street
city
state_or_province
country
location
Sales Fact Table
time_key
item_key
branch_key
location_key
units_sold
dollars_sold
avg_sales
Measures
item_key
item_name
brand
type
supplier_type
item
branch_key
branch_name
branch_type
branch
5
25. Example of Snowflake Schema
time_key
day
day_of_the_week
month
quarter
year
time
location_key
street
city_key
location
Sales Fact Table
time_key
item_key
branch_key
location_key
units_sold
dollars_sold
avg_sales
Measures
item_key
item_name
brand
type
supplier_key
item
branch_key
branch_name
branch_type
branch
supplier_key
supplier_type
supplier
city_key
city
state_or_province
country
city
6
26. Example of Fact Constellation
time_key
day
day_of_the_week
month
quarter
year
time
location_key
street
city
province_or_state
country
location
Sales Fact Table
time_key
item_key
branch_key
location_key
units_sold
dollars_sold
avg_sales
Measures
item_key
item_name
brand
type
supplier_type
item
branch_key
branch_name
branch_type
branch
Shipping Fact Table
time_key
item_key
shipper_key
from_location
to_location
dollars_cost
units_shipped
shipper_key
shipper_name
location_key
shipper_type
shipper
7
28. Multidimensional Data Model Fact Table
• Collection of numeric measures, which
depend on a set of dimensions.
– E.g., measure Sales, dimensions
Product (key: pid), Location (locid),
and Time (timeid).
8 10 10
30 20 50
25 8 15
1 2 3
timeid
pid
11
12
13
11 1 1 25
11 2 1 8
11 3 1 15
12 1 1 30
12 2 1 20
12 3 1 50
13 1 1 8
13 2 1 10
13 3 1 10
11 1 2 35
pid
timeid
locid
sales
locid
Slice locid=1
is shown:
29. Dimension Hierarchies
For each dimension, the set of values can be
organized in a hierarchy
PRODUCT
TIME
LOCATION
category week month state
pane date city
year
quarter country
30. A Concept Hierarchy: Dimension (location)
all
Europe North_America
Mexico
Canada
Spain
Germany
Vancouver
M. Wind
L. Chan
...
...
...
... ...
...
all
region
office
country
Toronto
Frankfurt
city
4
31. 5
Representing Multi-Dimensional Data
• Example of two-dimensional query.
– What is the total revenue generated by property sales in
each city, in each quarter of 1997?’
• Choice of representation is based on types
of queries end-user may ask.
• Compare representation - three-field
relational table versus two-dimensional
matrix.
33. 7
Representing Multi-Dimensional
Data
• Example of three-dimensional query.
– ‘What is the total revenue generated by property sales
for each type of property (Flat or House) in each city,
in each quarter of 1997?’
• Compare representation - four-field
relational table versus three-dimensional
cube.
35. 9
Representing Multi-Dimensional Data
• Cube represents data as cells in an array.
• Relational table only represents multi-
dimensional data in two dimensions.
36. Cuboids Corresponding to the Cube
all
product date country
product,date product,country date, country
product, date, country
0-D(apex) cuboid
1-D cuboids
2-D cuboids
3-D(base) cuboid
10
37. Cube: A Lattice of Cuboids
time,item
time,item,location
time, item, location, supplier
all
time item location supplier
time,location
time,supplier
item,location
item,supplier
location,supplier
time,item,supplier
time,location,supplier
item,location,supplier
0-D(apex) cuboid
1-D cuboids
2-D cuboids
3-D cuboids
4-D(base) cuboid
11
38. 12
Lattice of Cuboids
city, product, date
city, product city, date product, date
city product date
all
day 2
c1 c2 c3
p1 44 4
p2 c1 c2 c3
p1 12 50
p2 11 8
day 1
c1 c2 c3
p1 56 4 50
p2 11 8
c1 c2 c3
p1 67 12 50
129
39. OLAP
OLAP: Online Analytic Processing
OLAP queries are complex queries that
1
Touch large amounts of data
Discover patterns and trends in the data
Typically expensive queries that take long time
Also called decision-support queries
In contrast to OLAP:
OLTP: Online Transaction Processing
OLTP queries are simple queries, e.g., over banking or airline
systems
OLTP queries touch small amount of data for fast transactions
40. What is OLAP?
• OLAP is an analytical technique that combines
data access tools with an analytical database
engine. In contrast to the simple rows and
columns structure of relational databases,
OLAP uses a multi-dimensional view of data.
OLAP uses calculations and transformations to
perform its analytical tasks.
41. 3
Introducing OLAP
• Enables users to gain a deeper
understanding and knowledge about various
aspects of their corporate data through fast,
consistent, interactive access to a wide
variety of possible views of the data.
• Allows users to view corporate data in such
a way that it is a better model of the true
dimensionality of the enterprise.
42. OLTP vs. OLAP
On-Line Transaction Processing (OLTP):
– technology used to perform updates on operational or
transactional systems (e.g., point of sale systems)
On-Line Analytical Processing (OLAP):
– technology used to perform complex analysis of the data
in a data warehouse
OLAP is a category of software technology that enables
analysts, managers, and executives to gain insight into data
through fast, consistent, interactive access to a wide variety
of possible views of information that has been transformed
from raw data to reflect the dimensionality of the enterprise
as understood by the user.
[source: OLAP Council: www.olapcouncil.org] 4
43. EXAMPLE OLAP APPLICATIONS
Market Analysis
Find which items are frequently sold over the summer but
not over winter?
Credit Card Companies
Given a new applicant, does (s)he a credit-worthy?
Need to check other similar applicants (age,gender,income,etc…)
and observe how they perform, then do prediction for new
applicant
OLAP queries are also called “decision support” queries
5
44. RELATIONAL OLAP: ROLAP
• Data are stored in relational model (tables)
• Special schema called Star Schema
• One relation is the fact table, all the others are dimension
tables
6
45. MOLAP
Unlike ROLAP, in MOLAP data are stored in special structure
called “Data Cubes” (Array-bases storage)
Data cubes pre-compute and aggregate the data
Possibly several data cubes with different granularities
Data cubes are aggregated materialized views over the data
As long as the data does not change frequently, the overhead of
data cubes is manageable
7
46. MOLAP vs ROLAP
• In Multidimensional OLAP ( MOLAP ), data is
stored in a special OLAP database server, after being
extracted from various sources, in pre-aggregated
cubic format. In contrast to this approach, Relational
OLAP ( ROLAP ) does not use an intermediate server
because it can work directly against the relational
database.
47. 9
ROLAP Server
• Relational OLAP Server
relational
DBMS
ROLAP
server
tools
utilities
sale prodId date sum
p1 1 62
p2 1 19
p1 2 48
Special indices, tuning;
Schema is “denormalized”
48. 10
MOLAP Server
• Multi-Dimensional OLAP Server
multi-
dimensional
server
M.D. tools
utilities
could also
sit on
relational
DBMS
Product
Date
1 2 3 4
milk
soda
eggs
soap
A
B
Sales
51. 13
Relational OLAP (ROLAP)
• Fastest growing style of OLAP technology.
• Supports RDBMS products using a metadata layer
- avoids need to create a static multi-dimensional
data structure - facilitates the creation of multiple
multi-dimensional views of the two-dimensional
relation.
52. 14
Relational OLAP (ROLAP)
• To improve performance, some products
use SQL engines to support complexity of
multi-dimensional analysis, while others
recommend, or require, the use of highly
denormalized database designs such as the
star schema.
54. 16
Multi-Dimensional OLAP Servers
• Use multi-dimensional structures to store data and
relationships between data.
• Multi-dimensional structures are best visualized
as cubes of data, and cubes within cubes of data.
Each side of cube is a dimension.
• A cube can be expanded to include other
dimensions.
55. 17
Multi-Dimensional OLAP Servers
• In summary, pre-aggregation, dimensional
hierarchy, and sparse data management can
significantly reduce the size of the cube and the
need to calculate values ‘on-the-fly’.
• Removes need for multi-table joins and provides
quick and direct access to arrays of data, thus
significantly speeding up execution of multi-
dimensional queries.
57. OLAP
OLAP: Online Analytic Processing
OLAP queries are complex queries that
1
Touch large amounts of data
Discover patterns and trends in the data
Typically expensive queries that take long time
Also called decision-support queries
In contrast to OLAP:
OLTP: Online Transaction Processing
OLTP queries are simple queries, e.g., over banking or airline
systems
OLTP queries touch small amount of data for fast transactions
58. What is OLAP?
• OLAP is an analytical technique that combines
data access tools with an analytical database
engine. In contrast to the simple rows and
columns structure of relational databases,
OLAP uses a multi-dimensional view of data.
OLAP uses calculations and transformations to
perform its analytical tasks.
59. 3
Introducing OLAP
• Enables users to gain a deeper
understanding and knowledge about various
aspects of their corporate data through fast,
consistent, interactive access to a wide
variety of possible views of the data.
• Allows users to view corporate data in such
a way that it is a better model of the true
dimensionality of the enterprise.
60. OLTP vs. OLAP
On-Line Transaction Processing (OLTP):
– technology used to perform updates on operational or
transactional systems (e.g., point of sale systems)
On-Line Analytical Processing (OLAP):
– technology used to perform complex analysis of the data
in a data warehouse
OLAP is a category of software technology that enables
analysts, managers, and executives to gain insight into data
through fast, consistent, interactive access to a wide variety
of possible views of information that has been transformed
from raw data to reflect the dimensionality of the enterprise
as understood by the user.
[source: OLAP Council: www.olapcouncil.org] 4
61. EXAMPLE OLAP APPLICATIONS
Market Analysis
Find which items are frequently sold over the summer but
not over winter?
Credit Card Companies
Given a new applicant, does (s)he a credit-worthy?
Need to check other similar applicants (age,gender,income,etc…)
and observe how they perform, then do prediction for new
applicant
OLAP queries are also called “decision support” queries
5
62. RELATIONAL OLAP: ROLAP
• Data are stored in relational model (tables)
• Special schema called Star Schema
• One relation is the fact table, all the others are dimension
tables
6
63. MOLAP
Unlike ROLAP, in MOLAP data are stored in special structure
called “Data Cubes” (Array-bases storage)
Data cubes pre-compute and aggregate the data
Possibly several data cubes with different granularities
Data cubes are aggregated materialized views over the data
As long as the data does not change frequently, the overhead of
data cubes is manageable
7
64. MOLAP vs ROLAP
• In Multidimensional OLAP ( MOLAP ), data is
stored in a special OLAP database server, after being
extracted from various sources, in pre-aggregated
cubic format. In contrast to this approach, Relational
OLAP ( ROLAP ) does not use an intermediate server
because it can work directly against the relational
database.
65. 9
ROLAP Server
• Relational OLAP Server
relational
DBMS
ROLAP
server
tools
utilities
sale prodId date sum
p1 1 62
p2 1 19
p1 2 48
Special indices, tuning;
Schema is “denormalized”
66. 10
MOLAP Server
• Multi-Dimensional OLAP Server
multi-
dimensional
server
M.D. tools
utilities
could also
sit on
relational
DBMS
Product
Date
1 2 3 4
milk
soda
eggs
soap
A
B
Sales
69. 13
Relational OLAP (ROLAP)
• Fastest growing style of OLAP technology.
• Supports RDBMS products using a metadata layer
- avoids need to create a static multi-dimensional
data structure - facilitates the creation of multiple
multi-dimensional views of the two-dimensional
relation.
70. 14
Relational OLAP (ROLAP)
• To improve performance, some products
use SQL engines to support complexity of
multi-dimensional analysis, while others
recommend, or require, the use of highly
denormalized database designs such as the
star schema.
72. 16
Multi-Dimensional OLAP Servers
• Use multi-dimensional structures to store data and
relationships between data.
• Multi-dimensional structures are best visualized
as cubes of data, and cubes within cubes of data.
Each side of cube is a dimension.
• A cube can be expanded to include other
dimensions.
73. 17
Multi-Dimensional OLAP Servers
• In summary, pre-aggregation, dimensional
hierarchy, and sparse data management can
significantly reduce the size of the cube and the
need to calculate values ‘on-the-fly’.
• Removes need for multi-table joins and provides
quick and direct access to arrays of data, thus
significantly speeding up execution of multi-
dimensional queries.
75. Typical OLAP Operations
• Roll up (drill-up): summarize data
– by climbing up hierarchy or by dimension reduction
• Drill down (roll down): reverse of roll-up
– from higher level summary to lower level summary or
detailed data, or introducing new dimensions
• Slice and dice: project and select
• Pivot (rotate):
– reorient the cube, visualization, 3D to series of 2D planes
• Other operations
– drill across: involving (across) more than one fact table
– drill through: through the bottom level of the cube to its
back-end relational tables (using SQL)
1
78. DATA MINING vs. OLAP
4
OLAP – Online Analytical
Processing
Provides you with a very
good view of what is
happening, but can not
predict what will happen
in the future or why it is
happening
Data Mining is a combination of discovering
techniques + prediction techniques
79. Design of Data Warehouse: A Business Analysis
Framework
• Four views regarding the design of a data warehouse
– Top-down view
• allows selection of the relevant information necessary for the data
warehouse
– Data source view
• exposes the information being captured, stored, and managed by
operational systems
– Data warehouse view
• consists of fact tables and dimension tables
– Business query view
• sees the perspectives of data in the warehouse from the view of end-
user
1
80. Data Warehouse Design Process
• Top-down, bottom-up approaches or a combination of both
– Top-down: Starts with overall design and planning (mature)
– Bottom-up: Starts with experiments and prototypes (rapid)
• From software engineering point of view
– Waterfall: structured and systematic analysis at each step before
proceeding to the next
– Spiral: rapid generation of increasingly functional systems, short turn
around time, quick turn around
• Typical data warehouse design process
– Choose a business process to model, e.g., orders, invoices, etc.
– Choose the grain (atomic level of data) of the business process
– Choose the dimensions that will apply to each fact table record
– Choose the measure that will populate each fact table record
2
81. Data Warehouse: A Multi-Tiered Architecture
Data
Warehouse
Extract
Transform
Load
Refresh
OLAP Engine
Analysis
Query
Reports
Data mining
Monitor
&
Integrator
Metadata
Data Sources Front-End Tools
Serve
Data Marts
Operational
DBs
Other
sources
Data Storage
OLAP Server
3
82. Three Data Warehouse Models
• Enterprise warehouse
– collects all of the information about subjects spanning the
entire organization
• Data Mart
– a subset of corporate-wide data that is of value to a specific
groups of users. Its scope is confined to specific, selected
groups, such as marketing data mart
• Independent vs. dependent (directly from warehouse) data mart
• Virtual warehouse
– A set of views over operational databases
– Only some of the possible summary views may be
materialized
4
83. Building a Data Warehouse
– Analysis
– Design
– Import data
– Install front-end tools
– Test and deploy
Data Warehouse Lifecycle
5
84. Stage 1: Analysis
• Identify:
– Target Questions
– Data needs
– Timeliness of data
– Granularity
• Create an enterprise-level data dictionary
• Dimensional analysis
– Identify facts and dimensions
Analysis
– Design
– Import data
– Install front-end tools
– Test and deploy
6
85. Stage 2: Design
• Star schema
• Data Transformation
• Aggregates
• Pre-calculated
Values
• HW/SW
Architecture
– Analysis
Design
– Import data
– Install front-end tools
– Test and deploy
Dimensional Modeling
7
86. Dimensional Modeling
• Fact Table – The primary table in a
dimensional model that is meant to contain
measurements of the business.
• Dimension Table – One of a set of
companion tables to a fact table.
• Most dimension tables contain many
textual attributes that are the basis for
constraining and grouping within data
warehouse queries.
8
87. Stage 3: Import Data
• Identify data sources
• Extract the needed data from
existing systems to a data
staging area
• Transform and Clean the data
– Resolve data type conflicts
– Resolve naming and key
conflicts
– Remove, correct, or flag bad data
– Conform Dimensions
• Load the data into the
warehouse
– Analysis
– Design
Import data
– Install front-end tools
– Test and deploy
9
88. Importing Data Into the Warehouse
OLTP 1
OLTP 2
OLTP 3
Data Staging Area Data
Warehouse
Operational Systems
(source systems)
10
89. Stage 4: Install Front-end Tools
• Reporting tools
• Data mining tools
• GIS
• Etc.
– Analysis
– Design
– Import data
Install front-end tools
– Test and deploy
11
90. Stage 5: Test and Deploy
• Usability tests
• Software installation
• User training
• Performance tweaking based on usage
– Analysis
– Design
– Import data
– Install front-end tools
Test and deploy
12