
Recommended
More Related Content
More from susan70
More from susan70 (20)
Statistics and Graphs
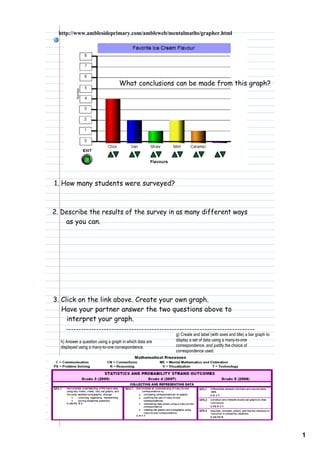
- 1. http://www.amblesideprimary.com/ambleweb/mentalmaths/grapher.html What conclusions can be made from this graph? 1. How many students were surveyed? 2. Describe the results of the survey in as many different ways as you can. 3. Click on the link above. Create your own graph. Have your partner answer the two questions above to interpret your graph. --------------------------------------------------------------------------- g﴿ Create and label ﴾with axes and title﴿ a bar graph to h﴿ Answer a question using a graph in which data are display a set of data using a manytoone displayed using a manytoone correspondence. correspondence, and justify the choice of correspondence used. 1