
Recommended
More Related Content
What's hot
Similar to Crepp Crack Initiation in 2.25%Cr-1Mo Steel
Similar to Crepp Crack Initiation in 2.25%Cr-1Mo Steel (20)
Recently uploaded
Recently uploaded (20)
Crepp Crack Initiation in 2.25%Cr-1Mo Steel
- 1. Creep crack initiation and growth in 2.25% chromium - 1% molybdenum alloy steel COLLINGTON, Rachel A. Available from Sheffield Hallam University Research Archive (SHURA) at: http://shura.shu.ac.uk/3172/ This document is the author deposited version. You are advised to consult the publisher's version if you wish to cite from it. Published version COLLINGTON, Rachel A. (2001). Creep crack initiation and growth in 2.25% chromium - 1% molybdenum alloy steel. Doctoral, Sheffield Hallam University. Copyright and re-use policy See http://shura.shu.ac.uk/information.html Sheffield Hallam University Research Archive http://shura.shu.ac.uk
- 2. REFERENCE
- 3. ProQuest Number: 10694376 All rights reserved INFORMATION TO ALL USERS The quality of this reproduction is d e p e n d e n t upon the quality of the copy subm itted. In the unlikely even t that the author did not send a co m p le te m anuscript and there are missing pages, these will be noted. Also, if m aterial had to be rem oved, a note will indicate the deletion. uest ProQuest 10694376 Published by ProQuest LLC(2017). C opyright of the Dissertation is held by the Author. All rights reserved. This work is protected against unauthorized copying under Title 17, United States C ode Microform Edition © ProQuest LLC. ProQuest LLC. 789 East Eisenhower Parkway P.O. Box 1346 Ann Arbor, Ml 48106- 1346
- 4. CREEP CRACK INITIATION AND GROWTH IN 2.25% CHROMIUM -1% MOLYBDENUM ALLOY STEEL Rachel A. Collington A thesis submitted in partial fulfilment of the requirements of Sheffield Hallam University for the degree of Doctor of Philosophy April 2001 Collaborating Establishment: Alstom Energy, UK, Ltd.
- 5. HALUfTT^r
- 6. Preface This thesis is submitted in partial fulfilment of the requirements of Sheffield Hallam University for the degree of Doctor of Philosophy. It contains an account of research carried out, on a part-time basis, between May 1988 and December 2000 in the School of Engineering and Materials Research Institute at Sheffield Hallam University. Supervision of the project was by Dr J. Cawley and Dr R. Stratton of Sheffield Hallam University and Dr S. Holdsworth of Alstom Energy, UK, Ltd. Except where acknowledged and referenced, this work is, to the best of my knowledge, original and has been carried out independently. No part of this thesis has been, or is currently being, submitted for any degree or diploma at this, or any other, university. Rachel A. Collington March 2001
- 7. Acknowledgements I wish to acknowledge Dr Jess Cawley for his continuing support and supervision of this project and for not giving up on me during the difficult times. I would like to thank Dr Rod Stratton and Dr Stuart Holdsworth for their advice and guidance, particularly in the early stages of this project. For his encouragement and guidance during the arduous writing up stage I would like to express my sincere gratitude to Dr Robin Acheson. Many thanks go to all my colleagues in both the School of Engineering and The Materials Research Institute who have provided help and given their support throughout. And last, but definitely not least, I would like to acknowledge the love and support given to me by my partner Lawrence and my children Elliot and Amelia. This is for you! iii
- 8. Abstract 2.25%Cr-1%Mo Steel has been utilised extensively for the manufacture of power plant components. This study has highlighted the implication of the presence of pre-existing defects in such components and, in particular, the influence of the microstructure on the creep deformation response ahead of a defect during the crack initiation, or incubation, period. The investigation was conducted by carrying out creep tests on compact tension specimens in three microstructural variations of the alloy and, subsequently, using optical, scanning and transmission electron microscopy techniques to evaluate the creep damage in the “defect” tip region up to a point where ~1mm of crack extension was detected. Details of two image analysis routines devised specifically for this project have been presented and their suitability for purpose discussed. The first of these routines allowed the distribution and density of creep voids occurring ahead of the simulated defect to be quantified using back scattered electron imaging in the scanning electron microscope. The second allowed carbides, extracted from the alloy, to be classified in the STEM on the basis of their key element ratios. The microstructural constraint imposed by the material ahead of the defect tip was shown to critically affect the crack initiation and growth process; the order of constraint observed being that of 100% bainite > mixed ferrite / bainite > mixed ferrite / pearlite. A correlation between the carbide type, distribution and shape and the creep deformation and crack initiation process has been discussed and the implications of this to remanent life assessment suggested. Evolution of M23 C6 grain boundary carbides to the equilibrium carbide, M6C, and the affect of the grain boundary sliding on the shape of the M6C, were proposed to be the most important microstructural phenomena contributing to the crack initiation process. A detailed review of published literature relating to the topic studied and recommendations for further work have also been included in this thesis. iv
- 9. Contents Page Preface ii Acknowledgements iii Abstract iv Contents v Nomenclature and Abbreviations ix Chapter 1.0 Introduction 1 Chapter 2.0 Literature Review 8 2.1 Introduction 2.2 The Chromium - Molybdenum Creep Resisting Steels 9 2.2.1 The Transformation Structure 10 2.2.2 The Carbide Structure 13 2.3 Creep Deformation 19 2.3.1 Creep Deformation Mechanisms and Maps 21 2.3.2 Creep Deformation of Chromium - Molybdenum, 25 Steels 2.4 Creep Fracture 30 2.4.1 Creep Fracture Mechanisms 31 2.4.2 Creep Cavity Initiation and Growth 33 2.4.3 Creep in the Presence of a Pre-existing Defect 41 2.5 Creep Failure Prediction and Remanent Life 47 Assessment 2.5.1 Creep Life Assessment of Initially ‘Defect Free’ 47 Structures 2.5.2 Creep Life Assessment of Structures Containing 52 Pre-existing Defects 2.5.3 Microstructural Investigation Techniques for 59 Creep Life Prediction Methods Chapter 3.0 Experimental Procedures 61 3.1 Introduction 3.2 Raw Materials v 62 65
- 10. Contents cont. 3.3 Heat Treatment 67 3.3.1 Production of 100% Bainite CT Creep Test 67 Specimens 3.3.2 Bainite Tempering Investigation 68 3.4 Mechanical Testing 69 3.4.1 Hardness Tests 69 3.4.2 Tensile Tests 70 3.4.3 Creep Deformation Tests 70 3.4.3 (a) Creep Rig Design 70 3.4.3 (b) Creep Test Specimens and Loading 73 Regime 3.4.3 (c) Crack Opening Displacement 75 Measurement 3.5 Optical Microscopy Techniques 77 3.5.1 Specimen Preparation and Microstructural 77 Examination 3.5.2 Grain Size Determination 77 3.5.3 Determination of the Volume Fraction of 78 Transformation Products 3.6 Electron Microscopy Techniques 79 3.6.1 Scanning Electron Microscopy 79 3.6.1(a) SEM Specimen Preparation 80 3.6.1(b) General SEM Examination 81 3.6.1(c) Creep Damage Quantification using 81 SEM Image Analysis 3.6.2 Transmission and Scanning Transmission 84 Electron Microscopy 3.6.2(a) Preparation of Carbon Extraction 85 Replicas 3.6.2(b) Preparation of Thin Foils 86 3.6.2(c) Microstructural Examination in the 87 TEM 3.6.2(d) Carbide Characterisation by Image 88 Analysis in the STEM Chapter 4.0 Experimental Results 92 4.1 Introduction 93 4.2 Characterisation of the Starting Materials 93 vi
- 11. Contents cont. 4.2.1 Mechanical Properties 94 4.2.2 Optical Microscopy 95 4.2.3 Scanning Electron Microscopy 96 4.2.4 Transmission Electron Microscopy 98 4.3 The Tempering Behaviour of Fully Bainitic 2.25%Cr- 110 1%Mo Alloy Steel 4.3.1 Hardness Test Results 111 4.3.2 Microstructural Changes During Tempering 113 4.3.2(a) Examination by Scanning Electron 113 Microscopy 4.3.2(b) Examination by Scanning 114 Transmission Electron Microscopy 4.4 Creep Testing and Deformation Assessment 129 4.4.1 Crack Opening Displacement Measurement 129 4.4.2 Creep Damage Assessment in the Scanning 135 Electron Microscope 4.4.2(a) 100% Bainite Specimens 135 4.4.2(b) Mixed Pro-eutectoid Ferrite / Bainite 147 Specimens 4.4.2(c) Mixed Pro-eutectoid Ferrite / Pearlite 159 Specimens 4.4.3 Correlation and Summary Of The Creep Test 168 Investigation Data 4.4.4 Carbide Analysis of Creep Tested Materialsin 174 the TEM 4.4.4(a) Carbide Analysis of the 100% Bainite 174 Specimens 4.4.4(b) Carbide Analysis of the Mixed Ferrite / 176 Bainite Specimens Chapter 5.0 Discussion 187 5.1 Starting Structures and Basic Mechanical Properties 188 of 2.25%Cr-1%Mo 5.1.1 Transformation Structures 188 5.1.2 Carbide Structure 190 5.1.3 Basic Mechanical Properties 194 5.2 Tempering Characteristics And The Carbide 195 Evolution Process In 2.25%Cr-1%Mo Steel. 5.3 Creep Deformation in the Presence of a Pre-existing 200 Defect vii
- 12. Contents cont. 5.3.1 Creep Damage Response 200 5.3.2 The Affect of Microstructural Variables on the 207 Creep Crack Initiation and Growth Process 5.3.3 The Contribution of Grain Boundary Carbides to 213 the Creep Crack Initiation Process 5.4 Contribution to Life Assessment Strategy 216 5.4.1 The Effect of Notch Tip Constraint and Life-Time 216 Prediction 5.4.2 The Mechanisms of Creep Deformation 219 Occurring Ahead of a Pre-existing Defect and Life-Time Prediction 5.4.3 Carbide Evolution and Life-Time Prediction 220 5.5 Experimental Considerations and Suggestions for 221 Further Work Chapter 6.0 Conclusions 223 References 228 Appendices 242 Appendix 1 Creep Data For The Derivation Of aref. 243 Appendix 2 EDX Spot Analysis For The Determination Of 245 Carbide Classification Schemes Appendix 3 Elemental Factors Determined for Use in the 247 STEM Image Analysis Routine Appendix 4 Published Paper 248 Index 256 Index to Table Nos. 257 Index to Figure Nos. 259 Index to Plate Nos. 263 viii
- 13. Nomenclature and Abbreviations a Crack length a Crack growth rate Aci The eutectoid reaction temperature on cooling Ac3 The austenite - ferrite transformation temperature on cooling b Burgers vector B Specimen thickness BCC Body-centred cubic Bn Net specimen thickness C Constant in the Larson-Miller equation Coo Solute concentration in a solvent when a particle has an infinite radius of curvature C* Creep crack parameter CCT Continuous cooling transformation CDM’s Continuum damage mechanics COD Crack opening displacement CT Compact tension CTOD Crack tip opening displacement d Grain diameter as measured by the mean linear intercept method D Damage parameter D0 Material constant in equation for determining creep crack growth rate E Young’s modulus EDXA Energy dispersive X-ray analysis f0 Reaction force of a precipitate against dislocation movement during creep FCC Face-centred cubic G Elastic strain energy release rate H Hardening parameter J J-contour integral K Linear elastic stress intensity factor Knom Nominal value of stress intensity LEFM Linear elastic fracture mechanics LMP Larson-Miller parameter LPD Load point displacement m General yield ratio M Metal atoms in alloy carbides MTDATA Metallurgical and thermodynamic data n Creep stress exponent n.a. Not applicable n.d. Not determined ix
- 14. p Diameter of a particle subjected to a stress concentration imparted by grain boundary sliding p f Applied load Q Activation energy r Mean particle radius r ’ Radius of the damage zone R Gas constant SEM Scanning electron microscope STEM Scanning transmission electron microscope t Time tf Time to failure tg Time to grow a creep crack tj Time to initiate a creep crack tr Time to rupture tx Time at stress axand temperature Tx W Failure time at stress axand temperature Tx Tx Temperature at the xthfraction of creep life T Temperature TEM Transmission electron microscope Tm Homologous temperature Vm Molar volume of a dispersed phase W Specimen width xc Crack initiation criterion Y Specimen compliance function a Ferrite ^ Specimen load point displacement s Epsilon carbide £o Strain rate in uniaxial creep e Creep ductility in uniaxial tension Ef* Local rupture strain £ Secondary creep rate £x Strain at stress oxand time tf Cxf Failure strain at stress axand W <j> Material constant in equation for determining creep crack growth rate Austenite Cjo Stress in uniaxial creep <TP Average stress on a particle due to grain boundary sliding (Tref Reference stress Y x
- 15. <Tx Stress at the xthfraction of creep life <Jy Yield strength E X Sum of the creep life fractions X Shear stress V Poisson’s ratio xi
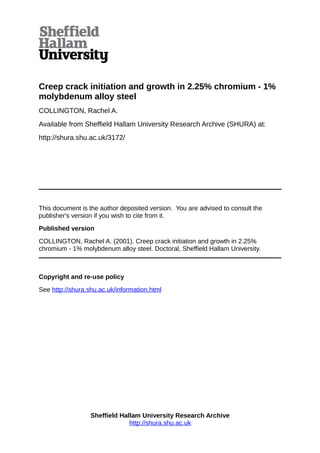
- 16. The use of steam power for the generation of electrical power has been utilised in Europe since the late 1800’s and since its introduction there has been a continuing drive to improve the efficiency of the process. The ‘efficiency’ of the thermodynamic process of coal fired power describes how much of the energy fed into the cycle is converted into electrical energy. The greater the output of electrical energy for a given amount of energy input, the higher the efficiency. It is well understood, by an examination of the Carnot cycle111, that the efficiency of a steam turbine is proportional to temperature and pressure and that relatively small increases in these bring a considerable efficiency benefit . If, therefore, the energy input is kept constant the output can be increased by selecting elevated pressures and temperatures for the water-steam cycle121, for example a temperature rise from 560°C - 600°C can provide a relative efficiency increase of 2 [31. Figure 1.1 shows the trend for higher steam conditions utilised between 1988 and the present. Live and Reheat Steam temperature 6 0 0 -I °C 550 500 9? 0 90 14 i r n I 9 9 9 • i i V V 97 IReheat steam Live steam } Europe 9 Reheat steam } Japan ^ Live steam * Double reheat 88 t 1----- 1----- 1----- 1----- 1----- 1----- 1----- 1----- 1----- 1----- 1----- 1----- 1------r 90 * 92 94 96 98 00 02 Year O f Commisioning Figure 1.1: Trend to higher steam conditions for steam power plant - after Scarlin 131 2
- 17. To enable power plant to operate at improved efficiencies there has been, since the process began, a requirement for materials with improved resistance to the high temperature deformation process of creep. The development of these creep resistant alloys is based on fundamental theories of creep deformation and fracture which are well understood and have been extensively reported [4]' l6]. Methods for predicting the lifetime of components destined for operation in high temperature environments have traditionally been based on the steady state period of creep deformation determined by testing specimens subjected to uniaxial loading conditions. It became evident, however, that there was also a need for studies to be carried out to predict the behaviour of material in non- uniaxial situations, for example material ahead of pre-existing defects in large castings or in welds . Research in this area has since been reported by many authors 171-1141with the prediction of material behaviour ahead of defects being predominantly based on fracture mechanics theory and on crack propagation rates. One of the alloys that has been used extensively for high temperature power plant components in the last five decades is 2.25%Cr-1% Mo steel. 2.25%Cr- 1%Mo steel confers good creep strength and corrosion resistance up to service temperatures of ~565°C [15] and although the current materials requirements for new plant have superseded that of the relatively low alloy Cr-Mo steels there are still a substantial number of components of this type in operation necessitating means of remanent life prediction. The long term creep resistance of 2.25%Cr-1%Mo steel is afforded by a combination of interaction solid solution hardening and precipitation hardening effects 1161the combination of which is dependent upon the initial alloy heat treatment and in service conditions. Over a period of time, at elevated temperatures in excess of ~ 400°C, the microstructure of 2.25%Cr-1%Mo steel, and in particular the carbide morphology, has been shown to age l17]. This microstructural ageing process has a direct effect on the creep strength of the 3
- 18. steel and, consequently, any design codes or remaining lifetime prediction models must take into consideration this continuously varying factor. Many attempts have been made to predict the lifetime of a component containing defects using mathematical models based on fracture mechanics theory [14] and, as a result, standards based on the use of the C* parameter and critical COD have now been established [18]. Although lifetime prediction models were initially based on crack propagation times alone it has become clear that a significant proportion of component life may also be accounted for by an incubation period prior to crack initiation and that this should also be included [11][18] . Consequently the most recent life assessment models are based on the equation : t.+tg =tf -Equation 1.1 1111 W here: tj = time to initiate a creep crack tg= time to grow the creep crack to rupture of the remaining ligament tf = component lifetime To estimate the period of crack initiation, or incubation, accurately it is necessary to understand the various contributory factors that may affect it and the most critical of these is the material microstructure. During the incubation period, it has been established that, a creep damage zone develops ahead of the pre-existing defect and that there is a redistribution of the stress intensity at the defect tip. The structural degradation that occurs in this period is dependent upon the operating stress and temperature regime and includes changes in chemistry, size, distribution and spacing of second phase particles and nucleation and growth of cavities and cracks. The gradual accumulation of damage ahead of the defect leads to strain in the component and this can be monitored in terms of crack opening displacement, 4
- 19. (COD). Critical CODs may then be defined for a given crack initiation criterion, [19], where crack initiation may be defined as the formation of the first creep cavity occurring ahead of the crack tip or the formation of an engineering sized crack, 0.5mm to 1mm long. There is a fundamental requirement to understand the physical mechanisms of crack initiation from its earliest stages and the role of the ageing microstructure on this process. To this end, establishing a crack initiation criterion of 1mm, this research project intended to correlate information regarding COD data and corresponding microstructural evidence from various structures of 2.25%Cr- 1%Mo alloy steel. In large cast components microstructural variations occur due to differences in cooling rate from the core of the castings to the surface and thin sections. The core material in large castings of normalised and tempered 2.25%Cr-1%Mo steel is typically mixed pro-eutectoid ferrite and pearlite and/or bainite and the surface material, and that in central regions of thin sections, are fully bainitic. As each of these microstructures imparts a unique resistance to the creep deformation mechanisms occurring in the alloy, components possessing these structures exhibit a range of crack opening displacement rates and creep crack initiation times. Consequently, there is a need to establish the influence of the microstructure on these parameters so that they may be accounted for in life- time and remanent life-time prediction models. The main aims of this study then were to: i) establish a relationship between critical crack opening displacement and damage accumulation in three microstructures of 2.25%Cr-1%Mo steel with a view to improving creep life prediction models and ii) to make a contribution to knowledge by proposing a mechanism for the creep cavitation and coalescence process occurring in a material ahead of a pre-existing defect. 5
- 20. To achieve the aims of this study a detailed review of the relevant literature was carried out as detailed in chapter 2. The creep deformation response of material ahead of a pre-existing defect was studied by creep testing compact tension specimens, in three microstructures of 2.25%Cr-1%Mo steel, and performing physical measurement techniques to establish their critical COD values. An extensive microstructural investigation was carried out to quantify the amount of creep damage occurring in the specimens and to establish the mechanisms by which that damage occurred. The various experimental procedures for the techniques established and used in this study are detailed in chapter 3 and are summarised below in Figure 1.2. The experimental results derived are presented and described in detail in chapter 4 and discussed in context with the current knowledge in chapter 5. Finally, chapter 6 defines the major conclusions from the investigation and highlights the contribution to knowledge. 6
- 21. CREEP DAMAGE QUANTIFICATION USING IMAGEANALYSIS IN THE SEM CREEP TESTS ON CT SPECIMENS CONTAINING SIMULATED DEFECTS 25% bAinite / 75% Pro- euteCtoid FERRITE STRUCTURE CHARACTERISATION AND GENERATION OF THREE MICROSTRUCTURAL VARIABLES OF 2.25% CR- 1%MO STEEL 90% PRO-EUTECTOID FERRITE / 10% PEARLITE STRUCTURE CRACK LENGTH (Aa) AND DETERMINATION OFCTOD TEM IMAGEANALYSIS OF CARBIDE MORPHOLOGY 100% BAINITE STRUCTURE TEMPERING TRIAL TO INVESTIGATE CARBIDE EVOLUTION SEQUENCE SEM HIGH RESOLUTION ELECTRON MICROSCOPYOF ALLOY MICROSTRUCTURE Figure 1.2: Flow diagram summarising the experimental process. 7
- 22. 2.1 Introduction The ideal material for components destined for power plant applications requires a combination of both high creep strength and creep ductility to resist deformation and fracture at high operating temperatures and stress levels. To develop new materials for such applications, and to predict the remaining lifetime of those already in service, it is necessary to fully understand the mechanisms of creep deformation and fracture and to appreciate the effect of these on the inherent and operational variables: composition, microstructure, temperature, stress, stress state, strain rate. These variables are not, of course, mutually exclusive but affect each other leading to complex inter relations which are difficult to interpret. However, due to the vast amount of research that has been conducted in the last 50 years in this area, methods of predicting the behaviour of components over long periods at elevated temperatures are now in operation and are, on the whole, being utilised successfully. The aim of this section is to review the existing knowledge regarding creep deformation and fracture in chromium - molybdenum power plant steels, and specifically 2.25%Cr-1%Mo steel, with a view to providing a basis to interpret and place the data derived in this study into context. This section necessarily begins with a consideration of the microstructure of chromium - molybdenum steels and their stability at high temperature and finishes with a review of creep remanent life assessment techniques. 2.2 The Chromium - Molybdenum Creep Resisting Steels The chromium - molybdenum, (Cr-Mo), series of steels are used widely in the power and process industries because they offer high strength at ambient and elevated temperatures combined with adequate toughness [201. The properties of the steels are a direct consequence of the material microstructure which in turn is controlled by a relatively simple heat treatment process. Microstructure and mechanical properties can, therefore, be optimised for a particular 9
- 23. application by controlling the heat treatment parameters; austenitising temperature, cooling rate and tempering temperature and duration. 2.2.1 The Transformation Structure The chromium - molybdenum steels belong to a group commonly referred to as ferritic creep resisting steels; the term ferritic being derived from the fact that on cooling from austenite, (y), the microstructure consists of one, or a combination, of three essentially body centred cubic structures, namely ferrite, bainite or martensite. For a given chemical composition the transformation product that results is dependent upon the cooling rate from the austenitising temperature. The grain size of the transformed structure can be considered as a direct function of the austenitising temperature but is regarded, generally, as only having a small influence on the long term creep resistance of the alloys [211. Cane and Fidler I22], however, showed that the grain size effect on creep properties varies from steel to steel and reported a greater dependency of creep properties on grain-size for a fully bainitic tempered 2.25%Cr-1%Mo steel than for a tempered martensitic 9%Cr-1%Mo steel. The fracture ductility of Cr-Mo steels, in particular, is considered to be adversely affected by a large grain size and consequently the austenitising temperature used for these steels does not rise significantly above the Ac3[201. In commercial applications, Cr-Mo steels are put into service in a microstructurally meta-stable condition. The structure that exists is a result of both continuous cooling from above the Ac3, to give the initial transformation product, and any subsequent stress relief / tempering treatment to develop the fine precipitate structure. The transformation product is dependent on not only the alloy composition and cooling environment but also on the section size, as indicated by reference to the continuous cooling diagrams for typical Cr - Mo steels as shown in Figure 2.1. In this figure the transformation structure can be seen to vary from ferrite and pearlite in slow cooled material, (thick sections), to 10
- 24. bainitic or even martensitic structures in rapidly cooled material, (thin sections). In the alloys containing higher chromium contents the transformation time required to produce ferrite, pearlite and bainite is significantly retarded and austenite decomposes directly to martensite. The likelihood of partitioning of elements and their effect on the kinetics of the austenite to ferrite transformation is well documented [23] and the mechanisms of diffusion controlled and diffusionless transformation to ferrite / bainite and martensite respectively have been comprehensively reviewed 1241 Both of the aforementioned papers drew attention to the effect on the creep resistance of the Cr - Mo alloys of the non-equilibrium existence of elements in either precipitate form or in solid solution in the as cooled structure and the move to equilibrium during further exposure to elevated temperatures. 27 Cr 1 Mo1 Cr 7 Mo 1000 AcAc 800 Stort "50%" 500 Finish °C 200 100 1000100 1000 1 Bar Section Diameter,mm 12 CrMoV9 Cr 1 Mo1000 AC; Ac800 600 °C 50% 50% _J_________I I 100 1000 1 Bar Section Diameter, mm Figure 2.1: Continuous cooling diagrams for some Cr-Mo Steels - after O rr[201. 11
- 25. The remainder of this section will concentrate on the development of the microstructure, for elevated temperature service, of Cr-Mo steels in the annealed or normalised conditions. During slow cooling through the Ac3- ACi region, Figure 2.1, transformation to ferrite occurs progressively, enriching the remaining austenite in carbon. Eventually any remaining austenite transforms to pearlite [23] in which the carbon precipitates as cementite, (Fe3C). In the case where strong carbide formers are present in the alloy, the cementite may be replaced by alloy carbides [25]. Up to 20% of iron atoms in cementite can be replaced by chromium, 10% by vanadium and only 4% by molybdenum without affecting the crystal structure of the carbide. The pearlite interlamellar spacing, detailed morphology and tendency to spheroidise may, however, be more significantly affected. When cooling of the alloy is sufficiently rapid to avoid the pearlite transformation curve, but not sufficient to produce diffusionless transformation to martensite, the remaining structure will consist of a mixture of ferrite and bainite or may even be fully bainitic. In the austenite to bainite reaction, the austenite may transform to bainite in two ways [261; i) to upper bainite where cementite forms between the bainitic ferrite laths only, or ii) to lower bainite where the cementite additionally forms within the platelets of ferrite. During the displacive transformation to bainite [26] there is no diffusion of substitutional iron atoms across the transformation interface. The excess carbon trapped in the bainitic ferrite is removed by a combination of diffusion into the residual austenite and by precipitation of carbides between the ferrite plates. In the situation where pro-eutectoid ferrite forms prior to the transformation to bainite, the enhanced concentration of carbon in the remaining austenite, due to its rejection from the ferrite, leads to an increased density of cementite 12
- 26. particles in the bainite phase when compared to that in fully bainitic structure [24] In all cases, the carbides in the as cooled condition do not exist in their equilibrium state and subsequent heat treatment and service at elevated temperatures leads to a change in their composition and morphology that consequently affects their long term creep properties. This process will be reviewed in the following section. 2.2.2 The Carbide Structure In developing alloys for service at elevated temperatures the aim is to produce a material which not only withstands the initial service conditions but is capable of withstanding the service conditions throughout the whole of the expected design life, ~20 years for power plant components. The coarsening and evolution of carbides is of great importance in terms of the long term creep resistance of alloys and is controlled by the process of Ostwald ripening. Ostwald ripening involves the growth of large particles at the expense of small particles, which are taken into solution. It is controlled by the transfer of vacancies through the ferrite lattice to the growing particle and by the diffusion of the solute through the matrix. An increase in temperature brings about an increase in the diffusion rate, so that Ostwald ripening occurs more rapidly at high temperatures. According to Nutting [27] it is possible to describe the particle coarsening process by the following rate equation: 3 . 3 _K.VmC j rt ro -Equation 2.1 Where: rt = mean particle size after time t r0= mean particle size at the start of the observations K = constant related to the rate controlling diffusing species Vm= molar volume of the dispersed phase 13
- 27. Coo= solute concentration In the solvent when the particle has an infinite radius of curvature t = time R = gas constant T = temperature in Kelvin For optimum performance low alloy Cr-Mo steels usually enter service in either the normalised and tempered or annealed condition [28], thus the evolution process in terms of carbide ripening is already under way. Such steels are in an active metastable condition and further carbide precipitation, accompanied by changes in composition and coarsening, occurs throughout high temperature exposure. In the normalised condition the microstructure is predominantly bainitic with varying amounts of pro-eutectoid ferrite , dependent upon component section size. The tempering temperature and duration used are selected to optimise the steels properties for a particular application, the knowledge to do so being drawn from works by authors such as Baker and Nutting,1171. Baker and Nutting determined the sequence of carbide precipitation events which occurred upon tempering a normalised 2.25%Cr-1%Mo steel at temperatures ranging from 400°C to 750°C and times up to 1000 hours, as summarised below in Figure 2.2. In bainite - ccarbide M3C + m 3C >■—► M3C — + m 2C :------------------------------------------------- ► M 7 C 3 ^ "► M23C6 “ ► M6C and in ferrite - m 2C m 6c Figure 2.2: Carbide evolution sequence for 2.25%Cr-1%Mo steel, where M indicates a mixture of metal atoms- after Baker and Nutting [17]. 14
- 28. In the annealed condition the microstructural constituents are basically the same as for the normalised and tempered material but due to the slower cooling rate there is now a significant amount of pro-eutectoid ferrite present and some pearlite. The nature of the carbides in low alloy creep resisting steels has been extensively investigated 1171[28] t27] and those most likely to be encountered in 2.25%Cr -1%Mo steel are summarised below in, Table 2.1. Carbide Type Crystal Structure Composition (metal- atom ratios) Description and Location s Carbide Hexagonal Fe rich. Cr /Mn - high solubility Mo - low solubility In the bainite between the ferrite laths. Metastable pre- curser to M3C M3C Orthorhombic structure of cementite, Fe3C Fe rich. Cr - high solubility (0.2) Mn - high solubility Mo - low solubility (0.04) Replaces s carbide on ageing. Predominantly Fe3C. M 7C 3 Pseudo hexagonal structure of Cr?C3 Chromium rich. Fe - high solubility (up to 0.6) Mn - high solubility Mo - low solubility (up to 0.055) Stick like precipitate, bainite side of a/bainite grain boundaries. Nucleates in vicinity of Fe3C. M« C6 FCC structure Cr rich. Fe - high solubility (up to 0.4) Mn - high solubility Mo - high solubility can replace C r. Precipitates in bainite at the expense of Mo2C and Fe3C. Not observed in immediate vicinity of CryC3 therefore considered to be based on Fe and Mo predominantly. M C 2 Hexagonal Mo rich Cr - high solubility (up to at least 0.3) Fe - solubility upto 0.2 Fine matrix precipitate - stable up to long times in a. May also form fringe like precipitates at a side of a/bainite grain boundaries. M C i 6 Complex cubic Ternary carbide of Fe and Mo from Fe4Mo2C -> Fe3Mo3C Cr - solubility up to 0.3 Equilibrium carbide. Forms from M o2C in a and eventually from M C and M„ C in7 3 23 6 bainite. Table 2.1: Nature of carbides in normalised 2.25%Cr-1%Mo steel[17][28][27] The carbides in the bainite structure of 2.25%Cr-1%Mo steel precipitate from a matrix saturated in carbon, chromium and molybdenum on tempering. The M2C in the pro-eutectoid ferrite, however, precipitates directly on cooling from above the A c3by a process known as interphase precipitation1231. 15
- 29. M6C has been shown by many workers [17][29][30] to be the equilibrium carbide in 2.25%Cr -1%Mo steel. More recent studies l31], however, suggested that in silicon containing steels, 0.61% in the alloy studied, M6C precipitates at earlier times than in the steels studied by Baker and Nutting t17] which contained only 0.18% Si, and the equilibrium carbide is M23C6. In the same study, manganese was shown to have a similar effect. Decreasing the carbon content of the alloy has been shown, 1301[32], to accelerate the precipitation sequence described in Figure 2.2. This has commercial implications when Cr-Mo steels are welded to mild steels as carbon migration will affect weld properties,[33]. Detailed studies of the enrichment of carbides in chromium during the ageing of 2.25%Cr-1%Mo steel has been carried out by Thomson and Bhadeshia [24] [34] [351. These studies indicated that small cementite particles become enriched in chromium more quickly than larger ones and that the enrichment rate of cementite in bainite is slower in mixed ferrite / bainite structures than in those which are fully bainitic. MTDATA [36], a computerised databank that allows the computation of chemical equilibrium as a function of composition and conditions, was used in conjunction with energy dispersive X-ray analysis (EDXA) to investigate the chromium levels of M7C3and M23 C6in equilibrium with ferrite. It was concluded that the amount of chromium each carbide can support increases with decreasing tempering temperature. The concentration of chromium in M7C3 tempered at 565°C, however, was found to increase with time at temperature and the mass percent at extended times exceeded that predicted from the equilibrium constant obtained from MTDATA. This anomaly was considered to be due to the fact that some of the molybdenum predicted to be in the M7C3i was actually in another carbide, M2C, which was not accounted for in the analysis. Tempering at 750°C for 48hours allowed the M23C6 and M7C3 to mature and subsequently the equilibrium compositions of these carbides were determined by energy dispersive X-ray analysis, (EDXA), as described in Table 2.2 : 16
- 30. Carbide Type Element Mass % Cr Mn Mo Fe M23C6 31 2 9 58 M7C3 51 2.5 7 39.5 Table 2.2: Equilibrium compositions of M23C6 and M7C3 carbide - after Thomson I241. Data derived from MTDATA was used in conjunction with a model developed by Robson and Bhadeshia [37] to predict precipitation sequences in power plant steels. Figure 2.3 shows the outcome of their prediction for 2.25%Cr-1%Mo steel at600°C. 0.03 0.025 - 0.02 - M,C u- 0.015- 0.005 - 1e-02 1e-01 le+00 1e+01 1e+02 1e+03 Time (hours) Figure 2.3: Predicted evolution of precipitate volume fractions at 600°C in 2.25%Cr-1%Mo steel -after Robson and Bhadeshia 1371. The microstructural changes occurring in 1%Cr-0.5%Mo steel have been investigated by Varin and Haftek [38] and compared with the ageing studies on 2.25%Cr-1%Mo steel by Baker and Nutting [17] and those of Abdel-Latif et a l[39]. Discrepancies between the times for the formation of the equilibrium carbide, M6C, to form in the ferrite were attributed to the lower chromium and molybdenum content of the 1%Cr-0.5%Mo steel. In the study carried out by 17
- 31. Abdel-Latif et al [39] the transformation structure of the annealed 2.25%Cr- 1%Mo steel was undefined but appeared from representative microstructures to consist of a mixture of pro-eutectoid ferrite, pearlite and possibly some bainite. The authors did not attempt to attribute specific carbides to their location in the microstructure but considered only the general trend for a change from predominantly M23C6 type carbides in the structure at relatively short service times to a mixture of M23C6and M6C at greatly extended times. It was noted that the chromium rich carbide, M7C3, was not detected in this study and that the carbide evolutionary process was, hence, described as: M2C —^ M23C6 —^ M6C. In the study by Varin and Haftek [38] M7C3 carbides were detected in the pearlite after 1.22 x 10⁵ hours having precipitated at the expense of Fe3C. In the ferrite grains it was suggested that M2C gave way to M23C6 , which is in contradiction to that described by Baker and Nutting 1171 for precipitation in ferrite where M2C -> M6C. This variation may be due to the difference in the partitioning of elements between the ferrite / pearlite phases in the former study compared to that between the ferrite / bainite phases in the latter or simply due to the difficulty in uniquely identifying the carbides by the techniques used. M6C, the equilibrium carbide was found in this study only at extended times at the ferrite grain boundaries. Most of the studies outlined above have only considered the effect of time and temperature on the carbide evolution process, but in fact it has been shown that the action of an applied creep stress plays a role. Gope et al [15] carried out microstructural studies on gauge and shoulder sections of long term creep tested specimens in normalised and tempered, fully bainitic, 2.25%Cr-1%Mo steel. It was found that the applied stress had the effect of accelerating the dissolution of M2C in the structure, promoting the precipitation of the equilibrium carbide M6C and aiding the recovery and recrystallization of the ferrite matrix. In both the case of the stressed and unstressed regions the M2C particles were observed to grow in length initially with time at temperature and then decrease just prior to the precipitation of M6C. 18
- 32. In reviewing the foregoing work it was clear that many anomalies existed in the precipitation sequences defined for the low alloy Cr-Mo steels and, to summarise, these can be attributed to: i) Variations in the starting microstructures studied; annealed structures of ferrite/ pearlite l381I39], normalised structures of ferrite / bainite 1171or 100% bainite [151[17]. ii) Compositional variations; comparing alloys containing different carbon, chromium and molybdenum mass percents. iii) Uncertainty in the methods used for identifying the precipitate types; X- ray diffraction, energy dispersive X-ray analysis, carbide morphology and electron diffraction. If estimations of component remaining life are to incorporate changing material microstructural maturity it is obvious that the carbide evolution process must be uniquely understood for a particular composition, initial microstructure and phase constitution and that the techniques used for this identification of the carbides involved must be reproducible and consistent. 2.3 Creep Deformation The creep behaviour of metals and alloys are commonly portrayed in terms of the well known ‘creep curve’ exhibiting the classical three stage deformation process l6ll40]. Conventionally the design lifetime of a metallic component has been based upon the secondary creep rate portion of the creep curve, where the deformation rate is governed by the combined action of strain hardening and thermally activated recovery of the dislocation structure [6]. Equation 2.2 describes the generally accepted inverse relationship between secondary creep rate of metals and alloys, ss and their rupture time, tr, l41]. Both parameters vary similarly as a power function of the applied stress 1421 and Arrhenius function of temperature. 19
- 33. L r r r r r rr" exn^~0,RT^cc soc <7exp -Equation 2.2 Where: n = stress exponent (varies with creep mechanism acting) Q = activation energy R = gas constant (8.315J/mol.K) To correlate the vast bank of data for creep tests derived from specific materials under various conditions, several empirical formulae have been derived which describe the dependence of the rupture time on stress and on temperature [41]t43] [44]. One of the most commonly used of these is the Larson - Miller parameter [441, (LMP), which proposes the following relationship between time, stress and temperature: LMP = T (C + log tr) /1000 -Equation 2.3 Where: T = absolute temperature in Kelvin C = constant generally accepted to have a value of 20 tr = time to rupture The practical application of this parameter is to allow long time rupture to be predicted from short term test as described by Dieter[45]. Lifetime predictions based on such relationships and data extrapolated from relatively short term tests can lead to misinterpretation due to microstructural changes which occur with time. Hence, to prevent under-estimation, lifetime predictions are often conservative estimates incorporating generous safety factors to cover deficiencies in knowledge. Detailed knowledge about a particular material and how it’s creep behaviour is affected by changes in composition, stress state, temperature and microstructure provides the basis for more accurate prediction of component lifetime and consequently prevents unnecessary, and expensive, premature removal of components from service. The techniques developed for the estimation of remanent life will be reviewed further in section 2.4. 20
- 34. 2.3.1 Creep Deformation Mechanisms and Maps Creep is known to involve a number of diffusion rate controlled processes. The process of atom movement by diffusion, leading to creep deformation, is in turn governed by the temperature and stress regime in which the material operates and can be conveniently summarised for a specific material, by a deformation mechanism map as first proposed by Frost and Ashby [5]. Figure 2.4 shows a schematic representation of a map for the general case. ; 10 -/1_----------- ideal strength- dislocation glide 10 $ V) $ 0 1c: -3 -C 10 -5 I f f yield stress elastic strain predominates for long times islocation dynamic recrystallisation Nabarro- Herring creep 0 0.5 homologous temperature T/Tn^ Figure 2.4: Typical deformation map - plot of normalised stress against homologous temperature - after Reidel[40]. At low temperatures and high stresses plastic deformation occurs mainly by dislocation glide. At high temperatures, however, above 0.3Tm creep deformation occurs at much lower stresses than those associated with dislocation glide by the processes of either dislocation creep or diffusion creep [5]. As indicated in Figure 2.4 diffusion creep may operate in two ways by either 21
- 35. diffusion of atoms through the bulk of the grain, Nabarro - Herring creep, or by diffusion predominantly along grain boundaries, Coble creep. The stress required to deform a crystalline material plastically is that needed to move dislocations within it’s structure. Dislocation movement is resisted by: i) the intrinsic lattice resistance, (Peierls force), and ii) the obstructing effect of obstacles, for example, dissolved solute atoms, precipitates or other dislocations. Diffusion of atoms can unlock dislocations from obstacles and the diffusion of these unlocked dislocations under an applied stress leads to dislocation creep, also known as power law creep. In this process the glide force, xb, per unit length is balanced by the reaction force, f0, from the precipitate and unless the dislocation intercepts the precipitate in mid-plane there is a force, xbtan0, that attempts to deflect the dislocation out of the slip plane, as illustrated in Figure 2.5. Edge dislocations cannot move out of the slip plane by glide upwards by shearing of atom planes, however, they can climb perpendicular to the slip plane if atoms at the bottom of the extra half plane are able to diffuse away, as shown in Figure 2.6. Thus the dislocations appear to climb until they overcome the obstacle to glide. Climb ; force rb tan 9 Reaction force f0 Glide plane Glide force Precipitate r Figure 2.5: The climb force on a dislocation - after Ashby and Jones [461. Where: x =shear stress and b=Burgers vector. 22
- 36. JLa J . = Figure 2.6: Diffusion of atoms leading to dislocation climb - after Ashby and Jones [461. As indicated in Figure 2.4 the region of dislocation creep can be further divided into sub-zones behaviour dependent on the temperature and stress operating. The approximately horizontal broken line separates the low-stress regime, where grain boundary sliding contributes markedly to the total strain [47] I481149] from the high stress regime, where the grain boundaries behave as if they were rigid. Various mechanisms for grain boundary sliding have been proposed [50][51][52] [53] and summarised by Pickering [6] to involve: i) Sliding along the grain interface, in which there may be ledge type obstacles, with accommodation being provided by diffusion of atoms and vacancies. ii) Sliding in regions adjacent to the boundaries by dislocation climb and glide resulting in the sub-grain formation adjacent to the boundary. iii) Sliding by the motion of grain boundary dislocations and grain boundary migration. In each case, grain boundary sliding may be accommodated by the development of local cavities, the formation of which will be reviewed in section 2.4.2. The vertical dashed line in the low stress regime of dislocation creep in Figure 2.4 separates the zones where low temperature, vacancy diffusion along dislocation lines, known as core diffusion, and illustrated in Figure 2.7, dominates over that where diffusion is mainly through the lattice. 23
- 37. Core diffusion of atoms is important at lower T7TM Figure 2.7: Diffusion along dislocation lines, core diffusion, at low T/Tm - after Ashby and Jones [461. As the externally applied stress decreases the rate of dislocation creep falls quickly but creep does not stop. At high T/Tm ratio, diffusion may occur from one set of grain faces to another and dislocations are not involved. This process is known as the Nabarro-Herring mechanism [54], as shown schematically in Figure 2.8 . Figure 2.8: The process of creep deformation by diffusion at high T/Tm -after Ashby and Jones [46]. a diffusion Bulk crystal diffusion Grain boundary diffusion I L I I 24
- 38. The rate of creep by this process is proportional to the diffusion coefficient, D, and to the stress, a, which provides the driving force for diffusion. Creep rate in this regime varies inversely with (grain-size)2, that is 1/d2. Effectively as the grain size increases the atoms have to diffuse further and thus the rate of creep deformation diminishes. At lower values of T/Tm, bulk diffusion becomes more difficult and the mechanism which predominates is that of Coble creep [4]. In this case, atoms diffuse along grain boundaries rather than through the grains and grain boundary sliding takes place in order that holes do not open up between grains. The accuracy of creep deformation maps derived for specific alloys are, as Ashby [55] points out, “only as good as the constitutive equations used to construct them”, but, they do provide an excellent qualitative basis on which to choose material for a particular application, to predict operative mechanisms and to select appropriate strengthening mechanismsl6]. 2.3.2 Creep Deformation of Chromium-Molybdenum Steels It is generally recognised [20] 1561that all creep resistant alloys depend primarily on finely dispersed particles for their strength and that inter-particle spacing is an important factor controlling the movement of dislocations. In ferrite areas the dominant carbide to form in molybdenum steels is Mo2C, whereas, in chromium steels it is M7C3 and in vanadium steels V4C3. A fine dispersion of these carbides gives rise to secondary hardening peaks during tempering and initially high creep resistance. The reduction in creep strength with time at elevated temperatures is widely considered to be due to microstructural degradation associated with the coarsening of these precipitates and it is this which is responsible for the initiation of tertiary creep in low alloy steels. Consequently it was recognised that there is a relationship between the critical particle spacing and the onset of rapid creep deformation 1571and this has been 25
- 39. extended to creep life prediction from microstructural assessmentt56] [58] [591 [60]. Eventually, with time at temperature the material microstructure matures to it’s equilibrium state, as outlined in section 2.2.2 , and the carbides resulting will be stable. In creep deformation terms this usually occurs towards the end of the component life as the equilibrium structure offers little resistance to the mechanisms of deformation and failure. It has been shown by Abe and Yagi [61] [62] that although the initial microstructural differences between the chromium - molybdenum steels of various compositions imparts significant differences in creep rupture strength over extended periods, corresponding to Larson Miller Parameter >19x103, the properties converge, as illustrated in Figure 2.9. The fundamental creep strength is an inherent property of the Cr-Mo steels at long times and is referred to as “inherent creep strength” [62]. The inherent creep strength is dependent on the chemical composition of the ferrite matrix and not on the initial microstructure as a whole. ro CL CO CO 0i— W 3 Q. d DC Cl <DCD o 1000 700 500 300 200 100 70 50 30 20 • lCrlMoO.25V ▲ 5Cr0.5Mo ▼ 9CrlMo ■ 12Cr ♦ !2CrlMolW0.3V 0.2C steel 0.012C steel % O 0.2C O 0.5Mo A 0.5CrO.5Mo j __________ I________ V lCrO.5Mo □ 1.25CrO.5MoSi O 2.25CrlMo 16 18 20 22 24 Larson-Miller parameter (T,(K) (20+log- tr(h))) (103) Figure 2.9: Creep rupture strength of carbon steels and Cr-Mo steels - after Abe and Yagi[62]. 26
- 40. The optimum combination of transformation and precipitate structure for creep resistance in 2.25%Cr-1%Mo steel has been discussed by many authors1171129] [22]. It is generally accepted that creep strength is conferred by the presence of fine M2 C precipitates in both ferrite and bainite phases, the M2 C causing precipitation hardening due to interactions with moving dislocations. The growth and dissolution of M2 C is much more rapid in bainite than in ferrite and in the former is followed by recovery and recrystallization of the matrix. Consequently, although bainite is beneficial for short term low temperature strength, this advantage is lost after longer term service or service at high temperaturesl29]. In addition to precipitation strengthening, solid solution strengthening also plays an important role in the creep deformation behaviour of 2.25%Cr-1%Mo alloy. Solid solution strengthening involves the inhibition of movement of dislocations decorated by atmospheres of carbon and molybdenum atom clusters[161[64] [651. Kleuh 1161showed that creep curves for 2.25% Cr-1%Mo alloy may differ from the classical three stage curve due to a combination of precipitation and solid solution strengthening mechanisms being operative, Figure 2.10. At intermediate stresses non classical curves, exhibiting 2 steady state stages, were observed. It was considered that the first steady state stage was controlled by interaction solid solution strengthening and that the second steady state stage was controlled by precipitation strengthening . In the low stress regime classical curves were produced and deformation was considered to be being controlled by dislocation movement only. At high stresses, classical curves occurred once more, this time due to the combined effect of deformation controlled by both solid solution and precipitation strengthening. The effect of stress regime on the creep behaviour of 2.25%Cr-1%Mo steel has also been studied by Yamauchi et a lI66], who assessed the relevance of the Larson-Miller Parameter constant, commonly taken to be 20, on creep life prediction times. From extrapolation of long term data from short term tests it 27
- 41. was concluded that in the low stress regime, < 60MPa, the LMP constant should be 15.6 and in the high stress regime, >60MPa, 18.8. It was proposed that the difference in the constant for the two stress regimes was due to the different mechanisms controlling the deformation processes and that in the high stress regime deformation was controlled by Orowan bowing between particles and in the lower stress regime by dislocation climb or grain boundary sliding, Figure 2.11 . Creep deformation mechanisms operating in various stress regimes for 2.25%Cr-1%Mo alloy have also been proposed by Maruyama et al l67]; their study being portrayed in the form of a deformation map, Figure 2.12, in the manner of Frost and Ashby I5]. The range of conditions depicted in Figure 2.12 were considered to reflect those typical of the service conditions for a 2.25%Cr- 1%Mo steel component in operation in a power plant. Maruyama et al [67] suggested that below the athermal yield stress, aA, creep deformation took place by dislocation creep after initial elastic deformation upon loading. In this regime the dislocation creep rate is controlled by lattice diffusion and the main obstacle to dislocation motion is by fine precipitates in the microstructure. Creep by the process of bulk diffusion did not appear to be a contributing mechanism under the conditions used to obtain the test data from which this map was derived. Above aA, it was proposed that athermal plastic deformation (dislocation glide) took place during loading and then creep deformation occurred by the same dislocation creep mechanism as at lower stress level. However, in this high stress regime the main obstacle to dislocation movement changes to dislocation substructure. Dislocation creep controlled by core diffusion, (low temperature power law creep), was not observed in this study. 28
- 42. 2.5 i 0 = 138MPa A = 124MPa n = 103MPa z o < E Ul 1.0 0.5 O 50 200 300 350 400 500 Figure 2.10: Creep curves for various stress regimes at 565°C - after Kleuh [16] nj CL a) CO <1) CO climbing i 0 i . i . 101 102 103 104 10s 106 107 Time to rupture (h) —ri nm^—r rmwn—nrrm^—r~rrrm^—rrmn 2.25Cr-1Mo (MAF) 475C 450C Orowan bowing : 650t - Orowan threshold - stress Figure 2.11: Creep rupture mechanism diagram for 2.25%Cr-1%Mo steel - after Yamauchi et a l[66]. 29
- 43. Tem perature, T / K t reer* TestsCumKilled fc>y Dislocation SobstrucLkiTV* luheiftnT ObbliU-’ lr* JiC' = 10 ld D is lo c a tio n C re e p A Diflusiort Creep 0.35 0.4 0.45 0,5 Homologous Temperature > T / 7 m ra *S r^i CO sc i « v> oV- W5 Figure 2.12: Proposed creep deformation mechanism map of 2.25%Cr- 1%Mo steel - after Maruyama et a ll67]. 2.4 Creep Fracture In the latter stages of the creep process, the so called tertiary stage, the stressed material undergoes a period of rapid deformation followed by failure. With materials exhibiting low rupture ductility, the advent of tertiary creep can be quite abrupt, the acceleration in the creep rate occurring over a very short period of time immediately prior to fracture. Many mechanisms have been postulated to explain tertiary creep behaviour. These have been reviewed by Pickering [6] and also by Ashby and Dyson l68] and are summarised as follows: i) necking leading to an increase in stress by decreasing the load bearing area 30
- 44. ii) the development of grain boundary cracking and cavitation of sufficient intensity to affect the deformation rate, or which can decrease the load bearing area and thus increase the stress iii) microstructural changes such as precipitate particle coarsening, recovery, recrystallization and grain growth iv) environmental changes v) increase in specimen volume due to cracking which makes a contribution to strain. In terms of industrial significance, the creep ductility of a material is deemed to be of paramount importance as it reflects the ability of the material to resist cavitation and cracking during the period of rapid strain. The following section aims to review the most industrially significant mechanisms proposed for creep fracture and, in particular, examines the mechanisms for the process of cavity nucleation and growth. The phenomena of notch sensitivity will also be covered with reference to creep damage mechanisms in the presence of a pre-existing defect. 2.4.1 Creep Fracture Mechanisms Crystalline solids can fracture by one or more of several mechanisms which can be displayed simplistically on a fracture mechanism map I69]I70], analogous to the deformation maps discussed in section 2.2.1. A schematic of such a diagram is shown in Figure 2.13 . The location of the boundaries between the different mechanism fields depends on the material, its heat treatment, the chemical environment and any 31
- 45. additional stress components. Actual fracture mechanisms maps for iron and various steels have been constructed by Fields et a ll71]. In the stress and temperature regimes experienced by Cr-Mo steel components in power plant applications, failure is most likely to occur by the process of intergranular creep fracture, with ductile transgranular failure being of much lesser significance. Transgranular creep fracture occurs by a mechanism not unlike that of normal ductile fracture at low temperature, in that voids nucleate and grow and eventually coalesce to give fracture I6]. Nucleation occurs at non-metallic inclusions or other second phase particles, with the void nucleation mechanism depending on the nature of the particle / matrix interface and its degree of coherency and surface energy. Sulphides, for example, usually decohese whilst carbides may either decohese or crack. As most engineering components fail by transgranular ductile failure at room temperature, extensive literature describing this mechanism is available and has been reviewed by Goods and Brown 1721 and KnottI73]. At lower stresses and elevated temperatures, hole growth by plastic straining or creep flow becomes so slow that fracture by grain boundary cavitation intervenes, the strain to fracture is then relatively low and fracture is intergranularm . 32
- 46. slip-induced cleavage o rB IF Jt instantaneous fracture ductile trans granular, necking or superphsticity ductility dip cleavage or B IF from largest crack ire dyndmic ret -rystaU - ization intergranular creep fracture no fracture cavity nucle Figure 2.13: Fracture map - after Reidel[401. 2.3.2 Creep Cavity Initiation And Growth Many of the steels operating in power plant applications develop creep cavities under their normal conditions of service, eventually leading to failure. There is, therefore, a need to understand the mechanisms by which the cavities form and grow with a view to improving future generations of power plant steels for increased creep resistance. Voids in polycrystalline materials nucleate by either wedge type cracking at grain boundary triple points or by more diffuse cavitation at grain boundaries. The mechanisms of grain boundary cavity nucleation and growth have been reviewed by Pickering [6] and more comprehensively covered by Reidel[40]. Wedge cracks of the type shown in Figure 2.14 occur due to grain boundary sliding, building up stress concentrations at triple points and initiating cracks on boundaries normal to the applied stress axis. These types of cracks are found predominantly in samples tested at high stresses or in coarse grained material where grain boundary segregation of impurities decreases the surface energy. 33
- 47. The more widespread type of cavity formation involves the development of “spherical cap” or lenticular voids, mainly on grain boundaries which have a high grain boundary sliding component. The main mechanisms which have been proposed to explain their formation are illustrated in Figure 2.15. Figure 2.14: Wedge cracking at grain boundary triple point due to sliding - after Lagnebourg UA]. sliding ledge subboundary ■0 particle fracture particle decoherence ^ sliding Figure 2.15: Various mechanisms for grain boundary cavity nucleation due to grain boundary sliding - after Evans and Wilshire [50]. 34
- 48. In commercial alloys the most common sites for cavity nucleation are second phase grain boundary particles. Numerous investigations have shown that in low alloy steels, cavities are often associated with carbide particles 1751 I76]. Although such particles at the boundaries in creep resisting steels are initially beneficial, that is they transmit the shear stresses which the grain boundaries would otherwise not be able to support, eventually stress concentrations may build up at the particle / matrix interface leading to cavity initiation. Once initiated the cavities grow and coalesce forming microcracks, which subsequently , upon reaching a critical size, lead to failure of the remaining ligament. The role of particles in creating stress concentrations on sliding grain boundaries has been analysed by Reidel1401and reviewed by Perry [7?1. Sliding of grain boundaries, is believed to occur in bursts, causing stress concentrations to be set up at irregularities in the boundaries. These local stresses cause boundary separation to occur and cavities initiate if the process of atom / vacancy diffusion is insufficient to prevent it. Two general mechanisms for the nucleation of cavities have been cited l77]: i) Steps or ledges in grain boundaries have been supposed to result from the intersection of slip bands with grain boundaries. ii) Local break down of adhesion associated with precipitates or impurities. In both cases local plastic strain is a pre-requisite. Evidence for both the mechanisms proposed has been observed during metallographic examination of creep tested material and it is believed that one or other may dominate at any particular instance. Figure 2.16 summarises Reidel’s1401analysis of the stress concentrations which occur in the steady state after elastic stress concentrations have been relaxed; apis the average stress focused on a particle by grain boundary sliding or by inhibited Coble creep and p and Xp are the particle diameter and spacing respectively. 35
- 49. 4* .a* o o> b8 7 particle - inhibited diffusion n LJ _ free / diffusion I V / Coble creep I r pow er-law creep ( log scale) — ► Figure 2.16: Stress concentration factor, Oplcs« at particles versus applied stress - after Reidelt40]. Cavity nucleation has been shown to occur over a substantial fraction of creep life and as such may be used in some materials to estimate remaining life [78]. Once voids have been nucleated , they will continue to grow as creep deformation proceeds. It has been demonstrated that whilst clearly continued grain boundary sliding can result in the progressive growth of both wedge and the rounded type of cavities, another more important growth mechanism is that due to vacancy diffusion to the cavities t79] [80]. Whereas grain boundary sliding would tend to give cavities which are elongated along the boundaries, growth by vacancy diffusion gives the more rounded cavities frequently observed. Additionally, vacancy diffusion would be expected to give more pronounced cavities on boundaries normal to the stress axis, whereas with grain boundary sliding they would be more apparent on boundaries at 45° to the stress axis. In a study by Tipler et a l[81] on void formation in chromium - molybdenum steels, it was reported that although the lines of cavities were frequently normal to the applied stress, few of the voids were so oriented. This suggests that the dominant mechanism for void nucleation may differ from that for void growth. 36
- 50. Another factor involved in the growth mechanism of voids was discovered by Taplin 1821who noted that in fine grained materials sliding of grain boundaries tended to encourage void growth on those boundaries which were oriented in the region of 45° to the applied stress, whilst in coarse grained material, voids elongated on boundaries normal to the applied stress. Again there is strong evidence to support cavity growth by both sliding and diffusional mechanisms and it has been suggested 1771 that the dominant mechanism may change within a single test. Under the stress and temperature regimes associated with most power plant applications Hull and Rimmer 1831suggested that the cavity growth mechanism is most likely to be stress-directed diffusion of atoms away from cavities into grain boundaries where they can be deposited. Figure 2.17 attempts to illustrate the mechanism proposed. t t° iD i t h -------------------------------- 2b ------------------------------ H void ^2a grain boundary Figure 2.17: Model for grain boundary cavitation by surface and grain boundary diffusion - after Hull and Rimmer m. Adjoining grains are assumed to act as rigid bodies. Dyson18411851pointed out that the initial models proposed for this mechanism did not take into account that the material surrounding the grain boundary facet may impose a restriction on cavity growth rates. If the material surrounding a cavitating facet was rigid, the excess volume of cavities could not be accommodated and cavity growth would come to a stand still. Thus, the rate of cavity growth may be controlled by the deformation rate of the surrounding material leading to the phenomena known as constrained cavity growth. 37
- 51. Hancock t86] has proposed an alternative growth mechanism which occurs in situations where stresses are high and plastic dislocation creep is sufficiently rapid that, in the limiting case, the transport of matter along the grain boundary can be neglected. This is illustrated below in Figure 2.18. Co-operative diffusion of atoms and vacancies in the vicinity of the void wall tend to make the void increase in volume and decrease in radius. If surface diffusion is rapid, local matter transport along the void surface always serves to retain the quasi equilibrium spherical cap shape so that in this case the net effect is to increase void radius. e f f e c t of c re e p fl ow to s ur fa c e d if f u s i o n gra in bound ary i n it ia l void p r o f i l e Figure 2.18: Schematic illustration of cavity growth by the combination of plastic creep flow and rapid surface diffusion - after Hancock [86]. If both the above processes of creep flow and grain boundary diffusion are operative at the same time , as discussed in detail by Needleman and Rice [87], active cavity growth rates can be many times greater than would be the case if either mechanism acted in isolation and the path length over which matter must diffuse is effectively shorter. In turn this means that less stress is required for growth to occur. Conversely, for a given stress level, the growth rate will be more rapid when local stress accommodation of the diffused matter is possible by creep [87]. Figure 2.19 shows rupture life-times of 2.25%Cr-1%Mo steel, as measured by Cane [88], compared to estimated rupture lifetimes based on models proposed for constrained and unconstrained cavity growth involving either instantaneous or continuous nucleation derived from Reidel[40]. The study showed that the 38
- 52. constrained model with continuous nucleation gave the most accurate prediction for time to failure for 2.25%Cr-1%Mo steel. constrained 10000 continuous nucleation 1000 unconstrained instantaneous nuc(eation-100 2k Cr-IMo steel 565°C 50 100 150 200 0 in MPa Figure 2.19: Comparison of creep curves from uniaxial creep data for 2.25%Cr-1%Mo steel compared with predictions for constrained and unconstrained cavity nucleation -after Reidel[40]. As the mechanisms of creep deformation and failure are affected by both the transformation products and precipitate structure of steels it is essential when discussing creep deformation that the condition of the material is accurately described. An example of this effect was apparent in a study by Cane [89] on the effect of transformation structure on creep rupture behaviour of 2.25%Cr- 1%Mo steel . In this study an increase in the ferrite / bainite ratio in tempered coarse grained 2.25%Cr-1%Mo alloy was found to modify the rupture properties by improving ductility, increasing rupture life up to intermediate ferrite contents and causing a subsequent decrease thereafter. Additionally the final fracture mode was observed to change from brittle intergranular to ductile transgranular failure. These effects were considered to be due largely to a 39
- 53. reduction in susceptibility to cavitation damage caused by the progressive elimination of prior austenite grain boundaries with increase in ferrite content. Minimum creep rate, s , was shown to be relatively independent of transformation structure at intermediate and high bainite contents but increased markedly at low bainite contents. At high bainite contents, cavitation damage was considered to have made a significant contribution to the overall creep rate, while at intermediate bainite contents, the respective age hardening and softening in the ferritic and bainitic constituents lead to a corresponding structural insensitivity to creep rate. At low bainite contents, however, coarse precipitation occurring during transformation resulted in a consequent loss in super-saturation and, therefore, any ferrite strengthening potential. In summary, fracture of power plant steels operating at temperatures of 0.3-0.4 times the melting temperature under creep conditions is governed predominantly by intergranular cracking. The underlying physical mechanisms are nucleation and subsequent growth of microscopic cavities on the boundaries of the grains. When sufficient cavities have reached a critical size, they will coalesce to form a microcrack along a grain boundary. Subsequent linking-up of microcracks leads to the growth of macroscopic cracks and eventually failure of the component remaining ligament. Cavity growth occurs mostly by grain boundary and surface diffusion, other important mechanisms being creep of the grain material and grain boundary sliding. All of these have different time scales and different dependencies on stress state, and it is the competition between them that controls damage evolution and the final lifetime of the componentm . 40
- 54. 2.4.3 Creep in the Presence of a Pre-Existing Defect Prior to the 1970’s, the majority of work carried out to estimate the design life of a component in a creep environment was determined from data extrapolated from uniaxial creep tests. It soon became apparent, however, after the occurrence of a few premature failures in electricity power plants, that uniaxial data did not give an accurate estimation of design life if the component contained a pre-existing defect. Consequently many researchers have since carried out investigations relating to this phenomena I14]. The most recent studies include not only a means of estimating and appreciating failure due to crack growth, but also consider the period of initiation, or incubation, prior to crack extension 1911111and these will be reviewed in more detail in section 2.5.2. To accurately predict the safe operating life of a component, which may include a period of damage tolerance, many factors have to be taken into consideration and these can be broadly categorised into two areas: i) The continuum-mechanics deformation fields around the crack tip, characterized in terms of stress intensity factor, K|,I91], the J-contour integralI92], and creep fracture mechanics parameter, C* 1931195]. iii) The micro-mechanisms occurring at the crack tip, such as stress relaxation, microstructural evolution and cavity formation. The aim of this section is to review the studies which have been carried out on creep crack initiation and growth from pre-existing defects with a view to understanding how the state of stress at the defect tip affects the microstructure and, hence, the creep crack initiation and growth mechanisms in this region. When a body is loaded under creep conditions in the presence of a pre existing defect, there may be a period of time before that defect begins to grow, the so-called initiation time. During this period a creep process zone develops at the defect tip, the size and rate of development of which is governed predominantly by the elastic-plastic characteristics of the material m . The 41
- 55. damage zone that develops, undergoes microstructural changes due to the influence of the operative creep mechanisms, as described in section 2.3.1, and the effect of the triaxial state of stress at the defect tip. Hence, creep brittleness rather than creep strength of a service component is often the vital factor in failure by creep or thermal fatiguet95] under such conditions. Relaxation of stress by heat treatment, due to atom / vacancy diffusion, represents displacement - controlled situations where stress can decrease as local creep strain accumulates. The probability of crack initiation and growth depends on the magnitude of the displacement relative to the properties of the local microstructure. Ductile crack growth occurs with a large displacement and is accompanied by widespread microstructural damage, whereas brittle cracking is accompanied by small displacements and little damage visible away from the main crack. It therefore follows that, the greater the notch opening / creep crack length ratio the more ductile the situation I96]. The factors affecting the mode of crack growth and failure has been described schematically by Gooch and King I95], as shown in Figure 2.20. increasing brittleness tn te. < <ioo S5Zj K <^ tii STRAIN DISTRIBUTION linear elastic fracture mechanics GEOMETRICAL CONSTRAINTS multiple* -CRACKS■ •single ENGINEERING FACTORS Figure 2.20: The factors that affect ductile-brittle creep behaviour - after Gooch and King p51. 42
- 56. The three regions of this diagram can be described as follows: i) The top right hand corner of the diagram portrays the creep brittle situation, where crack growth rates are commonly described by the use of linear elastic fracture mechanics (LEFM)1971in the form : — = AKn -Equation 2.4 dt Where, K = the linear elastic stress intensity factor a = crack length, t = time and A and n = constants The LEFM approach assumes that stress relaxation is slow in relation to crack growth rate and, hence, the stress and the displacement distribution are represented by K to a reasonable degree of accuracy. ii) The bottom left hand corner of the diagram represents the case where reference stress, <j^, can be used to assess the lifetime of a component by comparison with uniaxial creep rupture tests l98]. This approach assumes that stress relaxation by creep at the crack tip is rapid compared with crack growth in the same region and, hence, there is negligible stress concentration remaining ahead of the crack. iii) The intermediate region, represents all other cases where crack growth rates need to be calculated from time dependent fracture mechanics methods using C*, J or COD (crack opening displacement) parameters. These methods, the so called post- yield fracture mechanics methods 1951 involve complex calculations to account for microstructural changes taking place with time. The geometrical factors which affect the situation at the notch tip of the pre existing defect have been defined by Haigh l99] by the equation: 43
- 57. K nom (J ref ■sJW = mY -Equation 2.5 Where: Knom = nominal value of stress intensity o>ef = reference stress (equivalent stress level in a uniaxial test which causes failure in the same time) = specimen widthW m - general yield ratio = load to yield a cracked specimen [100] Y = compliance function = and B = specimen thickness P'= applied load load to yield an uncrackedspecimen, KBW112 P' Typical values of _JLnom j shown for common specimen geometry’s and ref y/W~ plotted as a function of a/w (crack length / specimen width ) in Figure 2.21, indicate that compact tension (CT) specimens exhibit the most brittle situation at the notch tip. compact single edge notched Vw tension bend double edge notched0-6 centre-cracked plateOX tu 0-2 0 02 03 FRACTION OF CRACKED AREA. a/W 01 OX 0705 06 Figure 2.21: The effect of specimen geometry on brittleness in plane strain -after Gooch and King p51. 44
- 58. Materials operating in power plant predominantly fall into the intermediate regime of Figure 2.20, where the ductile microstructure allows the initially high crack tip stress to relax at the same time as the integrity of the structure is reduced. Haigh [7] has shown that in the situation where constraint is high, such as in the case of CT specimens, and the material is ductile then the C* characterising parameter is valid and the reference stress can be re-written as shown in equation 2.6 for the plane stress situation: For the plane strain situation the equation is adapted to give equation 2.7: Where: Bn= net specimen thickness Mp,e= -(1+1.702a/w) + (2.702+4.599(a/w)2)1/2 [19] Whether plane stress or plane strain conditions are operative at the crack tip will depend upon the degree of constraint; this constraint, in turn, will be dependent upon the test piece dimensions, notch geometry and creep deformation which accompanies fracture. The effect of specimen geometry on defect tip constraint has been studied by many authors and some of the factors observed are outlined below. i) Constraint increases with increased specimen thickness [94] ii) Constraint increases with the presence of side grooves [1011 iii) Constraint increases as depth of side grooves increase [101] iv)Constraint varies with specimen geometry and is greatest for CT v) Constraint varies with notch geometry and is higher for sharp notches than blunt notches [U]. r P ' K m .B .W j -Equation 2.6 -Equation 2.7 specimens [102] [103] 45
- 59. In general, the greater the degree of constraint at the notch tip the more creep brittle the situation. The microstructure can also have a powerful effect on creep brittleness / constraint as demonstrated by Gooch and King [95] who showed that an increase in the prior austenite grain-size of bainite increased the tendency to brittleness of a Cr-Mo-V steel as did an increase in the bainite content of a mixed ferrite / bainite structure. The effect of triaxiality, defined as the ratio of the average of the radial, axial and tangential stresses to the Von Mises stress [104], on the deformation process of coupled creep and grain boundary diffusion was shown in a study by Sham and Needleman [105]. They reported that an increase in triaxiality from 0.33 - 4.0 resulted in an increase in the flow of matter from the cavity to the grain boundary but did not significantly alter the effective diffusion path lengths. This hypothesis was later discussed and developed by Van Der Giessen et al [106] who found that for higher triaxialities, >4.0, and in the presence of large voids, the diffusion path essentially vanishes since dislocation creep completely dominates. In a complex study by Maille [107] on the effect of multiaxiality on the creep deformation of 1%Cr-1%Mo steel, it was found that increasing the multiaxiality quotient resulted in a decrease in rupture strain and an increase in the severity of creep damage. A recent study conducted by Freres and El-Magd [104] showed the influence of a multi-axial stress state on the behaviour of inter-crystalline creep microcracks. Tests carried out on circumferentially notched creep specimens showed that deep, sharp notches enhanced multiaxiality and stresses in the tangential and radial directions, leading to notch constraint and reduced cavitation density. Shallow, sharp notches enhanced the stress in the axial direction. A similar effect was noted by Molinie 11081 who not only showed that cavity density decreased with increased triaxiality but also that the maximum damage occurred in the location of the principal stress axis. 46
- 60. 2.5 Creep Failure Prediction and Remanent Life Assessment The purpose of obtaining creep rupture data is to assess a particular material for service at elevated temperatures. The design code for components is usually based upon uniaxial creep rupture data and defines a maximum allowable stress which can exist in the structure for the required life at the operating temperature. Design codes give a conservative estimate of useful life and the actual life may not be expended in service, therefore, it is economically advantageous to be able to assess components in service and, where possible, extend their life. In service component assessment also avoids costly plant shutdown time due to unexpected failures. A review of life assessment methods by Cane and Williams 1881details two main approaches to this problem. The first method is based upon data taken during the operation of plant, for example temperature and pressure measurements and the second method is based upon periodic examination during plant shut down, for example by crack detection, microstructural examination and strain analysis. For the purpose of the review, damage was considered to have occurred if the material life had been reduced by service. Damage characterisation was by assessment of the presence, size and distribution of cavities or second phase particles, the local softening of the material caused by exposure, or any other effect which reduced life under subsequent creep loading. Additionally, life assessment techniques must be able to account for the situation where components are put into service containing pre-existing defects, such as in large castings, and in the main this is addressed by fracture mechanics concepts. 2.5.1 Creep Life Assessment of Initially ‘Defect Free’ Structures Traditionally most creep rupture data for design purposes is obtained from uniaxial stress rupture tests which are carried out at higher stresses or 47
- 61. temperatures than those used in service. Long term rupture behaviour is then predicted by extrapolation of the short term data of test stress against a time temperature parameter, as described previously in section 2.3 . Parametric equations have also been used in conjunction with life fraction rules in attempts to predict the creep behaviour of materials under variable stresses and temperatures I88]. The original life fraction rule put forward in 1952 by Robinson 11091 suggested that for any series of stress and temperature conditions the life fractions could be linearly summed with failure occurring at unity. V = —2—= 1 x f -Equation 2.81881 V Where tx = time at stress crxand temperature Tx txf = failure time at Ctx, Tx This model assumed that material behaviour was independent of history, which was soon shown to be incorrect11101 when smaller specimens machined from a failed uniaxial creep specimen were found to have a reduced life on re-testing. Many variations of the rules have since been refined to account for the effects of material variability, multiaxial stresses and environmental effects and these have been rationalised by Grounes I111]. The most successful improvement to the life fraction time rules incorporates strain fractionsI1121: y — Sx — 1 * P -Equation 2.91881 b x f Where sx= strain at stress crxand time tx Sxf= failure strain at stress axand t* 48
- 62. These methods are used in conjunction with creep models which simulate time dependent strain accumulation of materials under load at temperature and models have been developed to characterise the growth of creep cavities, wedge cracks and the formation of macroscopic cracks to ultimate failure. Such strain based methods require disciplined monitoring and ensuring that the measurements taken are representative of the component as a whole is difficult. Microstructural examination can provide useful supporting information and studies have been carried out to correlate creep strain with quantitative microstructural damage. Creep strain data generated under accelerated test conditions can provide residual life estimates if a model can be developed relating creep strain, s, or strain rate, s, to creep life, tr. To determine remaining lifetime by microstructural examination predictive models are required that relate the relevant damage feature to the life fraction. The important mechanisms of microstructural damage that must be considered for such a model, and their relationship to strain rate, have been reviewed and defined quantitatively by Dyson and McLean I113]. The so-called, physically based ‘continuum damage mechanics’ (CDM’s) equations, as defined in Table 2.3, are all related to strain rate as a function of applied stress, a, temperature, T, hardening parameter, H and a damage parameter, D. The use of advanced computer systems allows the various contributions to creep deformation, in the form of CDM parameters, to be assessed both individually and concurrently resulting in a very powerful tool for life assessment. Of particular relevance to the current study is the use of data based on the microstructural aspects of cavity nucleation and growth together with the carbide evolution process. Several methods have been used to quantify creep damage by the process of cavitation. These methods include the use of parameters, such as A1, A2 and A* l1141, that quantify the number of cavitating grain boundaries on, or in the vicinity of, a reference line, and those due to observations based on a visual classification scheme, such as that derived by Neubauer and W edell115]. In a 49
- 63. study by Sandstrom [116] the creep damage classes of Neubauer and Wedel were related to a measure of physical damage in order to allow a direct estimation of remaining life and a suggested time scale for the next plant inspection. The observation of the changing microstructure in power plant steels has often been proposed as a useful mechanism for estimating the remaining life of a component [117] [1181 [119] l120]. In particular the composition of the evolving carbides has been used to predict the onset of failure by tertiary creep. An example of such a study is that of Sugita [120] who found that in the heat affected zone of a 2.25%Cr-1%Mo steel sample, creep voids formed when the equilibrium carbide M6C was present in volume fractions >60%. Pioneering work by Bhadeshia et al [34] 1371 [121] [122] has shown that the microstructural evolution process in power plant steels can be predicted using a computer programme called MTDATA[36], as mentioned previously in section 2.2.2, from a knowledge of chemical composition and relevant transformation kinetic equations. Knowing the time to reach a particular microstructural maturity, allows components to be assessed by periodic microstructural assessment for suitability for extended service. For example an accurate means of determining data by the predictions of Bhadeshia et al could negate the need for long term creep rupture testing as used in the studies on Cr-Mo steels by Dobrzanski and Hernas [103]. In this latter study the influence of phase constitution and damage process was linked to residual life time, as described in Figure 2.22 and Table 2.4. 50
- 64. CREEP DAM AGE CATEGORY DAM AGE M ECHANISM DAM AGE PARAMETER D DAM AGE RATE D STRAIN RATE Strain-Induced Cavity Nucleation Control; Growth Constrained D = n d lN kK ti>= € = ^sinh [ p ( l - H ) 1 L(T0(l- 0>)J Cavity Growth Controlled by Crcep- Constraint til TTd N ’c - l Dynamic Subgrain Coarsening D. = 1- Multiplication of Mobile Dislocations Pi Dj=l'T [tr (1 - H) ; «r_(l —u) £>« = 2izr A, =a~A,)- t>d=c(i - Ddyi e-0 [<r (1 - H ) L= —~sini _ ( t - D d) 1 ac Thermallv- Inducca Particle- Coarsening Environmentally -Induced Depletion of sohd-solution elements D = 1 - r«(i- m irc( l - Dp) D = K P (1-D,) a ( l - H ) sinA (i-PA) Fracture of Surface Corrosion Product 1 K i =%Mat! g(l ~H)| Internal SiUSii Oxidation r:(fp~ '?lp ^ 2x D~=T D = mr € == €j.sinh <r(l - H ) loin - d j Table 2.3: Creep damage categories, mechanisms and incorporation into continuum damage mechanics equations - after Dyson and McLean [1131. a. 5 main phase + class of damage isolated pores 000 prolonged time service W , h T=510°C class of damage ■B" oriented pores 5000 Figure 2.22: Influence of phase constitution and damage process on safe residual lifetime of 1Cr-0.5Mo steel - after Dobrzanski and Hernas [1031. 51
- 65. Exhausted creep life fraction t/tr 0.1 0.2 0.3 0.4 0.5 0.6 0.7 0.8 0.9 1.0 Table 2.4: Classification of damage process and exhausted creep life - after Dobrzanski and Hernas [1031. 2.5.2 Creep Life Assessment Of Structures Containing Pre-existing Defects If a component has been put into service containing a pre-existing defect, as described in section 2.4.3, then it is likely that failure will occur before that anticipated by the routine examination of microstructure or even strain. To ensure safe operation, therefore, it is necessary to detect any pre-existing defects and assess the likelihood of them growing to an unacceptable size. Effective procedures for defect assessment and remanent life prediction of power plant components have been developed in recent years [10] [18] [94] 11233 based on fracture mechanics concepts and an understanding of material creep ductility. It has been recognised that when a component containing a defect is loaded in creep, there will be a period of stress redistribution at the defect tip prior to crack growth and that this process could occupy a considerable period of the component lifetime, that is, there will be a period of crack incubation [124]' [126]. The life of a structure operating under creep conditions, therefore, may be regarded as comprising two components 1113 as reflected in equation 2.10: 52 The main class of microstructure Precipitation processes Processes of damage Pearlite/Bainite decomposition
- 66. -Equation 2.10 Where: tj = time to initiate a crack tg= time to growthe crack to failure Immediately after loading, in the absence of plastic deformation, the stress distribution ahead of the crack tip will be defined by the elastic stress intensity factor, K. With time creep will cause stress redistribution until a steady state condition is reached which can be described by the fracture mechanics parameter, C*. The creep strain rate, s , and rupture life, tr, properties of a material can be expressed in terms of stress, cras : Where i 0 = strain rate in uniaxial creep sf = uniaxial creep failure strain at a stress of a n = creep exponent v = Poisson’s ratio The time taken for this stress distribution to be complete, tTi is given byI40]: ( na -Equation 2.11 and 4 very -Equation 2.12 G -Equation 2.13 t r ~ (n + )C Where G = the elastic strain energy release rate. C* = steady state crack tip parameter. 53
- 67. According to Webster et ai no], this time is usually a small fraction of the component lifetime and it is found that creep crack growth rate, a , can be correlated satisfactorily in terms of C* by the relationship: a = D qC ** -Equation 2.14 Where, D0 and <f> are material constants which can be determined by equations 2.15 and 2.16 respectively: and D0 = n + 1 72+ 1 - v j n+l n+-v v n+l c -Equation 2.15 / 0 V n 0 ° 0 / 72 + 1 -Equation 2.16 Several broadly compatible models relating creep crack growth to C* have been postulated m 11271112811129]. When C* has been shown to predict the stress situation ahead of a crack tip the following general equation can be used to relate crack growth rate to C* : a ocC -Equation 2.17 Where a = crack growth rate (j)= fraction close to unity Nikbin et al 1941 derived an equation of this form for a ductile 2.25%Cr-1%Mo steel CT specimen at 538°C as follows: 3 a ~ ~ l -Equation 2.18 54
- 68. Where 8*f = creep ductility at the crack tip as a fraction (for plane stress e*f= etoand for plane strain s*f= em/50 where stois the uniaxial creep ductility). A subsequent study by Wang and Wu [101] based on the a-C* relationship of Nikbin et al, showed that the relationship is temperature dependent for 2.25%Cr-1%Mo steel as indicated below: ^ £*0.85 a ~ at 550°C -Equation 2.19 and 4.93C*085 a - at 565°C -Equation 2.20 In this study the Kubo [130] form of the C* equation was used for CT specimens where: and n= creep exponent P ' = applied load A= load point displacement In a review of aspects relating to the initiation and early growth of creep cracks from pre-existing defects by Holdsworth [11] it was pointed out that equation 2.10 depends to a large extent on the increment of crack extension, Aai, adopted as the definition of crack initiation (xc). For example, as shown in Figure 2.23, it was shown that the time to generate the critical displacement necessary to initiate a micro-crack, for example x^m], was significantly less than the time to develop a macro crack, for example Xcpmmj- The advantages and disadvantages of the crack initiation criteria adopted were discussed and overall it was considered that a macro-crack criterion of >0.5mm, had the most benefits. 55 * 2n P ' A 4.’ 0 0 4 C = t r -Equation 2.21 n +1 B { W - a )
- 69. If the minimum crack extension that can be resolved is Aa then the incubation period, ti, is given by[126]: Where tj = incubation period r' - radius of damage zone ai = crack growth rate An upper bound tj can be obtained by replacing ai in this equation with a0 and a lower bound by replacing it with the steady state crack growth rate 1101giving: Alternatively, when the approximate growth relation is used, equation 2.23, it becomes: The critical crack tip opening displacement, Six, is an important parameter for characterising the creep crack initiation resistance of a material. Conventionally, in the laboratory tests of CT specimens, it is only the crack opening displacement at the load line which is measured 11311and this does not always convey accurately the situation at the notch tip. An alternative method has been proposed by Holdsworth and Cunnane 1191that accurately assesses the actual notch tip displacement and is based on the displacement measurement of hardness indentations placed either side of the notch and pre crack in the CT specimen as shown in Figure 2.24. - Equation 2.22 Aa ^iL D C** " ^ ua*,on ^-23 o Equation 2.24 56
- 70. As reported by Holdsworth [132], deformation and crack development are strongly influenced by the creep ductility in the alloy. Crack initiation occurs in creep brittle materials on the attainment of a relatively low crack tip opening displacement, 5jX, , Figure 2.25a, whereas in creep ductile materials relatively large 5ixvalues, Figure 2.25b, are required to initiate cracking with the onset of cracking occurring later in life. Based on the above knowledge and relationships developed for crack initiation and growth, defect assessment procedures have now been developed [10] [18] and are in use to monitor in service operation of power plant components. Time c o cnc a> x a> -X o o a [I mm] Time Figure 2.23: Variation of crack opening displacement and crack length in a fracture mechanics specimen indicating the importance of specifying crack initiation criteria - after Holdsworth [11]. 57
- 71. 0.6 | 0 .5 I— Z UJ § 0.4 O 5CL W 5 0.3 (3Z z LUEo o < cco 0.2 HINGE POINT CRACK TIP0.1 (W-D’) 1 5 20100 5 2 5 DISTANCE FROMLOAD LINE, mm Figure 2.24: Derivation of 8ix using hardness indentations - after Holdsworth [132] (a) LOW CREEP DUCTILITY (b) HIGH CREEP DUCTILITY l I l LPD LPD,y I / / Aa Aa TIMETIME Figure 2.25 a & b: Influence of creep ductility on crack opening displacement and growth behaviour in a fracture mechanics test piece subject to steady load at high temperature, a) brittle 0.5%Cr-0.5%Mo- 0.25%V HAZ, b) ductile 2.25%Cr-1%Mo weld metal - after Holdsworth [132]. 58
- 72. 2.5.3 Microstructural Investigation Techniques For Creep Life Prediction Methods To ensure accuracy of information from quantitative microstructural analysis for remanent life assessment it is essential that the techniques used are standardised and reproducible. In particular this relates to methods based on damage parameters such as quantification of creep cavitation and microstructural maturity. Cavitation damage may be assessed from laboratory and in service components by three main techniques: i) Direct replication 11331 ii) Extraction replication 11341 iii) Bulk sample examination For each of the techniques the quality of preparation of the material surface is of paramount importance to ensure faithful results. In a study by Silveira and May l1351, based on the Neubauer and Wedel 11151 cavitation classification scheme, the sensitivity of the final classification to sample surface preparation was analysed. Prolonged polishing or repeated polish - etch cycles were shown to exaggerate the degree of creep cavitation by the pull out of matrix or precipitates at damage centres along grain boundaries. It was concluded that the extent of creep damage and hence the prediction of remaining life should not be based purely upon the quantitative measurements of cavities and micro cracks observed but also on an appreciation of the distribution of the damage centres disclosed. A surface preparation procedure using a minimum of three final stage polish - etch cycles was proposed to define, unequivocally, the presence or absence of creep damage. In a related study by Samuels et a l[136] extended etching was found to widen cavities that had opened up at grain boundaries perpendicular to the applied stress in uniaxial creep specimens. It was noted, however, that etching did not in itself generate any new cavities. 59