Downloaded 261 times

1. The document compares the performance of IOCP and EPOLL for network I/O handling on Windows and Linux servers. 2. Testing showed that throughput was similar between IOCP and EPOLL, but IOCP had lower overall CPU usage without RSS/multi-queue enabled. 3. With RSS/multi-queue enabled on the NIC, CPU usage was nearly identical between IOCP and EPOLL.


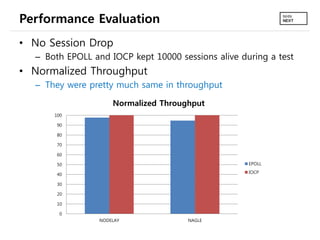
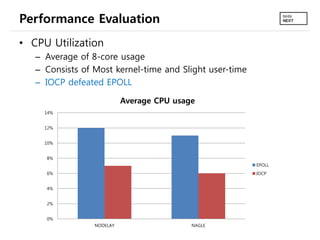
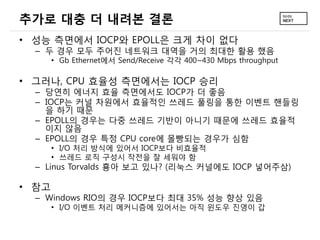
![[야생의 땅: 듀랑고] 서버 아키텍처 - SPOF 없는 분산 MMORPG 서버](https://cdn.slidesharecdn.com/ss_thumbnails/public-140529222503-phpapp01-thumbnail.jpg?width=640&height=640&fit=bounds)


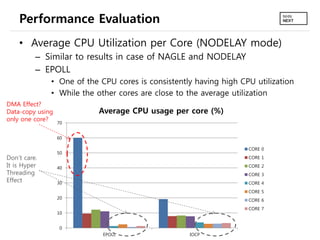
![[NDC2016] TERA 서버의 Modern C++ 활용기](https://cdn.slidesharecdn.com/ss_thumbnails/v09teramodernc20160425-160427044156-thumbnail.jpg?width=640&height=640&fit=bounds)

![오딘: 발할라 라이징 MMORPG의 성능 최적화 사례 공유 [카카오게임즈 - 레벨 300] - 발표자: 김문권, 팀장, 라이온하트 스튜디오...](https://cdn.slidesharecdn.com/ss_thumbnails/t3s1-221108101729-c6b32f4f-thumbnail.jpg?width=640&height=640&fit=bounds)
![[야생의 땅: 듀랑고] 서버 아키텍처 Vol. 2 (자막)](https://cdn.slidesharecdn.com/ss_thumbnails/vol2-160427160825-thumbnail.jpg?width=640&height=640&fit=bounds)


![[NDC2017 : 박준철] Python 게임 서버 안녕하십니까 - 몬스터 슈퍼리그 게임 서버](https://cdn.slidesharecdn.com/ss_thumbnails/ndc17python-0425v08-170426123108-thumbnail.jpg?width=640&height=640&fit=bounds)