Download to read offline
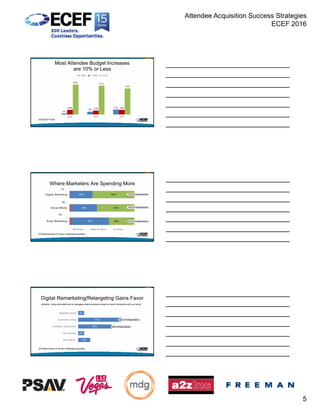
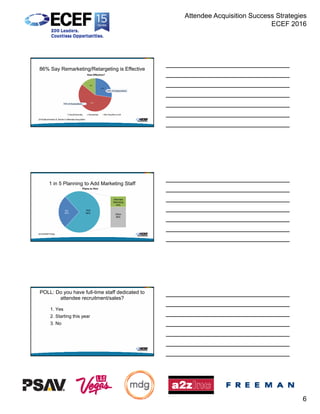
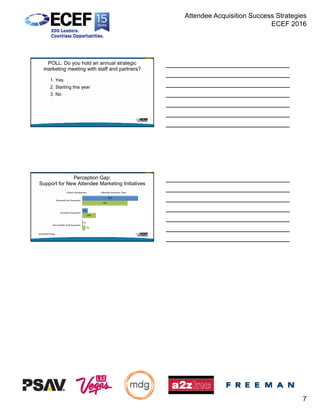


The document outlines strategies for attendee acquisition presented by Sam Lippman at ECEF 2016, highlighting the primary challenges in growing attendance and the spending priorities of event organizers. Key findings include the trend of decreasing attendance despite marketing efforts, the effectiveness of digital remarketing, and the implementation of new programs to incentivize exhibitors. The document also discusses industry benchmarks and the support of senior management for new marketing initiatives.


![13.04.24 ExecSummary_final[3]](https://cdn.slidesharecdn.com/ss_thumbnails/a95c5dca-cfdf-4160-9d74-a6215c779079-150522215022-lva1-app6891-thumbnail.jpg?width=640&height=640&fit=bounds)


![[EN].CleverGroup Vietnam Profile 20251202](https://cdn.slidesharecdn.com/ss_thumbnails/en-260120091417-fe6f88ec-thumbnail.jpg?width=640&height=640&fit=bounds)


