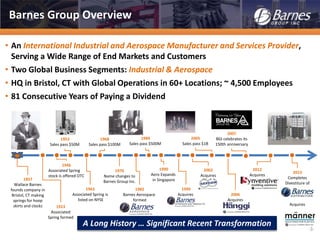
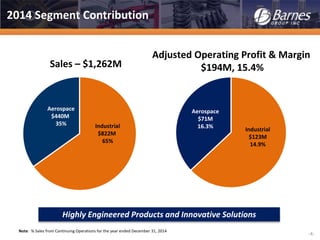
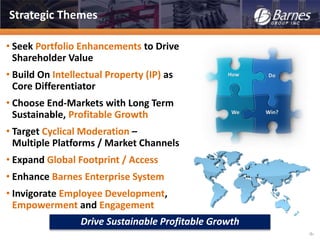
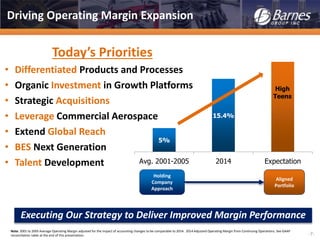
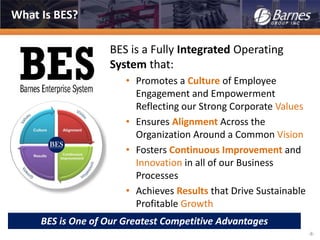
SlideShare a Scribd company logo
1 of 24
Download to read offline
Barnes Group
Investor Overview
April 2015
-2-
This presentation contains forward-looking statements. Forward-
looking statements are made based upon management's good
faith expectations and beliefs concerning future developments and
their potential effect upon the Company. These forward-looking
statements are subject to risks and uncertainties that may cause
actual results to differ materially from those expressed in the
forward-looking statements, including the risks and uncertainties
set forth under our full disclosure located at the end of this
presentation and included in our SEC filings. The Company assumes
no obligation to update our forward-looking statements.
References to adjusted financial results are non-GAAP measures. You will find a GAAP reconciliation
table at the end of this presentation.
Safe Harbor Statement
2013
Completes
Divestiture of
Acquires
Barnes Group Overview
-3-
1857
Wallace Barnes
founds company in
Bristol, CT making
springs for hoop
skirts and clocks 1923
Associated
Spring formed
1946
Associated Spring
stock is offered OTC
1963
Associated Spring is
listed on NYSE
1968
Sales pass $100M
1976
Name changes to
Barnes Group Inc.
1953
Sales pass $50M
1982
Barnes Aerospace
formed
2005
Sales pass $1B
1990
Aero Expands
in Singapore
2007
BGI celebrates its
150th anniversary
2002
Acquires
1999
Acquires
1989
Sales pass $500M
2006
Acquires
2012
Acquires
• An International Industrial and Aerospace Manufacturer and Services Provider,
Serving a Wide Range of End Markets and Customers
• Two Global Business Segments: Industrial & Aerospace
• HQ in Bristol, CT with Global Operations in 60+ Locations; ~ 4,500 Employees
• 81 Consecutive Years of Paying a Dividend
A Long History … Significant Recent Transformation
-4-
Highly Engineered Products and Innovative Solutions
Note: % Sales from Continuing Operations for the year ended December 31, 2014
Americas
56%
2014 Segment Contribution
Aero OEM
28%
Aero
Aftermarket
10%
Aerospace
$440M
35%
Sales – $1,262M
Industrial
$822M
65%
Industrial
$123M
14.9%
Aerospace
$71M
16.3%
Adjusted Operating Profit & Margin
$194M, 15.4%
-5-
Global, Diversified End Markets
Note: % Sales from Continuing Operations for the year ended December 31, 2014
End Markets
Transportation
32%
Industrial
33%
Europe
28%
Asia
17%
Geography
Americas
55%
2014 Sales by End Markets & Geography
Aero OEM
26%
Aero
Aftermarket
9%
-6-
Drive Sustainable Profitable Growth
Strategic Themes
• Seek Portfolio Enhancements to Drive
Shareholder Value
• Build On Intellectual Property (IP) as
Core Differentiator
• Choose End-Markets with Long Term
Sustainable, Profitable Growth
• Target Cyclical Moderation –
Multiple Platforms / Market Channels
• Expand Global Footprint / Access
• Enhance Barnes Enterprise System
• Invigorate Employee Development,
Empowerment and Engagement
-7-
5%
15.4%
High
Teens
Avg. 2001-2005 2014 Expectation
Holding
Company
Approach
Aligned
Portfolio
Note: 2001 to 2005 Average Operating Margin adjusted for the impact of accounting changes to be comparable to 2014. 2014 Adjusted Operating Margin from Continuing Operations. See GAAP
reconciliation table at the end of this presentation.
Today’s Priorities
• Differentiated Products and Processes
• Organic Investment in Growth Platforms
• Strategic Acquisitions
• Leverage Commercial Aerospace
• Extend Global Reach
• BES Next Generation
• Talent Development
Executing Our Strategy to Deliver Improved Margin Performance
Driving Operating Margin Expansion
What Is BES?
BES is a Fully Integrated Operating
System that:
• Promotes a Culture of Employee
Engagement and Empowerment
Reflecting our Strong Corporate Values
• Ensures Alignment Across the
Organization Around a Common Vision
• Fosters Continuous Improvement and
Innovation in all of our Business
Processes
• Achieves Results that Drive Sustainable
Profitable Growth
BES is One of Our Greatest Competitive Advantages
-8-
-9-
Disciplined Capital Allocation
$37 $38
$57 $57
~$55
to
$60
$37 $34 $34
$42 ~$40
2011 2012 2013 2014 2015F
CapEx
Depreciation
CapEx and Depreciation
($ in Millions)
Drive Organic Growth
• 2015F CapEx Range $55 to $60M
• About Half Targeted to Growth Programs
Strategic Portfolio Transformation
• Target Highly Engineered Products & Services
• Expand Global Reach / Channel Penetration
Generate Shareholder Returns
• Continue to Pay a Competitive Dividend
 Annualized Dividend Increased 9% in 2014
• Opportunistic Share Repurchase
 Primarily to Offset Dilution of Equity-Based
Compensation
Capital Allocation
M&A
$607
47%
CapEx
$218
17%
Working
Capital
$120
9%
Share Repo
$158
12%
CRP
$87
7%
Dividends
$105
8%
Uses of Cash 2010 to 2014
($ in Millions)
20%
Returned
Directly to
Shareholders
Portfolio Evolution
Year Sales
Divestitures
Europe 2011 $105
N. America 2013 $300
Acquisitions
2012 $160
2013 $110
($ in millions, ~ annual sales at time of transaction)
M&A Transactions
2010 Sales Mix (1)
Industrial
36%
Aerospace
32%
Distribution
32%
2014 Sales Mix
Industrial
65%
Aerospace
35%
Sales (1) $1,133M
Op. Inc. $ (1) $86.5
Op. Margin (1) 7.6%
Share Price (2) $20.67
Market Cap (2) $1.1B
Sales $1,262M +11%
Adj. Op. Inc. $ $194.5 +125%
Adj. Op. Margin 15.4% +780 bps
Share Price (2) $37.01 +79%
Market Cap (2) $2.0B +82%
Portfolio Transformation Well Underway
-10-
(1) 2010 Sales, Operating Income and Operating Margin are “as reported” in the Company’s 2010 10-K. 2010 Sales
Mix re-calculated to reflect three segments – Aerospace, Industrial & Distribution vs the original two reported
segments of Precision Components & Logistics and Manufacturing Services.
(2) Share Price and Market Cap as of December 31, 2010 and 2014, respectively.
-11-
• Leading Global Manufacturer of Highly-Engineered, High-Quality, Precision Components
• Focused on Custom Components and Solutions Employing Differentiated Industrial Technologies
• Value Added Engineering: Research, Design, Manufacturing, Testing and Evaluation
Industrial – Market Environment
Favorable Industrial End-Markets
TransportationGeneral Industrial
• Advanced Technologies to Meet Fuel Efficiency Requirements
• Highly-Engineered, Precision Components;
Penetration Rates Exceed Market Growth
• Global Light Vehicle Production Forecasted to Increase …
+2% to 3% in 2015, +3% to 4% in 2016 & 2017 (IHS Automotive-Mar’15)
Barnes Group Participation
Light Vehicles – Plastics
Light Vehicles – Metals
Gas Direct Injection (GDi)
8 to 10 Speed Transmissions
• Emerging Market Expansion – Growing with our Customers
• Healthcare Requirements of an Aging Population
• Markit Manufacturing PMIs for March 2015 …
US 55.7, Eurozone 52.2, Emerging Markets 50.1, Global 51.8
Barnes Group Participation
Manufacturing Expansion
Benefiting Tool & Die Market
Healthcare for an Aging
Population
China Expansion
Global Expansion
-12-
Aerospace Provides Superior Technology-Based Manufacturing Solutions and
Comprehensive Component Overhaul and Repair Services to the World’s Major
Jet Engine Manufacturers, Commercial Airlines and Military Customers
Aerospace – Market Environment
Original Equipment Mfg. Aftermarket
• Airbus & Boeing Experienced Strong Order Intake in ‘13 & ‘14
• Airbus & Boeing Backlog at Levels Equivalent to >8 Years of
2015 Estimated Production
• Strong Commercial Aircraft Deliveries Forecasted Over Next
Several Years; 787 & A350 Ramping, 777 in Transition
• Low Oil Prices May Accelerate Spend on Deferred Maintenance
• Older Aircraft May See Greater Utilization
• Global Airline Traffic Growth Remains Solid
• Global Airline Profitability Strong and Growing
• CFM56 Fleet Size and Shop Visits Expected to Grow; Fleet Size to Peak in
2018, Shop Visits to Peak in 2022 Benefiting RSPs and CRPs
0
500
1,000
1,500
2,000
2014 2015E 2016E 2017E 2018E 2019E
Wide-body Narrow-body
Aircraft Deliveries (Units)
Sources: RBC Est. as of April 2015
Well-Positioned in Aerospace End-Markets
-13-
• Provides Highly Engineered
Machined and Fabricated
Components Using Super-alloys
• Concurrent Engineering & NPI
Capabilities Deliver Value
• OEM-Source Approved for Rolls
Royce, SNECMA, GE and Pratt &
Whitney Engines
• FAA/EASA/CAAC Certified
Engine Component Repair
Stations
• Component Repair Programs
(CRPs)
• Revenue Sharing Programs
(RSPs)
• Selected Aftermarket Spare
Parts for CFM56 and CF6
Engines
Maintenance, Repair
& Overhaul
Spare Parts
Aerospace Businesses
(with 2014 Segment Sales Contribution)
Note: FAA is the U.S. Federal Aviation Administration, EASA is the European Aviation Safety Agency, and CAAC is the Civil Aviation Administration of China
75%
25%
Barnes Aerospace OEM Barnes Aerospace Aftermarket
Barnes Aftermarket RSPs and CRPs
2.43 2.45 2.49
2.57
2.77
2.8919.6
21.0
22.3
23.4 24.2 24.5
0
5
10
15
20
25
1.0
1.5
2.0
2.5
3.0
2013 2014 2015 2016 2017 2018
FleetSize(000s)
EstimatedShopVisits(000s)
CFM56 Family of Engines
Shop Visits Fleet Size
0.96
0.90
0.83 0.85
0.82
0.78
3.8 3.7
3.5
3.3
3.0 2.9
0
1
2
3
4
0.4
0.6
0.8
1.0
2013 2014 2015 2016 2017 2018
FleetSize(000s)
EstimatedShopVisits(000s)
CF6 Family of Engines
Shop Visits Fleet Size
Revenue Sharing Programs (RSPs)
 Exclusive Rights to Supply Certain Aftermarket Spare Parts to
General Electric (GE)
 Covers Life of CFM56 & CF6 Engines Programs
 13 Agreements, Entered Between 2003 - 2007
 Investment of $294M, Amortized as a Reduction of Sales
 Quarterly Net Sales Can Vary Due to Inventory Management, Mix of
Engines, Scope of Engine Repair, and Surplus Material for these High
Margin Programs
Component Repair Programs (CRPs)
 Provides Licensing Rights from GE for Repair Services of Certain
Critical Components which Improve Overall Engine Efficiency
 Covers Life of CFM56 & CF6 Engine Programs
 Allows Access to Serve Global Market as OEM Certified Repair Service
 2 Agreements, Entered Between 2013 - 2014
 Investment of $107M, Amortized as a Reduction of Sales
 Expands Margin Profile of Aftermarket MRO Business
Sources: Shop Visit Forecast- ICF Aug’13 for 2013; ICF May’14
for 2014-2018; Fleet Size-Aviation Week CAMRO 2013
Programs Allow Barnes Aerospace to Participate
in OEM Certified Aftermarket Business
-14-
-15-
(1) Our 2014 full-year guidance is only as of our April 24, 2015 earnings call, and it is not being updated or affirmed at this time.
(2) References to adjusted operating margin and adjusted EPS for 2012, 2013, 2014 and 2015 are non-GAAP measures. For a reconciliation to the appropriate GAAP measure, see the Appendix of this presentation.
(3) The Company defines free cash flow as net cash provided by operating activities less capital expenditures. Cash Conversion is equal to Net Cash Provided by Operating Activities less Capital Expenditures divided by Net Income (2011
excludes the loss on sale of Barnes Distribution Europe; the Company has excluded the income tax payments related to the gain on the sale of BDNA made during 2013 and the utilization of the related year-end 2013 income tax receivable
to offset 2014 payments from free cash flow and the gain on the sale of BDNA from net income.)
(4) All previously reported financial information, except for Free Cash Flow, has been adjusted on a retrospective basis to reflect discontinued operations.
$865 $929
$1,092
$1,262
+1%
to +3%
Growth;
+6%
to +8%
Organic
2011 2012 2013 2014 2015F
Net Sales
(Continuing Operations,
$ in Millions)
$1.34 $1.52
$1.83
$2.34
$2.45
to
$2.60
2011 2012 2013 2014 2015F
Adjusted EPS (2)
(Continuing Operations)
11.7% 12.2%
12.9%
15.4%
16%
to
17%
2011 2012 2013 2014 2015F
Adj. Operating Margins (2)
(Continuing Operations)
$84 $99 $83
$117
$136
to
$144
2011 2012 2013 2014 2015F
Free Cash Flow (3)
($ in Millions)
92% 104% 110% 99%
Cash Conversion:
~100%
+5% to 11%
Financial Performance Trends (1,4)
-16-
 Global Industrial Products and Services; Expanding Auto Production
 Commercial Aerospace; Strong OEM, Aftermarket Recovering
 Demonstrated Margin Expansion; Further Expansion Planned
 Benefiting from Barnes Enterprise System
 Strong Cash Generator; Solid Balance Sheet
 Expanding Differentiated Systems, Products and Processes
 Disciplined Acquisitions and Strategic Investments
 Focused on Sustainable, Long-Term Profitable Growth
Well Positioned Businesses
Strong Financial Performance
Strategy Execution Delivering Results
Why Invest In Barnes Group?
Appendix
-18-
Industrial Businesses
(with 2014 Sales Contribution)
Manufacturer of Hot Runner
Systems and Components with a
Focus on Providing High Quality
Products and Value Added
Services
Growth Drivers:
• Expand Automotive Offerings
• Increase Premium Consumer
and Electronics Penetration
End Markets:
• Automotive Exterior and Interior
Components
• General Industrial
• Telecom and Electronic
Components
Specializes in the Development
and Manufacture of High-Precision
Molds and Hot Runner Systems
Growth Drivers:
• Capacity Expansion
• Expand Globally
End Markets:
• Medical / Pharmaceutical
• Personal Care
• Packaging
• Electronic Components
Manufacturer of Nitrogen Gas Springs
and Hydraulic Systems for Automotive
Stamping Dies and Demanding Vehicle
and Industrial Applications
Growth Drivers:
• Expand Tool & Die Offerings
• Extend Machine & Vehicle Offerings
End Markets:
• Industrial Equipment for
Transportation, HVAC, Electronics,
Whitegoods and Sheet Metal Stamping
23%
16% 15%
-19-
Industrial Businesses (Continued)
(with 2014 Segment Sales Contribution)
Pioneer, Leader & Innovator in
Engineered Spring & Precision Metal
Component Manufacturing
Growth Drivers:
• Advanced Transmission Offerings
• Differentiated Product Growth
End Markets:
• Light Vehicle
• General Industrial
• Household / Whitegoods
• Other Transportation
Progressive Stamping, Micro-
Stamping, Fine Blanking and
Forming from Prototype Building
to Complete Assemblies
Growth Drivers:
• Deliver Automotive GDi
(Gas Direct Injection)
• Develop Adjacent Markets, such
as Medical
End Markets:
• Light Vehicle
• General Industrial
Develops and Produces a
Comprehensive Range of
Retaining Rings, Fasteners, Snap
Rings and Shims
Growth Drivers:
• Expand Globally
• Enhance Product Offerings
End Markets:
• Light Vehicle
• General Industrial
32%
6% 8%
-20-
Shaft Nuts & Gears
Engine
Cases
Retainer
Rings
Rotating Air Ducts
HP and LP Shrouds,
Hangers and Segments,
Machined & Fabricated
Turbine Exhaust
Cases, Cones,
Cylinders and
Fairings
Combustor Components
Rotating Air/Oil Seals,
Vane Rings, Lever Arms
Stub
Shafts
Struts
ManifoldsBearing
Housings
Tube and
Duct Assemblies
Vane Actuation
Rings, Lever Arms
Barnes Aerospace Components
-21-
Out of Production:
JT-9D (DC10,B747,B767,A310)
JT-8D (DC9,MD80,B727,B737)
PW2000 (B757)
CF6-6 (DC10)
CF6-50 (A300)
Trent 500 (A340)
Trent 800 (B777)
Development:
Leap A,B,C (A320Neo,B737Max,C919)
GE9X (B777X)
PW1000 GTF (Cseries, E Jets, MRJ)
Passport (Global 7000/8000)
Trent 7000 (A330Neo)
Silvercrest (Dassault, Cessna)
DEV. EARLY
PROD.
PRODUCT
MATURITY
SPARES
PRODUCTION
VOLUME
TIME
COST
OUT OF
PRODUCTION
SPARES
NEW EMERGING &
EARLY LIFE CYCLE
PROGRAMS
Mature:
CFM56 (B737, A320)
CF6-80E (A330)
CF34-3/8 (CRJ, E175)
CF34-10E (E195)
AE3000 (Embraer, Cessna)
V2500 (A320)
PW4000(B767)
Trent700 (A330)
Trent900 (A380)
GP7200 (A380)
GE90-115B (B777)
Early Production:
GENX-1B (B787)
GENX-2B (B747)
Trent 1000 (B787)
Trent XWB (A350)
Participation Throughout The Product Life Cycle
Commercial Aircraft Engine Product Life Cycle
Appendix: Non-GAAP Financial Measure Reconciliation
($ in Thousands, except per share data)
-22-
2014 2013 2012 (1)
SEGMENT RESULTS
Operating Profit - Industrial Segment (GAAP) 108,360$ 71,888$ 49,253$
Synventive short-term purchase accounting adjustments - - 4,987
Synventive acquisition transaction costs - - 912
Männer short-term purchase accounting adjustments 8,504 5,456 -
Männer acquisition transaction costs - 1,823 -
Restructuring Charges 6,020 - -
CEO transition costs - 6,589 -
Operating Profit - Industrial Segment as adjusted (Non-GAAP) (2)
122,884$ 85,756$ 55,152$
Operating Margin - Industrial Segment (GAAP) 13.2% 10.5% 9.1%
Operating Margin - Industrial Segment as adjusted (Non-GAAP) (2)
14.9% 12.5% 10.2%
Operating Profit - Aerospace Segment (GAAP) 71,614$ 51,313$ 57,878$
CEO transition costs - 3,903 -
Operating Profit - Aerospace Segment as adjusted (Non-GAAP) (2)
71,614$ 55,216$ 57,878$
Operating Margin - Aerospace Segment (GAAP) 16.3% 12.7% 14.8%
Operating Margin - Aerospace Segment as adjusted (Non-GAAP) (2)
16.3% 13.7% 14.8%
CONSOLIDATED RESULTS
Operating Income (GAAP) 179,974$ 123,201$ 107,131$
Synventive short-term purchase accounting adjustments - - 4,987
Synventive acquisition transaction costs - - 912
Männer short-term purchase accounting adjustments 8,504 5,456 -
Männer acquisition transaction costs - 1,823 -
Restructuring Charges 6,020 - -
CEO transition costs - 10,492 -
Operating Income as adjusted (Non-GAAP) (2)
194,498$ 140,972$ 113,030$
Operating Margin (GAAP) 14.3% 11.3% 11.5%
Operating Margin as adjusted (Non-GAAP) (2)
15.4% 12.9% 12.2%
Diluted Income from Continuing Operations per Share (GAAP) 2.16$ 1.31$ 1.44$
Synventive short-term purchase accounting adjustments - - 0.07
Synventive acquisition transaction costs - - 0.01
Männer short-term purchase accounting adjustments 0.11 0.07 -
Männer acquisition transaction costs - 0.03 -
Restructuring Charges 0.07 - -
CEO transition costs - 0.12 -
April 2013 tax court decision - 0.30 -
Diluted Income from Continuing Operations per Share as adjusted (Non-GAAP) (2)
2.34$ 1.83$ 1.52$
Diluted Income from Continuing Operations per Share (GAAP) 2.43$ to 2.58$
Männer short-term purchase accounting adjustments 0.02
Diluted Income from Continuing Operations per Share as adjusted (Non-GAAP) (2)
2.45$ to 2.60$
Twelve months ended December 31,
Full-Year 2015 Outlook
Notes:
(1) Results for 2012 have been adjusted on a retrospective basis to reflect
the impact of the BDNA discontinued operations, including a reallocation
of corporate overhead expenses, and the segment realignment.
(2) The Company has excluded the following from its "as adjusted"
financial measurements: 1) short-term purchase accounting adjustments
and transaction costs related to its Synventive acquisition in 2012, 2)
short-term purchase accounting adjustments and transaction costs related
to its Männer acquisition in 2013, 2014 and 2015, 3) restructuring charges
related to the closure of production operations at the Company’s
Associated Spring facility located in Saline, Michigan in 2014 , 4) CEO
transition costs associated with the modification of outstanding equity
awards in 2013, and 5) the tax charge associated with the April 2013 tax
court decision in 2013.
Management believes that these adjustments provide the Company and
its investors with an indication of our baseline performance excluding
items that are not considered to be reflective of our ongoing results.
Management does not intend results excluding the adjustments to
represent results as defined by GAAP, and the reader should not consider
it as an alternative measurement calculated in accordance with GAAP, or
as an indicator of the Company's performance. Accordingly, the
measurements have limitations depending on their use.
As Barnes Group does not predict special items that may occur in the
future, and because our outlook is developed at a level of detail different
than that used to prepare GAAP-based financial measures, we do not
provide reconciliations to GAAP of our forward-looking financial measures.
-23-
Safe Harbor Statement
This presentation contains forward-looking statements as defined in the Private Securities Litigation Reform Act of
1995. Forward-looking statements often address our expected future operating and financial performance and financial
condition, and often contain words such as "anticipate," "believe," "expect," "plan," "strategy," "estimate," "project,"
and similar terms. These forward-looking statements do not constitute guarantees of future performance and are
subject to a variety of risks and uncertainties that may cause actual results to differ materially from those expressed in
the forward-looking statements. These include, among others: difficulty maintaining relationships with employees,
including unionized employees, customers, distributors, suppliers, business partners or governmental entities; failure to
successfully negotiate collective bargaining agreements or potential strikes, work stoppages or other similar events;
difficulties leveraging market opportunities; changes in market demand for our products and services; rapid
technological and market change; the ability to protect intellectual property rights; introduction or development of new
products or transfer of work; higher risks in international operations and markets; the impact of intense competition;
and other risks and uncertainties described in documents filed with or furnished to the Securities and Exchange
Commission ("SEC") by the Company, including, among others, uncertainties relating to conditions in financial markets;
currency fluctuations and foreign currency exposure; future financial performance of the industries or customers that
we serve; our dependence upon revenues and earnings from a small number of significant customers; a major loss of
customers; inability to realize expected sales or profits from existing backlog due to a range of factors, including
insourcing decisions, material changes, production schedules and volumes of specific programs; the impact of
government budget and funding decisions; changes in raw material or product prices and availability; integration of
acquired businesses; restructuring costs or savings; the continuing impact of prior acquisitions and divestitures and any
other future strategic actions, including acquisitions, joint ventures, divestitures, restructurings, or strategic business
realignments, and our ability to achieve the financial and operational targets set in connection with any such actions;
the outcome of pending and future legal, governmental, or regulatory proceedings and contingencies and uninsured
claims; future repurchases of common stock; future levels of indebtedness; and numerous other matters of a global,
regional or national scale, including those of a political, economic, business, competitive, environmental, regulatory and
public health nature. The Company assumes no obligation to update our forward-looking statements.
24

More Related Content

What's hot

Electrical Products Group Conference
Electrical Products Group ConferenceElectrical Products Group Conference
Electrical Products Group ConferenceTextronCorp
 
Delta airlines pitch
Delta airlines pitch Delta airlines pitch
Delta airlines pitch Kelvin Li
 
Time to go cyclical cv industry gears up for a multi-year upcycle - edelweiss
Time to go cyclical   cv industry gears up for a multi-year upcycle - edelweissTime to go cyclical   cv industry gears up for a multi-year upcycle - edelweiss
Time to go cyclical cv industry gears up for a multi-year upcycle - edelweissSD
 
Cleveland Research Company Stock Pitch Compeition - 2014
Cleveland Research Company Stock Pitch Compeition - 2014Cleveland Research Company Stock Pitch Compeition - 2014
Cleveland Research Company Stock Pitch Compeition - 2014Michael T. Loffredo
 
GE Aviation_Tushar
GE Aviation_TusharGE Aviation_Tushar
GE Aviation_TusharTushar Shan
 
Gabelli conference investor deck
Gabelli conference investor deckGabelli conference investor deck
Gabelli conference investor deckHillenbrand_IR
 
Textron Investor Meetings
Textron Investor Meetings  Textron Investor Meetings
Textron Investor Meetings TextronCorp
 
16 06 pii ir june 7 2016
16 06 pii ir june 7 201616 06 pii ir june 7 2016
16 06 pii ir june 7 2016investorpolaris
 
Finmeccanica Full Year 2013 Results Presentation
Finmeccanica Full Year 2013 Results PresentationFinmeccanica Full Year 2013 Results Presentation
Finmeccanica Full Year 2013 Results PresentationLeonardo
 
Polaris Q1 2016 Earning Presentation
Polaris Q1 2016 Earning PresentationPolaris Q1 2016 Earning Presentation
Polaris Q1 2016 Earning Presentationinvestorpolaris
 
Polaris Investor Presentation – May 2016
Polaris Investor Presentation – May 2016Polaris Investor Presentation – May 2016
Polaris Investor Presentation – May 2016investorpolaris
 
Finmeccanica First Half 2015 results presentation
Finmeccanica First Half 2015 results presentationFinmeccanica First Half 2015 results presentation
Finmeccanica First Half 2015 results presentationLeonardo
 
Polaris Presents at Raymond James Conference
Polaris Presents at Raymond James ConferencePolaris Presents at Raymond James Conference
Polaris Presents at Raymond James Conferenceinvestorpolaris
 
Myers investor presentation-may-2014
Myers investor presentation-may-2014Myers investor presentation-may-2014
Myers investor presentation-may-2014Company Spotlight
 
Investor Presentation November 2014
Investor Presentation November 2014Investor Presentation November 2014
Investor Presentation November 2014investorpolaris
 

What's hot (18)

Electrical Products Group Conference
Electrical Products Group ConferenceElectrical Products Group Conference
Electrical Products Group Conference
 
Delta airlines pitch
Delta airlines pitch Delta airlines pitch
Delta airlines pitch
 
Time to go cyclical cv industry gears up for a multi-year upcycle - edelweiss
Time to go cyclical   cv industry gears up for a multi-year upcycle - edelweissTime to go cyclical   cv industry gears up for a multi-year upcycle - edelweiss
Time to go cyclical cv industry gears up for a multi-year upcycle - edelweiss
 
Cleveland Research Company Stock Pitch Compeition - 2014
Cleveland Research Company Stock Pitch Compeition - 2014Cleveland Research Company Stock Pitch Compeition - 2014
Cleveland Research Company Stock Pitch Compeition - 2014
 
GE Aviation_Tushar
GE Aviation_TusharGE Aviation_Tushar
GE Aviation_Tushar
 
Gabelli conference investor deck
Gabelli conference investor deckGabelli conference investor deck
Gabelli conference investor deck
 
AAL
AALAAL
AAL
 
Textron Investor Meetings
Textron Investor Meetings  Textron Investor Meetings
Textron Investor Meetings
 
Q2 2013 conferencecall
Q2 2013 conferencecallQ2 2013 conferencecall
Q2 2013 conferencecall
 
16 06 pii ir june 7 2016
16 06 pii ir june 7 201616 06 pii ir june 7 2016
16 06 pii ir june 7 2016
 
Finmeccanica Full Year 2013 Results Presentation
Finmeccanica Full Year 2013 Results PresentationFinmeccanica Full Year 2013 Results Presentation
Finmeccanica Full Year 2013 Results Presentation
 
Polaris Q1 2016 Earning Presentation
Polaris Q1 2016 Earning PresentationPolaris Q1 2016 Earning Presentation
Polaris Q1 2016 Earning Presentation
 
Polaris Investor Presentation – May 2016
Polaris Investor Presentation – May 2016Polaris Investor Presentation – May 2016
Polaris Investor Presentation – May 2016
 
Finmeccanica First Half 2015 results presentation
Finmeccanica First Half 2015 results presentationFinmeccanica First Half 2015 results presentation
Finmeccanica First Half 2015 results presentation
 
Polaris Presents at Raymond James Conference
Polaris Presents at Raymond James ConferencePolaris Presents at Raymond James Conference
Polaris Presents at Raymond James Conference
 
Myers investor presentation-may-2014
Myers investor presentation-may-2014Myers investor presentation-may-2014
Myers investor presentation-may-2014
 
Investor Presentation November 2014
Investor Presentation November 2014Investor Presentation November 2014
Investor Presentation November 2014
 
1 q17 earnings presentation
1 q17 earnings presentation1 q17 earnings presentation
1 q17 earnings presentation
 

Viewers also liked

Rahul deodhar nmims ftmba presentation june2013
Rahul deodhar nmims ftmba presentation june2013Rahul deodhar nmims ftmba presentation june2013
Rahul deodhar nmims ftmba presentation june2013Rahul Deodhar
 
3 Dimensional Services Group - Prototype Plastic and Assemblies
3 Dimensional Services Group - Prototype Plastic and Assemblies3 Dimensional Services Group - Prototype Plastic and Assemblies
3 Dimensional Services Group - Prototype Plastic and AssembliesRminowa
 
Ideas in subverting capitalism and demcracy
Ideas in subverting capitalism and demcracyIdeas in subverting capitalism and demcracy
Ideas in subverting capitalism and demcracyRahul Deodhar
 
Nmims nm paladins 5
Nmims nm paladins 5Nmims nm paladins 5
Nmims nm paladins 5Piyush Jain
 
Future Without Poverty
Future Without PovertyFuture Without Poverty
Future Without PovertyRahul Deodhar
 
Rethinking education
Rethinking educationRethinking education
Rethinking educationRahul Deodhar
 

Viewers also liked (6)

Rahul deodhar nmims ftmba presentation june2013
Rahul deodhar nmims ftmba presentation june2013Rahul deodhar nmims ftmba presentation june2013
Rahul deodhar nmims ftmba presentation june2013
 
3 Dimensional Services Group - Prototype Plastic and Assemblies
3 Dimensional Services Group - Prototype Plastic and Assemblies3 Dimensional Services Group - Prototype Plastic and Assemblies
3 Dimensional Services Group - Prototype Plastic and Assemblies
 
Ideas in subverting capitalism and demcracy
Ideas in subverting capitalism and demcracyIdeas in subverting capitalism and demcracy
Ideas in subverting capitalism and demcracy
 
Nmims nm paladins 5
Nmims nm paladins 5Nmims nm paladins 5
Nmims nm paladins 5
 
Future Without Poverty
Future Without PovertyFuture Without Poverty
Future Without Poverty
 
Rethinking education
Rethinking educationRethinking education
Rethinking education
 

Similar to Barnes Group Investor Overview

Bgi investor-overview-march-2015 v001-m64oku
Bgi investor-overview-march-2015 v001-m64okuBgi investor-overview-march-2015 v001-m64oku
Bgi investor-overview-march-2015 v001-m64okuBarnes_Group
 
Bgi investor-overview-march-2015 v001-m64oku
Bgi investor-overview-march-2015 v001-m64okuBgi investor-overview-march-2015 v001-m64oku
Bgi investor-overview-march-2015 v001-m64okuBarnes_Group
 
Barnes Group Investor Overview - October 2015
Barnes Group Investor Overview - October 2015Barnes Group Investor Overview - October 2015
Barnes Group Investor Overview - October 2015Barnes_Group
 
Investor Overview October 2014
Investor Overview  October 2014Investor Overview  October 2014
Investor Overview October 2014Barnes_Group
 
Barnes Group Inc. Investor Overview - July 2017
Barnes Group Inc. Investor Overview - July 2017Barnes Group Inc. Investor Overview - July 2017
Barnes Group Inc. Investor Overview - July 2017Barnes_Group
 
Barnes Group Inc. Investor Overview - February 2017
Barnes Group Inc. Investor Overview - February 2017Barnes Group Inc. Investor Overview - February 2017
Barnes Group Inc. Investor Overview - February 2017Barnes_Group
 
Barnes Group Inc. Investor Overview - April 2016
Barnes Group Inc. Investor Overview - April 2016Barnes Group Inc. Investor Overview - April 2016
Barnes Group Inc. Investor Overview - April 2016Terri Chapman
 
Barnes Group Inc. Investor Overview - November 2016
Barnes Group Inc. Investor Overview - November 2016Barnes Group Inc. Investor Overview - November 2016
Barnes Group Inc. Investor Overview - November 2016Barnes_Group
 
Barnes Group Inc. Investor Overview - March 2016
Barnes Group Inc. Investor Overview - March 2016Barnes Group Inc. Investor Overview - March 2016
Barnes Group Inc. Investor Overview - March 2016Terri Chapman
 
Barnes Group Inc. Investor Overview - July 2016
Barnes Group Inc. Investor Overview - July 2016Barnes Group Inc. Investor Overview - July 2016
Barnes Group Inc. Investor Overview - July 2016Terri Chapman
 
Cw 3 q 2016 ir presentation final2
Cw 3 q 2016 ir presentation final2Cw 3 q 2016 ir presentation final2
Cw 3 q 2016 ir presentation final2q4curtisswright
 
CW 3Q 2016 IR Presentation
CW 3Q 2016 IR PresentationCW 3Q 2016 IR Presentation
CW 3Q 2016 IR Presentationq4curtisswright
 
Mye presentation november 2015
Mye presentation november 2015Mye presentation november 2015
Mye presentation november 2015Myers_Investors
 
April/May 2018 Investor Presentation
April/May 2018 Investor PresentationApril/May 2018 Investor Presentation
April/May 2018 Investor Presentationingersollrand2016
 
2018 UBS Global Industrials and Transportation Conference Presentation
2018 UBS Global Industrials and Transportation Conference Presentation2018 UBS Global Industrials and Transportation Conference Presentation
2018 UBS Global Industrials and Transportation Conference Presentationingersollrand2016
 
May 2018 investor presentation
May 2018 investor presentationMay 2018 investor presentation
May 2018 investor presentationingersollrand2016
 
Investor presentation november 2014
Investor presentation november 2014Investor presentation november 2014
Investor presentation november 2014Myers_Investors
 
Ir standard-presentation-feb-2018
Ir standard-presentation-feb-2018Ir standard-presentation-feb-2018
Ir standard-presentation-feb-2018Barnes_Group
 
Ir standard presentation feb 2018
Ir standard presentation feb 2018Ir standard presentation feb 2018
Ir standard presentation feb 2018Barnes_Group
 
Gama Aviation H1 2015 results
Gama Aviation H1 2015 resultsGama Aviation H1 2015 results
Gama Aviation H1 2015 resultsGama Aviation Plc
 

Similar to Barnes Group Investor Overview (20)

Bgi investor-overview-march-2015 v001-m64oku
Bgi investor-overview-march-2015 v001-m64okuBgi investor-overview-march-2015 v001-m64oku
Bgi investor-overview-march-2015 v001-m64oku
 
Bgi investor-overview-march-2015 v001-m64oku
Bgi investor-overview-march-2015 v001-m64okuBgi investor-overview-march-2015 v001-m64oku
Bgi investor-overview-march-2015 v001-m64oku
 
Barnes Group Investor Overview - October 2015
Barnes Group Investor Overview - October 2015Barnes Group Investor Overview - October 2015
Barnes Group Investor Overview - October 2015
 
Investor Overview October 2014
Investor Overview  October 2014Investor Overview  October 2014
Investor Overview October 2014
 
Barnes Group Inc. Investor Overview - July 2017
Barnes Group Inc. Investor Overview - July 2017Barnes Group Inc. Investor Overview - July 2017
Barnes Group Inc. Investor Overview - July 2017
 
Barnes Group Inc. Investor Overview - February 2017
Barnes Group Inc. Investor Overview - February 2017Barnes Group Inc. Investor Overview - February 2017
Barnes Group Inc. Investor Overview - February 2017
 
Barnes Group Inc. Investor Overview - April 2016
Barnes Group Inc. Investor Overview - April 2016Barnes Group Inc. Investor Overview - April 2016
Barnes Group Inc. Investor Overview - April 2016
 
Barnes Group Inc. Investor Overview - November 2016
Barnes Group Inc. Investor Overview - November 2016Barnes Group Inc. Investor Overview - November 2016
Barnes Group Inc. Investor Overview - November 2016
 
Barnes Group Inc. Investor Overview - March 2016
Barnes Group Inc. Investor Overview - March 2016Barnes Group Inc. Investor Overview - March 2016
Barnes Group Inc. Investor Overview - March 2016
 
Barnes Group Inc. Investor Overview - July 2016
Barnes Group Inc. Investor Overview - July 2016Barnes Group Inc. Investor Overview - July 2016
Barnes Group Inc. Investor Overview - July 2016
 
Cw 3 q 2016 ir presentation final2
Cw 3 q 2016 ir presentation final2Cw 3 q 2016 ir presentation final2
Cw 3 q 2016 ir presentation final2
 
CW 3Q 2016 IR Presentation
CW 3Q 2016 IR PresentationCW 3Q 2016 IR Presentation
CW 3Q 2016 IR Presentation
 
Mye presentation november 2015
Mye presentation november 2015Mye presentation november 2015
Mye presentation november 2015
 
April/May 2018 Investor Presentation
April/May 2018 Investor PresentationApril/May 2018 Investor Presentation
April/May 2018 Investor Presentation
 
2018 UBS Global Industrials and Transportation Conference Presentation
2018 UBS Global Industrials and Transportation Conference Presentation2018 UBS Global Industrials and Transportation Conference Presentation
2018 UBS Global Industrials and Transportation Conference Presentation
 
May 2018 investor presentation
May 2018 investor presentationMay 2018 investor presentation
May 2018 investor presentation
 
Investor presentation november 2014
Investor presentation november 2014Investor presentation november 2014
Investor presentation november 2014
 
Ir standard-presentation-feb-2018
Ir standard-presentation-feb-2018Ir standard-presentation-feb-2018
Ir standard-presentation-feb-2018
 
Ir standard presentation feb 2018
Ir standard presentation feb 2018Ir standard presentation feb 2018
Ir standard presentation feb 2018
 
Gama Aviation H1 2015 results
Gama Aviation H1 2015 resultsGama Aviation H1 2015 results
Gama Aviation H1 2015 results
 

More from Barnes_Group

Ir overview presentation april 2018 final
Ir overview presentation april 2018 finalIr overview presentation april 2018 final
Ir overview presentation april 2018 finalBarnes_Group
 
Ir overview presentation april 2018 final
Ir overview presentation april 2018 finalIr overview presentation april 2018 final
Ir overview presentation april 2018 finalBarnes_Group
 
Q1 2018 earnings supplement slides final
Q1 2018 earnings supplement slides   finalQ1 2018 earnings supplement slides   final
Q1 2018 earnings supplement slides finalBarnes_Group
 
Ir overview october 2017 final
Ir overview october 2017 finalIr overview october 2017 final
Ir overview october 2017 finalBarnes_Group
 
Ir overview october 2017 final
Ir overview october 2017 finalIr overview october 2017 final
Ir overview october 2017 finalBarnes_Group
 
Barnes group inc 2016 annual report pdf final
Barnes group inc 2016 annual report pdf finalBarnes group inc 2016 annual report pdf final
Barnes group inc 2016 annual report pdf finalBarnes_Group
 
Barnes Group Investor Overview - April 2015
Barnes Group Investor Overview - April 2015Barnes Group Investor Overview - April 2015
Barnes Group Investor Overview - April 2015Barnes_Group
 
Q1 2015 earnings supplement final
Q1 2015 earnings supplement finalQ1 2015 earnings supplement final
Q1 2015 earnings supplement finalBarnes_Group
 
Q3 2014 Earnings Release Supplement
Q3 2014 Earnings Release SupplementQ3 2014 Earnings Release Supplement
Q3 2014 Earnings Release SupplementBarnes_Group
 

More from Barnes_Group (9)

Ir overview presentation april 2018 final
Ir overview presentation april 2018 finalIr overview presentation april 2018 final
Ir overview presentation april 2018 final
 
Ir overview presentation april 2018 final
Ir overview presentation april 2018 finalIr overview presentation april 2018 final
Ir overview presentation april 2018 final
 
Q1 2018 earnings supplement slides final
Q1 2018 earnings supplement slides   finalQ1 2018 earnings supplement slides   final
Q1 2018 earnings supplement slides final
 
Ir overview october 2017 final
Ir overview october 2017 finalIr overview october 2017 final
Ir overview october 2017 final
 
Ir overview october 2017 final
Ir overview october 2017 finalIr overview october 2017 final
Ir overview october 2017 final
 
Barnes group inc 2016 annual report pdf final
Barnes group inc 2016 annual report pdf finalBarnes group inc 2016 annual report pdf final
Barnes group inc 2016 annual report pdf final
 
Barnes Group Investor Overview - April 2015
Barnes Group Investor Overview - April 2015Barnes Group Investor Overview - April 2015
Barnes Group Investor Overview - April 2015
 
Q1 2015 earnings supplement final
Q1 2015 earnings supplement finalQ1 2015 earnings supplement final
Q1 2015 earnings supplement final
 
Q3 2014 Earnings Release Supplement
Q3 2014 Earnings Release SupplementQ3 2014 Earnings Release Supplement
Q3 2014 Earnings Release Supplement
 

Recently uploaded

CALL ON ➥8923113531 🔝Call Girls Fazullaganj Lucknow best sexual service
CALL ON ➥8923113531 🔝Call Girls Fazullaganj Lucknow best sexual serviceCALL ON ➥8923113531 🔝Call Girls Fazullaganj Lucknow best sexual service
CALL ON ➥8923113531 🔝Call Girls Fazullaganj Lucknow best sexual serviceanilsa9823
 
VIP 7001035870 Find & Meet Hyderabad Call Girls Shamirpet high-profile Call Girl
VIP 7001035870 Find & Meet Hyderabad Call Girls Shamirpet high-profile Call GirlVIP 7001035870 Find & Meet Hyderabad Call Girls Shamirpet high-profile Call Girl
VIP 7001035870 Find & Meet Hyderabad Call Girls Shamirpet high-profile Call Girladitipandeya
 
Sustainability Leadership, April 26 2024
Sustainability Leadership, April 26 2024Sustainability Leadership, April 26 2024
Sustainability Leadership, April 26 2024TeckResourcesLtd
 
Cyberagent_For New Investors_EN_240424.pdf
Cyberagent_For New Investors_EN_240424.pdfCyberagent_For New Investors_EN_240424.pdf
Cyberagent_For New Investors_EN_240424.pdfCyberAgent, Inc.
 
VIP Amritsar Call Girl 7001035870 Enjoy Call Girls With Our Escorts
VIP Amritsar Call Girl 7001035870 Enjoy Call Girls With Our EscortsVIP Amritsar Call Girl 7001035870 Enjoy Call Girls With Our Escorts
VIP Amritsar Call Girl 7001035870 Enjoy Call Girls With Our Escortssonatiwari757
 
Malad Escorts, (Pooja 09892124323), Malad Call Girls Service
Malad Escorts, (Pooja 09892124323), Malad Call Girls ServiceMalad Escorts, (Pooja 09892124323), Malad Call Girls Service
Malad Escorts, (Pooja 09892124323), Malad Call Girls ServicePooja Nehwal
 
VIP 7001035870 Find & Meet Hyderabad Call Girls Shamshabad high-profile Call ...
VIP 7001035870 Find & Meet Hyderabad Call Girls Shamshabad high-profile Call ...VIP 7001035870 Find & Meet Hyderabad Call Girls Shamshabad high-profile Call ...
VIP 7001035870 Find & Meet Hyderabad Call Girls Shamshabad high-profile Call ...aditipandeya
 
OKC Thunder Reveal Game 2 Playoff T Shirts
OKC Thunder Reveal Game 2 Playoff T ShirtsOKC Thunder Reveal Game 2 Playoff T Shirts
OKC Thunder Reveal Game 2 Playoff T Shirtsrahman018755
 
Teck Investor Presentation, April 24, 2024
Teck Investor Presentation, April 24, 2024Teck Investor Presentation, April 24, 2024
Teck Investor Presentation, April 24, 2024TeckResourcesLtd
 
Short-, Mid-, and Long-term gxxoals.pptx
Short-, Mid-, and Long-term gxxoals.pptxShort-, Mid-, and Long-term gxxoals.pptx
Short-, Mid-, and Long-term gxxoals.pptxHenryBriggs2
 
VIP 7001035870 Find & Meet Hyderabad Call Girls Miyapur high-profile Call Girl
VIP 7001035870 Find & Meet Hyderabad Call Girls Miyapur high-profile Call GirlVIP 7001035870 Find & Meet Hyderabad Call Girls Miyapur high-profile Call Girl
VIP 7001035870 Find & Meet Hyderabad Call Girls Miyapur high-profile Call Girladitipandeya
 
slideshare Call girls Noida Escorts 9999965857 henakhan
slideshare Call girls Noida Escorts 9999965857 henakhanslideshare Call girls Noida Escorts 9999965857 henakhan
slideshare Call girls Noida Escorts 9999965857 henakhanhanshkumar9870
 
VIP Kolkata Call Girl Entally 👉 8250192130 Available With Room
VIP Kolkata Call Girl Entally 👉 8250192130  Available With RoomVIP Kolkata Call Girl Entally 👉 8250192130  Available With Room
VIP Kolkata Call Girl Entally 👉 8250192130 Available With Roomdivyansh0kumar0
 

Recently uploaded (20)

CALL ON ➥8923113531 🔝Call Girls Fazullaganj Lucknow best sexual service
CALL ON ➥8923113531 🔝Call Girls Fazullaganj Lucknow best sexual serviceCALL ON ➥8923113531 🔝Call Girls Fazullaganj Lucknow best sexual service
CALL ON ➥8923113531 🔝Call Girls Fazullaganj Lucknow best sexual service
 
VIP 7001035870 Find & Meet Hyderabad Call Girls Shamirpet high-profile Call Girl
VIP 7001035870 Find & Meet Hyderabad Call Girls Shamirpet high-profile Call GirlVIP 7001035870 Find & Meet Hyderabad Call Girls Shamirpet high-profile Call Girl
VIP 7001035870 Find & Meet Hyderabad Call Girls Shamirpet high-profile Call Girl
 
Call Girls In Vasant Kunj 📱 9999965857 🤩 Delhi 🫦 HOT AND SEXY VVIP 🍎 SERVICE
Call Girls In Vasant Kunj 📱  9999965857  🤩 Delhi 🫦 HOT AND SEXY VVIP 🍎 SERVICECall Girls In Vasant Kunj 📱  9999965857  🤩 Delhi 🫦 HOT AND SEXY VVIP 🍎 SERVICE
Call Girls In Vasant Kunj 📱 9999965857 🤩 Delhi 🫦 HOT AND SEXY VVIP 🍎 SERVICE
 
Sustainability Leadership, April 26 2024
Sustainability Leadership, April 26 2024Sustainability Leadership, April 26 2024
Sustainability Leadership, April 26 2024
 
Call Girls Service Green Park @9999965857 Delhi 🫦 No Advance VVIP 🍎 SERVICE
Call Girls Service Green Park @9999965857 Delhi 🫦 No Advance  VVIP 🍎 SERVICECall Girls Service Green Park @9999965857 Delhi 🫦 No Advance  VVIP 🍎 SERVICE
Call Girls Service Green Park @9999965857 Delhi 🫦 No Advance VVIP 🍎 SERVICE
 
Call Girls 🫤 Mahipalpur ➡️ 9999965857 ➡️ Delhi 🫦 Russian Escorts FULL ENJOY
Call Girls 🫤 Mahipalpur ➡️ 9999965857  ➡️ Delhi 🫦  Russian Escorts FULL ENJOYCall Girls 🫤 Mahipalpur ➡️ 9999965857  ➡️ Delhi 🫦  Russian Escorts FULL ENJOY
Call Girls 🫤 Mahipalpur ➡️ 9999965857 ➡️ Delhi 🫦 Russian Escorts FULL ENJOY
 
Cyberagent_For New Investors_EN_240424.pdf
Cyberagent_For New Investors_EN_240424.pdfCyberagent_For New Investors_EN_240424.pdf
Cyberagent_For New Investors_EN_240424.pdf
 
Model Call Girl in Uttam Nagar Delhi reach out to us at 🔝9953056974🔝
Model Call Girl in Uttam Nagar Delhi reach out to us at 🔝9953056974🔝Model Call Girl in Uttam Nagar Delhi reach out to us at 🔝9953056974🔝
Model Call Girl in Uttam Nagar Delhi reach out to us at 🔝9953056974🔝
 
Model Call Girl in Udyog Vihar Delhi reach out to us at 🔝9953056974🔝
Model Call Girl in Udyog Vihar Delhi reach out to us at 🔝9953056974🔝Model Call Girl in Udyog Vihar Delhi reach out to us at 🔝9953056974🔝
Model Call Girl in Udyog Vihar Delhi reach out to us at 🔝9953056974🔝
 
VIP Amritsar Call Girl 7001035870 Enjoy Call Girls With Our Escorts
VIP Amritsar Call Girl 7001035870 Enjoy Call Girls With Our EscortsVIP Amritsar Call Girl 7001035870 Enjoy Call Girls With Our Escorts
VIP Amritsar Call Girl 7001035870 Enjoy Call Girls With Our Escorts
 
Malad Escorts, (Pooja 09892124323), Malad Call Girls Service
Malad Escorts, (Pooja 09892124323), Malad Call Girls ServiceMalad Escorts, (Pooja 09892124323), Malad Call Girls Service
Malad Escorts, (Pooja 09892124323), Malad Call Girls Service
 
VIP 7001035870 Find & Meet Hyderabad Call Girls Shamshabad high-profile Call ...
VIP 7001035870 Find & Meet Hyderabad Call Girls Shamshabad high-profile Call ...VIP 7001035870 Find & Meet Hyderabad Call Girls Shamshabad high-profile Call ...
VIP 7001035870 Find & Meet Hyderabad Call Girls Shamshabad high-profile Call ...
 
OKC Thunder Reveal Game 2 Playoff T Shirts
OKC Thunder Reveal Game 2 Playoff T ShirtsOKC Thunder Reveal Game 2 Playoff T Shirts
OKC Thunder Reveal Game 2 Playoff T Shirts
 
Teck Investor Presentation, April 24, 2024
Teck Investor Presentation, April 24, 2024Teck Investor Presentation, April 24, 2024
Teck Investor Presentation, April 24, 2024
 
Short-, Mid-, and Long-term gxxoals.pptx
Short-, Mid-, and Long-term gxxoals.pptxShort-, Mid-, and Long-term gxxoals.pptx
Short-, Mid-, and Long-term gxxoals.pptx
 
VIP 7001035870 Find & Meet Hyderabad Call Girls Miyapur high-profile Call Girl
VIP 7001035870 Find & Meet Hyderabad Call Girls Miyapur high-profile Call GirlVIP 7001035870 Find & Meet Hyderabad Call Girls Miyapur high-profile Call Girl
VIP 7001035870 Find & Meet Hyderabad Call Girls Miyapur high-profile Call Girl
 
Rohini Sector 17 Call Girls Delhi 9999965857 @Sabina Saikh No Advance
Rohini Sector 17 Call Girls Delhi 9999965857 @Sabina Saikh No AdvanceRohini Sector 17 Call Girls Delhi 9999965857 @Sabina Saikh No Advance
Rohini Sector 17 Call Girls Delhi 9999965857 @Sabina Saikh No Advance
 
slideshare Call girls Noida Escorts 9999965857 henakhan
slideshare Call girls Noida Escorts 9999965857 henakhanslideshare Call girls Noida Escorts 9999965857 henakhan
slideshare Call girls Noida Escorts 9999965857 henakhan
 
VIP Kolkata Call Girl Entally 👉 8250192130 Available With Room
VIP Kolkata Call Girl Entally 👉 8250192130  Available With RoomVIP Kolkata Call Girl Entally 👉 8250192130  Available With Room
VIP Kolkata Call Girl Entally 👉 8250192130 Available With Room
 
Call Girls In South Delhi 📱 9999965857 🤩 Delhi 🫦 HOT AND SEXY VVIP 🍎 SERVICE
Call Girls In South Delhi 📱  9999965857  🤩 Delhi 🫦 HOT AND SEXY VVIP 🍎 SERVICECall Girls In South Delhi 📱  9999965857  🤩 Delhi 🫦 HOT AND SEXY VVIP 🍎 SERVICE
Call Girls In South Delhi 📱 9999965857 🤩 Delhi 🫦 HOT AND SEXY VVIP 🍎 SERVICE
 

Barnes Group Investor Overview

  • 2. -2- This presentation contains forward-looking statements. Forward- looking statements are made based upon management's good faith expectations and beliefs concerning future developments and their potential effect upon the Company. These forward-looking statements are subject to risks and uncertainties that may cause actual results to differ materially from those expressed in the forward-looking statements, including the risks and uncertainties set forth under our full disclosure located at the end of this presentation and included in our SEC filings. The Company assumes no obligation to update our forward-looking statements. References to adjusted financial results are non-GAAP measures. You will find a GAAP reconciliation table at the end of this presentation. Safe Harbor Statement
  • 3. 2013 Completes Divestiture of Acquires Barnes Group Overview -3- 1857 Wallace Barnes founds company in Bristol, CT making springs for hoop skirts and clocks 1923 Associated Spring formed 1946 Associated Spring stock is offered OTC 1963 Associated Spring is listed on NYSE 1968 Sales pass $100M 1976 Name changes to Barnes Group Inc. 1953 Sales pass $50M 1982 Barnes Aerospace formed 2005 Sales pass $1B 1990 Aero Expands in Singapore 2007 BGI celebrates its 150th anniversary 2002 Acquires 1999 Acquires 1989 Sales pass $500M 2006 Acquires 2012 Acquires • An International Industrial and Aerospace Manufacturer and Services Provider, Serving a Wide Range of End Markets and Customers • Two Global Business Segments: Industrial & Aerospace • HQ in Bristol, CT with Global Operations in 60+ Locations; ~ 4,500 Employees • 81 Consecutive Years of Paying a Dividend A Long History … Significant Recent Transformation
  • 4. -4- Highly Engineered Products and Innovative Solutions Note: % Sales from Continuing Operations for the year ended December 31, 2014 Americas 56% 2014 Segment Contribution Aero OEM 28% Aero Aftermarket 10% Aerospace $440M 35% Sales – $1,262M Industrial $822M 65% Industrial $123M 14.9% Aerospace $71M 16.3% Adjusted Operating Profit & Margin $194M, 15.4%
  • 5. -5- Global, Diversified End Markets Note: % Sales from Continuing Operations for the year ended December 31, 2014 End Markets Transportation 32% Industrial 33% Europe 28% Asia 17% Geography Americas 55% 2014 Sales by End Markets & Geography Aero OEM 26% Aero Aftermarket 9%
  • 6. -6- Drive Sustainable Profitable Growth Strategic Themes • Seek Portfolio Enhancements to Drive Shareholder Value • Build On Intellectual Property (IP) as Core Differentiator • Choose End-Markets with Long Term Sustainable, Profitable Growth • Target Cyclical Moderation – Multiple Platforms / Market Channels • Expand Global Footprint / Access • Enhance Barnes Enterprise System • Invigorate Employee Development, Empowerment and Engagement
  • 7. -7- 5% 15.4% High Teens Avg. 2001-2005 2014 Expectation Holding Company Approach Aligned Portfolio Note: 2001 to 2005 Average Operating Margin adjusted for the impact of accounting changes to be comparable to 2014. 2014 Adjusted Operating Margin from Continuing Operations. See GAAP reconciliation table at the end of this presentation. Today’s Priorities • Differentiated Products and Processes • Organic Investment in Growth Platforms • Strategic Acquisitions • Leverage Commercial Aerospace • Extend Global Reach • BES Next Generation • Talent Development Executing Our Strategy to Deliver Improved Margin Performance Driving Operating Margin Expansion
  • 8. What Is BES? BES is a Fully Integrated Operating System that: • Promotes a Culture of Employee Engagement and Empowerment Reflecting our Strong Corporate Values • Ensures Alignment Across the Organization Around a Common Vision • Fosters Continuous Improvement and Innovation in all of our Business Processes • Achieves Results that Drive Sustainable Profitable Growth BES is One of Our Greatest Competitive Advantages -8-
  • 9. -9- Disciplined Capital Allocation $37 $38 $57 $57 ~$55 to $60 $37 $34 $34 $42 ~$40 2011 2012 2013 2014 2015F CapEx Depreciation CapEx and Depreciation ($ in Millions) Drive Organic Growth • 2015F CapEx Range $55 to $60M • About Half Targeted to Growth Programs Strategic Portfolio Transformation • Target Highly Engineered Products & Services • Expand Global Reach / Channel Penetration Generate Shareholder Returns • Continue to Pay a Competitive Dividend  Annualized Dividend Increased 9% in 2014 • Opportunistic Share Repurchase  Primarily to Offset Dilution of Equity-Based Compensation Capital Allocation M&A $607 47% CapEx $218 17% Working Capital $120 9% Share Repo $158 12% CRP $87 7% Dividends $105 8% Uses of Cash 2010 to 2014 ($ in Millions) 20% Returned Directly to Shareholders
  • 10. Portfolio Evolution Year Sales Divestitures Europe 2011 $105 N. America 2013 $300 Acquisitions 2012 $160 2013 $110 ($ in millions, ~ annual sales at time of transaction) M&A Transactions 2010 Sales Mix (1) Industrial 36% Aerospace 32% Distribution 32% 2014 Sales Mix Industrial 65% Aerospace 35% Sales (1) $1,133M Op. Inc. $ (1) $86.5 Op. Margin (1) 7.6% Share Price (2) $20.67 Market Cap (2) $1.1B Sales $1,262M +11% Adj. Op. Inc. $ $194.5 +125% Adj. Op. Margin 15.4% +780 bps Share Price (2) $37.01 +79% Market Cap (2) $2.0B +82% Portfolio Transformation Well Underway -10- (1) 2010 Sales, Operating Income and Operating Margin are “as reported” in the Company’s 2010 10-K. 2010 Sales Mix re-calculated to reflect three segments – Aerospace, Industrial & Distribution vs the original two reported segments of Precision Components & Logistics and Manufacturing Services. (2) Share Price and Market Cap as of December 31, 2010 and 2014, respectively.
  • 11. -11- • Leading Global Manufacturer of Highly-Engineered, High-Quality, Precision Components • Focused on Custom Components and Solutions Employing Differentiated Industrial Technologies • Value Added Engineering: Research, Design, Manufacturing, Testing and Evaluation Industrial – Market Environment Favorable Industrial End-Markets TransportationGeneral Industrial • Advanced Technologies to Meet Fuel Efficiency Requirements • Highly-Engineered, Precision Components; Penetration Rates Exceed Market Growth • Global Light Vehicle Production Forecasted to Increase … +2% to 3% in 2015, +3% to 4% in 2016 & 2017 (IHS Automotive-Mar’15) Barnes Group Participation Light Vehicles – Plastics Light Vehicles – Metals Gas Direct Injection (GDi) 8 to 10 Speed Transmissions • Emerging Market Expansion – Growing with our Customers • Healthcare Requirements of an Aging Population • Markit Manufacturing PMIs for March 2015 … US 55.7, Eurozone 52.2, Emerging Markets 50.1, Global 51.8 Barnes Group Participation Manufacturing Expansion Benefiting Tool & Die Market Healthcare for an Aging Population China Expansion Global Expansion
  • 12. -12- Aerospace Provides Superior Technology-Based Manufacturing Solutions and Comprehensive Component Overhaul and Repair Services to the World’s Major Jet Engine Manufacturers, Commercial Airlines and Military Customers Aerospace – Market Environment Original Equipment Mfg. Aftermarket • Airbus & Boeing Experienced Strong Order Intake in ‘13 & ‘14 • Airbus & Boeing Backlog at Levels Equivalent to >8 Years of 2015 Estimated Production • Strong Commercial Aircraft Deliveries Forecasted Over Next Several Years; 787 & A350 Ramping, 777 in Transition • Low Oil Prices May Accelerate Spend on Deferred Maintenance • Older Aircraft May See Greater Utilization • Global Airline Traffic Growth Remains Solid • Global Airline Profitability Strong and Growing • CFM56 Fleet Size and Shop Visits Expected to Grow; Fleet Size to Peak in 2018, Shop Visits to Peak in 2022 Benefiting RSPs and CRPs 0 500 1,000 1,500 2,000 2014 2015E 2016E 2017E 2018E 2019E Wide-body Narrow-body Aircraft Deliveries (Units) Sources: RBC Est. as of April 2015 Well-Positioned in Aerospace End-Markets
  • 13. -13- • Provides Highly Engineered Machined and Fabricated Components Using Super-alloys • Concurrent Engineering & NPI Capabilities Deliver Value • OEM-Source Approved for Rolls Royce, SNECMA, GE and Pratt & Whitney Engines • FAA/EASA/CAAC Certified Engine Component Repair Stations • Component Repair Programs (CRPs) • Revenue Sharing Programs (RSPs) • Selected Aftermarket Spare Parts for CFM56 and CF6 Engines Maintenance, Repair & Overhaul Spare Parts Aerospace Businesses (with 2014 Segment Sales Contribution) Note: FAA is the U.S. Federal Aviation Administration, EASA is the European Aviation Safety Agency, and CAAC is the Civil Aviation Administration of China 75% 25% Barnes Aerospace OEM Barnes Aerospace Aftermarket
  • 14. Barnes Aftermarket RSPs and CRPs 2.43 2.45 2.49 2.57 2.77 2.8919.6 21.0 22.3 23.4 24.2 24.5 0 5 10 15 20 25 1.0 1.5 2.0 2.5 3.0 2013 2014 2015 2016 2017 2018 FleetSize(000s) EstimatedShopVisits(000s) CFM56 Family of Engines Shop Visits Fleet Size 0.96 0.90 0.83 0.85 0.82 0.78 3.8 3.7 3.5 3.3 3.0 2.9 0 1 2 3 4 0.4 0.6 0.8 1.0 2013 2014 2015 2016 2017 2018 FleetSize(000s) EstimatedShopVisits(000s) CF6 Family of Engines Shop Visits Fleet Size Revenue Sharing Programs (RSPs)  Exclusive Rights to Supply Certain Aftermarket Spare Parts to General Electric (GE)  Covers Life of CFM56 & CF6 Engines Programs  13 Agreements, Entered Between 2003 - 2007  Investment of $294M, Amortized as a Reduction of Sales  Quarterly Net Sales Can Vary Due to Inventory Management, Mix of Engines, Scope of Engine Repair, and Surplus Material for these High Margin Programs Component Repair Programs (CRPs)  Provides Licensing Rights from GE for Repair Services of Certain Critical Components which Improve Overall Engine Efficiency  Covers Life of CFM56 & CF6 Engine Programs  Allows Access to Serve Global Market as OEM Certified Repair Service  2 Agreements, Entered Between 2013 - 2014  Investment of $107M, Amortized as a Reduction of Sales  Expands Margin Profile of Aftermarket MRO Business Sources: Shop Visit Forecast- ICF Aug’13 for 2013; ICF May’14 for 2014-2018; Fleet Size-Aviation Week CAMRO 2013 Programs Allow Barnes Aerospace to Participate in OEM Certified Aftermarket Business -14-
  • 15. -15- (1) Our 2014 full-year guidance is only as of our April 24, 2015 earnings call, and it is not being updated or affirmed at this time. (2) References to adjusted operating margin and adjusted EPS for 2012, 2013, 2014 and 2015 are non-GAAP measures. For a reconciliation to the appropriate GAAP measure, see the Appendix of this presentation. (3) The Company defines free cash flow as net cash provided by operating activities less capital expenditures. Cash Conversion is equal to Net Cash Provided by Operating Activities less Capital Expenditures divided by Net Income (2011 excludes the loss on sale of Barnes Distribution Europe; the Company has excluded the income tax payments related to the gain on the sale of BDNA made during 2013 and the utilization of the related year-end 2013 income tax receivable to offset 2014 payments from free cash flow and the gain on the sale of BDNA from net income.) (4) All previously reported financial information, except for Free Cash Flow, has been adjusted on a retrospective basis to reflect discontinued operations. $865 $929 $1,092 $1,262 +1% to +3% Growth; +6% to +8% Organic 2011 2012 2013 2014 2015F Net Sales (Continuing Operations, $ in Millions) $1.34 $1.52 $1.83 $2.34 $2.45 to $2.60 2011 2012 2013 2014 2015F Adjusted EPS (2) (Continuing Operations) 11.7% 12.2% 12.9% 15.4% 16% to 17% 2011 2012 2013 2014 2015F Adj. Operating Margins (2) (Continuing Operations) $84 $99 $83 $117 $136 to $144 2011 2012 2013 2014 2015F Free Cash Flow (3) ($ in Millions) 92% 104% 110% 99% Cash Conversion: ~100% +5% to 11% Financial Performance Trends (1,4)
  • 16. -16-  Global Industrial Products and Services; Expanding Auto Production  Commercial Aerospace; Strong OEM, Aftermarket Recovering  Demonstrated Margin Expansion; Further Expansion Planned  Benefiting from Barnes Enterprise System  Strong Cash Generator; Solid Balance Sheet  Expanding Differentiated Systems, Products and Processes  Disciplined Acquisitions and Strategic Investments  Focused on Sustainable, Long-Term Profitable Growth Well Positioned Businesses Strong Financial Performance Strategy Execution Delivering Results Why Invest In Barnes Group?
  • 18. -18- Industrial Businesses (with 2014 Sales Contribution) Manufacturer of Hot Runner Systems and Components with a Focus on Providing High Quality Products and Value Added Services Growth Drivers: • Expand Automotive Offerings • Increase Premium Consumer and Electronics Penetration End Markets: • Automotive Exterior and Interior Components • General Industrial • Telecom and Electronic Components Specializes in the Development and Manufacture of High-Precision Molds and Hot Runner Systems Growth Drivers: • Capacity Expansion • Expand Globally End Markets: • Medical / Pharmaceutical • Personal Care • Packaging • Electronic Components Manufacturer of Nitrogen Gas Springs and Hydraulic Systems for Automotive Stamping Dies and Demanding Vehicle and Industrial Applications Growth Drivers: • Expand Tool & Die Offerings • Extend Machine & Vehicle Offerings End Markets: • Industrial Equipment for Transportation, HVAC, Electronics, Whitegoods and Sheet Metal Stamping 23% 16% 15%
  • 19. -19- Industrial Businesses (Continued) (with 2014 Segment Sales Contribution) Pioneer, Leader & Innovator in Engineered Spring & Precision Metal Component Manufacturing Growth Drivers: • Advanced Transmission Offerings • Differentiated Product Growth End Markets: • Light Vehicle • General Industrial • Household / Whitegoods • Other Transportation Progressive Stamping, Micro- Stamping, Fine Blanking and Forming from Prototype Building to Complete Assemblies Growth Drivers: • Deliver Automotive GDi (Gas Direct Injection) • Develop Adjacent Markets, such as Medical End Markets: • Light Vehicle • General Industrial Develops and Produces a Comprehensive Range of Retaining Rings, Fasteners, Snap Rings and Shims Growth Drivers: • Expand Globally • Enhance Product Offerings End Markets: • Light Vehicle • General Industrial 32% 6% 8%
  • 20. -20- Shaft Nuts & Gears Engine Cases Retainer Rings Rotating Air Ducts HP and LP Shrouds, Hangers and Segments, Machined & Fabricated Turbine Exhaust Cases, Cones, Cylinders and Fairings Combustor Components Rotating Air/Oil Seals, Vane Rings, Lever Arms Stub Shafts Struts ManifoldsBearing Housings Tube and Duct Assemblies Vane Actuation Rings, Lever Arms Barnes Aerospace Components
  • 21. -21- Out of Production: JT-9D (DC10,B747,B767,A310) JT-8D (DC9,MD80,B727,B737) PW2000 (B757) CF6-6 (DC10) CF6-50 (A300) Trent 500 (A340) Trent 800 (B777) Development: Leap A,B,C (A320Neo,B737Max,C919) GE9X (B777X) PW1000 GTF (Cseries, E Jets, MRJ) Passport (Global 7000/8000) Trent 7000 (A330Neo) Silvercrest (Dassault, Cessna) DEV. EARLY PROD. PRODUCT MATURITY SPARES PRODUCTION VOLUME TIME COST OUT OF PRODUCTION SPARES NEW EMERGING & EARLY LIFE CYCLE PROGRAMS Mature: CFM56 (B737, A320) CF6-80E (A330) CF34-3/8 (CRJ, E175) CF34-10E (E195) AE3000 (Embraer, Cessna) V2500 (A320) PW4000(B767) Trent700 (A330) Trent900 (A380) GP7200 (A380) GE90-115B (B777) Early Production: GENX-1B (B787) GENX-2B (B747) Trent 1000 (B787) Trent XWB (A350) Participation Throughout The Product Life Cycle Commercial Aircraft Engine Product Life Cycle
  • 22. Appendix: Non-GAAP Financial Measure Reconciliation ($ in Thousands, except per share data) -22- 2014 2013 2012 (1) SEGMENT RESULTS Operating Profit - Industrial Segment (GAAP) 108,360$ 71,888$ 49,253$ Synventive short-term purchase accounting adjustments - - 4,987 Synventive acquisition transaction costs - - 912 Männer short-term purchase accounting adjustments 8,504 5,456 - Männer acquisition transaction costs - 1,823 - Restructuring Charges 6,020 - - CEO transition costs - 6,589 - Operating Profit - Industrial Segment as adjusted (Non-GAAP) (2) 122,884$ 85,756$ 55,152$ Operating Margin - Industrial Segment (GAAP) 13.2% 10.5% 9.1% Operating Margin - Industrial Segment as adjusted (Non-GAAP) (2) 14.9% 12.5% 10.2% Operating Profit - Aerospace Segment (GAAP) 71,614$ 51,313$ 57,878$ CEO transition costs - 3,903 - Operating Profit - Aerospace Segment as adjusted (Non-GAAP) (2) 71,614$ 55,216$ 57,878$ Operating Margin - Aerospace Segment (GAAP) 16.3% 12.7% 14.8% Operating Margin - Aerospace Segment as adjusted (Non-GAAP) (2) 16.3% 13.7% 14.8% CONSOLIDATED RESULTS Operating Income (GAAP) 179,974$ 123,201$ 107,131$ Synventive short-term purchase accounting adjustments - - 4,987 Synventive acquisition transaction costs - - 912 Männer short-term purchase accounting adjustments 8,504 5,456 - Männer acquisition transaction costs - 1,823 - Restructuring Charges 6,020 - - CEO transition costs - 10,492 - Operating Income as adjusted (Non-GAAP) (2) 194,498$ 140,972$ 113,030$ Operating Margin (GAAP) 14.3% 11.3% 11.5% Operating Margin as adjusted (Non-GAAP) (2) 15.4% 12.9% 12.2% Diluted Income from Continuing Operations per Share (GAAP) 2.16$ 1.31$ 1.44$ Synventive short-term purchase accounting adjustments - - 0.07 Synventive acquisition transaction costs - - 0.01 Männer short-term purchase accounting adjustments 0.11 0.07 - Männer acquisition transaction costs - 0.03 - Restructuring Charges 0.07 - - CEO transition costs - 0.12 - April 2013 tax court decision - 0.30 - Diluted Income from Continuing Operations per Share as adjusted (Non-GAAP) (2) 2.34$ 1.83$ 1.52$ Diluted Income from Continuing Operations per Share (GAAP) 2.43$ to 2.58$ Männer short-term purchase accounting adjustments 0.02 Diluted Income from Continuing Operations per Share as adjusted (Non-GAAP) (2) 2.45$ to 2.60$ Twelve months ended December 31, Full-Year 2015 Outlook Notes: (1) Results for 2012 have been adjusted on a retrospective basis to reflect the impact of the BDNA discontinued operations, including a reallocation of corporate overhead expenses, and the segment realignment. (2) The Company has excluded the following from its "as adjusted" financial measurements: 1) short-term purchase accounting adjustments and transaction costs related to its Synventive acquisition in 2012, 2) short-term purchase accounting adjustments and transaction costs related to its Männer acquisition in 2013, 2014 and 2015, 3) restructuring charges related to the closure of production operations at the Company’s Associated Spring facility located in Saline, Michigan in 2014 , 4) CEO transition costs associated with the modification of outstanding equity awards in 2013, and 5) the tax charge associated with the April 2013 tax court decision in 2013. Management believes that these adjustments provide the Company and its investors with an indication of our baseline performance excluding items that are not considered to be reflective of our ongoing results. Management does not intend results excluding the adjustments to represent results as defined by GAAP, and the reader should not consider it as an alternative measurement calculated in accordance with GAAP, or as an indicator of the Company's performance. Accordingly, the measurements have limitations depending on their use. As Barnes Group does not predict special items that may occur in the future, and because our outlook is developed at a level of detail different than that used to prepare GAAP-based financial measures, we do not provide reconciliations to GAAP of our forward-looking financial measures.
  • 23. -23- Safe Harbor Statement This presentation contains forward-looking statements as defined in the Private Securities Litigation Reform Act of 1995. Forward-looking statements often address our expected future operating and financial performance and financial condition, and often contain words such as "anticipate," "believe," "expect," "plan," "strategy," "estimate," "project," and similar terms. These forward-looking statements do not constitute guarantees of future performance and are subject to a variety of risks and uncertainties that may cause actual results to differ materially from those expressed in the forward-looking statements. These include, among others: difficulty maintaining relationships with employees, including unionized employees, customers, distributors, suppliers, business partners or governmental entities; failure to successfully negotiate collective bargaining agreements or potential strikes, work stoppages or other similar events; difficulties leveraging market opportunities; changes in market demand for our products and services; rapid technological and market change; the ability to protect intellectual property rights; introduction or development of new products or transfer of work; higher risks in international operations and markets; the impact of intense competition; and other risks and uncertainties described in documents filed with or furnished to the Securities and Exchange Commission ("SEC") by the Company, including, among others, uncertainties relating to conditions in financial markets; currency fluctuations and foreign currency exposure; future financial performance of the industries or customers that we serve; our dependence upon revenues and earnings from a small number of significant customers; a major loss of customers; inability to realize expected sales or profits from existing backlog due to a range of factors, including insourcing decisions, material changes, production schedules and volumes of specific programs; the impact of government budget and funding decisions; changes in raw material or product prices and availability; integration of acquired businesses; restructuring costs or savings; the continuing impact of prior acquisitions and divestitures and any other future strategic actions, including acquisitions, joint ventures, divestitures, restructurings, or strategic business realignments, and our ability to achieve the financial and operational targets set in connection with any such actions; the outcome of pending and future legal, governmental, or regulatory proceedings and contingencies and uninsured claims; future repurchases of common stock; future levels of indebtedness; and numerous other matters of a global, regional or national scale, including those of a political, economic, business, competitive, environmental, regulatory and public health nature. The Company assumes no obligation to update our forward-looking statements.
  • 24. 24