More Related Content
Similar to yrc worldwide1Q08_Stats
Similar to yrc worldwide1Q08_Stats (20)
yrc worldwide1Q08_Stats
- 1. YRC Worldwide Inc.
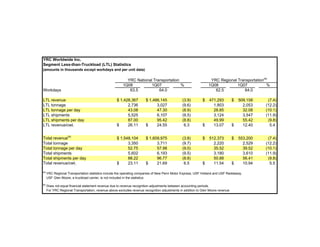
Segment Less-than-Truckload (LTL) Statistics
(amounts in thousands except workdays and per unit data)
YRC Regional Transportation(a)
YRC National Transportation
1Q08 1Q07 % 1Q08 1Q07 %
Workdays 63.5 64.0 62.5 64.0
LTL revenue $ 1,428,367 $ 1,486,145 (3.9) $ 471,293 $ 509,158 (7.4)
LTL tonnage 2,736 3,027 (9.6) 1,803 2,053 (12.2)
LTL tonnage per day 43.08 47.30 (8.9) 28.85 32.08 (10.1)
LTL shipments 5,525 6,107 (9.5) 3,124 3,547 (11.9)
LTL shipments per day 87.00 95.42 (8.8) 49.99 55.42 (9.8)
LTL revenue/cwt. $ 26.11 $ 24.55 6.3 $ 13.07 $ 12.40 5.4
Total revenue(b) $ 1,548,104 $ 1,609,975 (3.8) $ 512,373 $ 553,200 (7.4)
Total tonnage 3,350 3,711 (9.7) 2,220 2,529 (12.2)
Total tonnage per day 52.75 57.98 (9.0) 35.52 39.52 (10.1)
Total shipments 5,602 6,193 (9.5) 3,180 3,610 (11.9)
Total shipments per day 88.22 96.77 (8.8) 50.88 56.41 (9.8)
Total revenue/cwt. $ 23.11 $ 21.69 6.5 $ 11.54 $ 10.94 5.5
(a)
YRC Regional Transportation statistics include the operating companies of New Penn Motor Express, USF Holland and USF Reddaway.
USF Glen Moore, a truckload carrier, is not included in the statistics.
(b)
Does not equal financial statement revenue due to revenue recognition adjustments between accounting periods.
For YRC Regional Transportation, revenue above excludes revenue recognition adjustments in addition to Glen Moore revenue.