More Related Content
Similar to yrc worldwide3Q08_Stats
Similar to yrc worldwide3Q08_Stats (20)
yrc worldwide3Q08_Stats
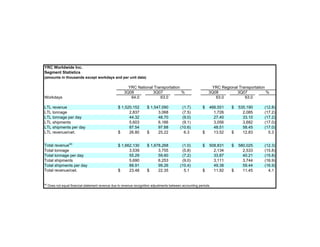
- 1. YRC Worldwide Inc.
Segment Statistics
(amounts in thousands except workdays and per unit data)
YRC National Transportation YRC Regional Transportation
3Q08 3Q07 % 3Q08 3Q07 %
Workdays 64.0 63.0 63.0 63.0
LTL revenue $ 1,520,152 $ 1,547,090 (1.7) $ 466,551 $ 535,190 (12.8)
LTL tonnage 2,837 3,068 (7.5) 1,726 2,085 (17.2)
LTL tonnage per day 44.32 48.70 (9.0) 27.40 33.10 (17.2)
LTL shipments 5,603 6,166 (9.1) 3,056 3,682 (17.0)
LTL shipments per day 87.54 97.88 (10.6) 48.51 58.45 (17.0)
LTL revenue/cwt. $ 26.80 $ 25.22 6.3 $ 13.52 $ 12.83 5.3
Total revenue(a) $ 1,662,130 $ 1,678,268 (1.0) $ 508,831 $ 580,025 (12.3)
Total tonnage 3,539 3,755 (5.8) 2,134 2,533 (15.8)
Total tonnage per day 55.29 59.60 (7.2) 33.87 40.21 (15.8)
Total shipments 5,690 6,253 (9.0) 3,111 3,744 (16.9)
Total shipments per day 88.91 99.26 (10.4) 49.38 59.44 (16.9)
Total revenue/cwt. $ 23.48 $ 22.35 5.1 $ 11.92 $ 11.45 4.1
(a)
Does not equal financial statement revenue due to revenue recognition adjustments between accounting periods.