Best VIP Call Girls Noida Sector 18 Call Me: 8448380779
yrc worldwide4Q07_Stats
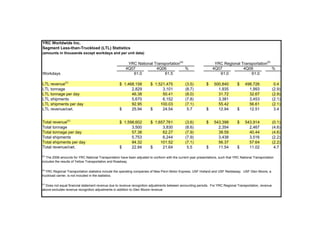
1. YRC Worldwide Inc.
Segment Less-than-Truckload (LTL) Statistics
(amounts in thousands except workdays and per unit data)
YRC National Transportation(a) YRC Regional Transportation(b)
4Q07 4Q06 % 4Q07 4Q06 %
Workdays 61.0 61.5 61.0 61.0
LTL revenue(c) $ 1,468,158 $ 1,521,475 (3.5) $ 500,840 $ 498,726 0.4
LTL tonnage 2,829 3,101 (8.7) 1,935 1,993 (2.9)
LTL tonnage per day 46.38 50.41 (8.0) 31.72 32.67 (2.9)
LTL shipments 5,670 6,152 (7.8) 3,381 3,453 (2.1)
LTL shipments per day 92.95 100.03 (7.1) 55.42 56.61 (2.1)
LTL revenue/cwt. $ 25.94 $ 24.54 5.7 $ 12.94 $ 12.51 3.4
Total revenue(c) $ 1,598,602 $ 1,657,761 (3.6) $ 543,398 $ 543,914 (0.1)
Total tonnage 3,500 3,830 (8.6) 2,354 2,467 (4.6)
Total tonnage per day 57.38 62.27 (7.9) 38.59 40.44 (4.6)
Total shipments 5,753 6,244 (7.9) 3,438 3,516 (2.2)
Total shipments per day 94.32 101.52 (7.1) 56.37 57.64 (2.2)
Total revenue/cwt. $ 22.84 $ 21.64 5.5 $ 11.54 $ 11.02 4.7
(a)
The 2006 amounts for YRC National Transportation have been adjusted to conform with the current year presentations, such that YRC National Transportation
includes the results of Yellow Transportation and Roadway.
(b)
YRC Regional Transportation statistics include the operating companies of New Penn Motor Express, USF Holland and USF Reddaway. USF Glen Moore, a
truckload carrier, is not included in the statistics.
(c)
Does not equal financial statement revenue due to revenue recognition adjustments between accounting periods. For YRC Regional Transportation, revenue
above excludes revenue recognition adjustments in addition to Glen Moore revenue.