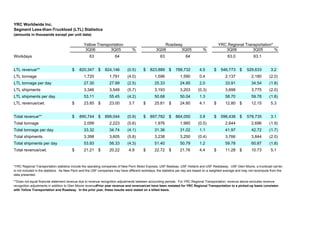
1. YRC Worldwide Inc.
Segment Less-than-Truckload (LTL) Statistics
(amounts in thousands except per unit data)
Yellow Transportation Roadway YRC Regional Transportation*
3Q06 3Q05 % 3Q06 3Q05 % 3Q06 3Q05 %
Workdays 63 64 63 64 63.0 63.1
LTL revenue** $ 820,347 $ 824,146 (0.5) $ 823,889 $ 788,732 4.5 $ 546,773 $ 529,633 3.2
LTL tonnage 1,720 1,791 (4.0) 1,596 1,590 0.4 2,137 2,180 (2.0)
LTL tonnage per day 27.30 27.99 (2.5) 25.33 24.85 2.0 33.91 34.54 (1.8)
LTL shipments 3,346 3,549 (5.7) 3,193 3,203 (0.3) 3,698 3,775 (2.0)
LTL shipments per day 53.11 55.45 (4.2) 50.68 50.04 1.3 58.70 59.78 (1.8)
LTL revenue/cwt. $ 23.85 $ 23.00 3.7 $ 25.81 $ 24.80 4.1 $ 12.80 $ 12.15 5.3
Total revenue** $ 890,744 $ 899,044 (0.9) $ 897,782 $ 864,050 3.9 $ 596,438 $ 578,735 3.1
Total tonnage 2,099 2,223 (5.6) 1,976 1,985 (0.5) 2,644 2,696 (1.9)
Total tonnage per day 33.32 34.74 (4.1) 31.36 31.02 1.1 41.97 42.72 (1.7)
Total shipments 3,398 3,605 (5.8) 3,238 3,250 (0.4) 3,766 3,844 (2.0)
Total shipments per day 53.93 56.33 (4.3) 51.40 50.79 1.2 59.78 60.87 (1.8)
Total revenue/cwt. $ 21.21 $ 20.22 4.9 $ 22.72 $ 21.76 4.4 $ 11.28 $ 10.73 5.1
*YRC Regional Transportation statistics include the operating companies of New Penn Motor Express, USF Bestway, USF Holland and USF Reddaway. USF Glen Moore, a truckload carrier,
is not included in the statistics. As New Penn and the USF companies may have different workdays, the statistics per day are based on a weighted average and may not recompute from the
data presented.
**Does not equal financial statement revenue due to revenue recognition adjustments between accounting periods. For YRC Regional Transportation, revenue above excludes revenue
recognition adjustments in addition to Glen Moore revenue.
Prior year revenue and revenue/cwt have been restated for YRC Regional Transportation to a picked-up basis consistent
with Yellow Transportation and Roadway. In the prior year, these results were stated on a billed basis.