2(˚) d (Å)(I/
I1)*10
0
27.42 3.25 10
31.70 2.82 100
45.54 1.99 60
53.55 1.71 5
56.40 1.63 30
65.70 1.42 20
76.08 1.25 30
84.11 1.15 30
89.94 1.09 5
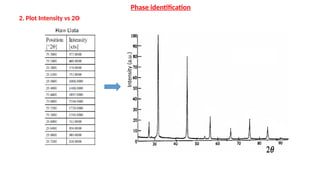
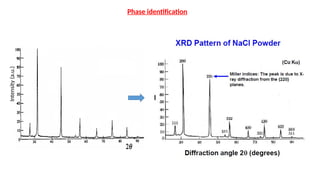
Intensity
(a.u.)
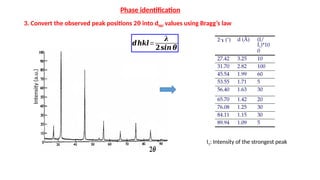
I1: Intensity of the strongest peak
Phase identification
3. Convert the observed peak positions 2θ into dhkl values using Bragg’s law
𝒅𝒉𝒌𝒍=
𝝀
𝟐𝒔𝒊𝒏 𝜽
5.
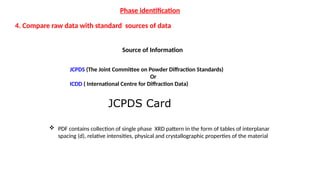
Source of Information
JCPDS(The Joint Committee on Powder Diffraction Standards)
Or
ICDD ( International Centre for Diffraction Data)
JCPDS Card
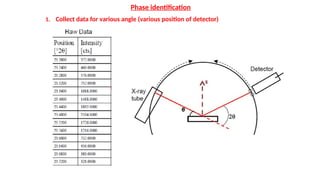
4. Compare raw data with standard sources of data
PDF contains collection of single phase XRD pattern in the form of tables of interplanar
spacing (d), relative intensities, physical and crystallographic properties of the material
Phase identification
6.
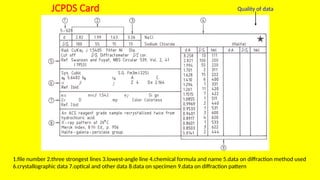
1.file number 2.threestrongest lines 3.lowest-angle line 4.chemical formula and name 5.data on diffraction method used
6.crystallographic data 7.optical and other data 8.data on specimen 9.data on diffraction pattern
Quality of data
JCPDS Card
7.
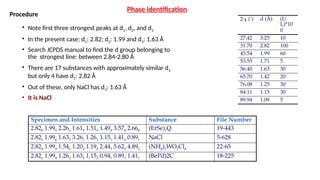
Procedure
• Note firstthree strongest peaks at d1, d2, and d3
• In the present case: d1: 2.82; d2: 1.99 and d3: 1.63 Å
• Search JCPDS manual to find the d group belonging to
the strongest line: between 2.84-2.80 Å
• There are 17 substances with approximately similar d2
but only 4 have d1: 2.82 Å
• Out of these, only NaCl has d3: 1.63 Å
• It is NaCl
Specimen and Intensities Substance File Number
2.829 1.999 2.26x 1.619 1.519 1.499 3.578 2.668 (ErSe)2Q 19-443
2.82x 1.996 1.632 3.261 1.261 1.151 1.411 0.891 NaCl 5-628
2.824 1.994 1.54x 1.204 1.194 2.443 5.622 4.892 (NH4)2WO2Cl4 22-65
2.82x 1.998 1.263 1.632 1.152 0.941 0.891 1.411 (BePd)2C 18-225
2(˚) d (Å) (I/
I1)*10
0
27.42 3.25 10
31.70 2.82 100
45.54 1.99 60
53.55 1.71 5
56.40 1.63 30
65.70 1.42 20
76.08 1.25 30
84.11 1.15 30
89.94 1.09 5
Phase identification