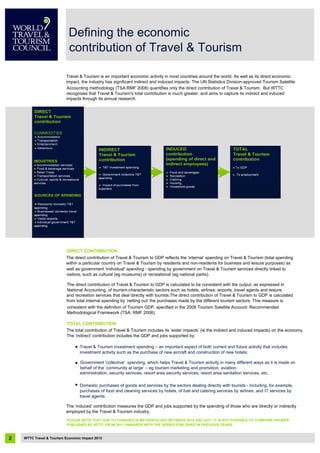
The document provides an economic impact analysis of travel and tourism in St. Vincent and the Grenadines in 2013. Some key points:
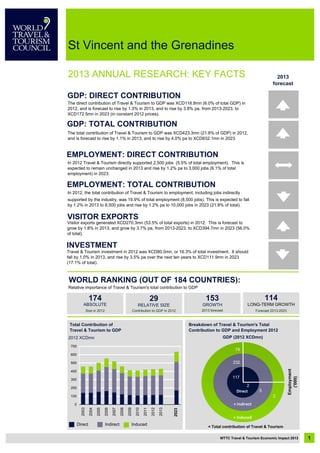
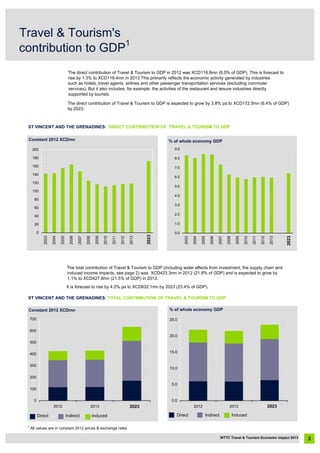
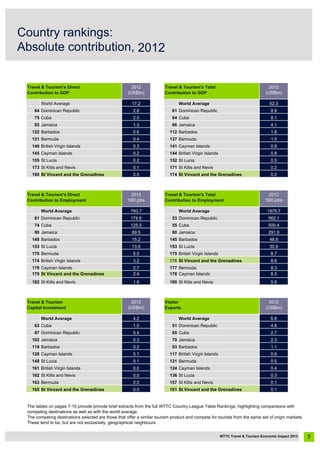
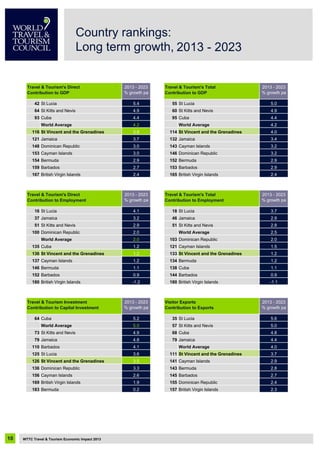
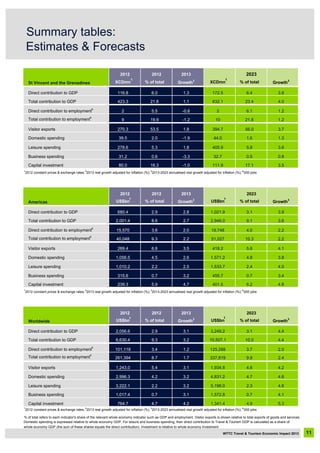
- Travel and tourism directly contributed XCD116.8 million (6%) to GDP in 2012, and is forecast to rise to XCD172.5 million (6.4% of GDP) by 2023.
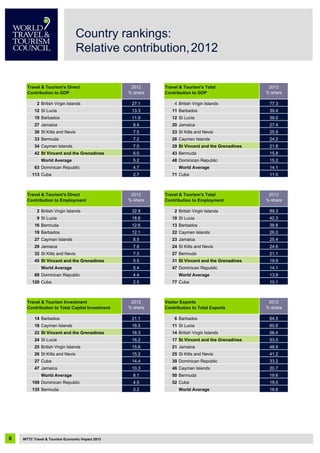
- The total contribution of travel and tourism to GDP was XCD423.3 million (21.8% of GDP) in 2012, and is forecast to rise to XCD632.1 million (23.4% of GDP) by 2023.
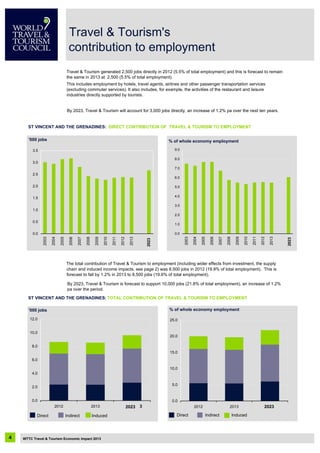
- Travel and tourism directly supported 2,500 jobs (5.5% of total employment)


![Presentation [superscript] sup](https://cdn.slidesharecdn.com/ss_thumbnails/presentationsuperscriptsup-120120143541-phpapp02-thumbnail.jpg?width=640&height=640&fit=bounds)