Download as PDF, PPTX

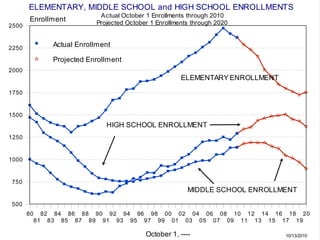
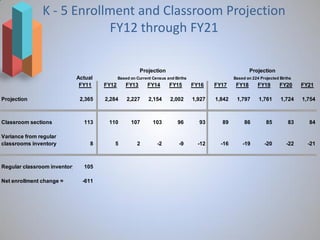
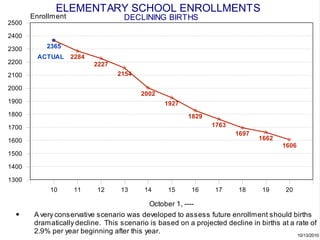
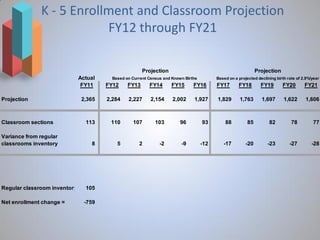
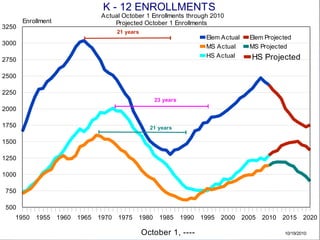
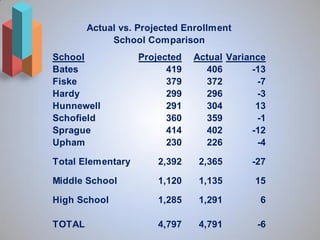
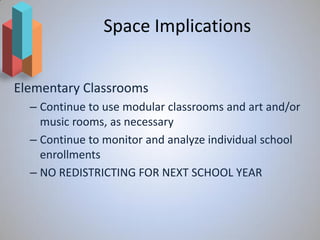
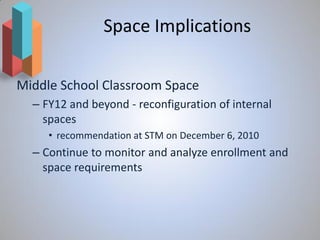
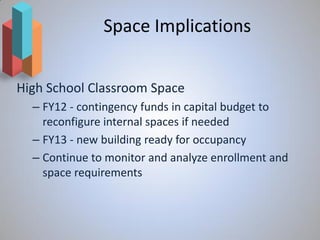


This document provides an enrollment report presented to the School Committee on October 19, 2010. It summarizes actual and projected K-12 enrollments from 1980 to 2020. Key points include: - Elementary enrollment peaked in 2010 and is projected to decline to 1,754 by 2020. - Middle school enrollment is projected to remain steady around 1,120. - High school enrollment is projected to increase slightly to 1,285 by 2020. - Overall K-12 enrollment is projected to decline slightly to 4,797 by 2020 from a high of 4,791 in 2010. - Space implications are that elementary schools will continue to use modular classrooms as needed while monitoring individual school enrollments. The middle school will