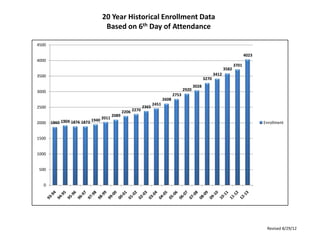
The document contains historical enrollment data for a school district over 20 years. It shows that enrollment steadily increased each year, reaching a high of 4,023 students in the 2012-2013 school year. Breakdowns by building show the highest enrollment was at the high school, and additional data compares the annual increases in enrollment over the past 10 years.
Explore Various Visa Options with MoreVisasAugustinn
Travel Visas are the temporary visas that are issued to the applicants for a limited period of time. It is a non immigrant visa. The visa is valid approximately for 6 months, which may extend or decrease in some cases. Travel Visas does not allows the applicants to stay in abroad for a long time.
Northern Ireland Labour Market Update Issued 14th December 2012
Richard Ramsey
Ulster Bank Chief Economist Northern Ireland
richard.ramsey@ulsterbankcm.com
THIS PRESENTATION WAS CREATED FOR EDUCATION PURPOSE.THE SHARES BOUGHT IN THIS PORTFOLIO ARE BASED ON SOME ANALYSIS.HOWEVER THIS PRESENTATION IS NOT CREATED FOR ANY RECOMMENDATION OF SHARES.
USCIS EB-5 statistics provided for a 5/1/12 stakeholder engagement, including information on service-wide receipts, approvals, and denials of I-526s and I-829s; the number of approved EB5 Regional Centers by fiscal year; I-924 receipts, approvals, and denials; and more.
1. 20 Year Historical Enrollment Data
Based on 6th Day of Attendance
4500
4023
4000
3701
3582
3500 3412
3270
3028
3000 2920
2753
2608
2451
2500 2365
2206 2270
2089
1940 2011
2000 1860 1904 1876 1873 Enrollment
1500
1000
500
0
Revised 8/29/12
2. Student Enrollment by Building – August 29, 2012
Based on 6th Day of Attendance
Total Enrollment: 4,023
DHS 1,225/1710
DVMS 362/450
DMS 569/700
WW 297/445
RES 425/550 Enrollment
HGES 523*/700
DGS 236/350
BES 386/525
0 200 400 600 800 1000 1200 1400
Bold = Current Enrollment; Italics = Building Capacity
*Note: An additional 46 students are housed at Hickory Grove Elementary School in the Pre-K programs
including Bright Futures and ECE that are not reflected in the reported numbers Revised 8/29/12
3. Student Enrollment – Increase from Prior Year
Based on 6th Day of Attendance
350
322
300
250 242
200
167 170
157 # of Students
145 142
150
119
108
100 86
50
0
03-04 04-05 05-06 06-07 07-08 08-09 09-10 10-11 11-12 12-13
*Note: An additional 46 students are housed at Hickory Grove Elementary School in the Pre-K programs
including Bright Futures and ECE that are not reflected in the reported numbers Revised 8/29/12
4. 10 Year Historical Enrollment Data
Based on 6th Day of Attendance
4500
4023
4000
3701
3582
3500 3412
3270
3028
3000 2920
2753
2608
2451
2500
Enrollment
2000
1500
1000
500
0
03-04 04-05 05-06 06-07 07-08 08-09 09-10 10-11 11-12 12-13
Revised 8/29/12