Workshop3 keaittisak
•Download as PPTX, PDF•
0 likes•63 views
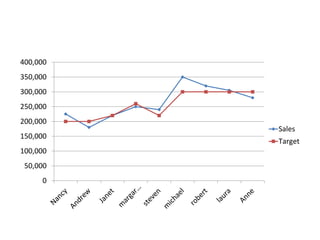
This graph shows sales figures on the y-axis ranging from 0 to 400,000 with a target line at 250,000. The x-axis is unlabeled but implies a time period as sales have increased from 0 to just over 350,000, surpassing the target. Overall it depicts sales over time having increased substantially and surpassed the target level.
Report
Share
Report
Share
Recommended
Workshop3 tippaya
This document contains a simple line graph with sales on the y-axis ranging from 0 to 400,000 and a target line marked at 250,000. The graph shows sales increasing from 0 to just over 300,000, surpassing the target level.
Workshop3_Wipavee
This bar graph shows total sales on the y-axis ranging from 0 to 400,000 with increments of 50,000. There are 8 bars of varying heights with the tallest bar reaching around the 300,000 mark. The word "Target" appears above the graph, indicating this bar graph is displaying sales data compared to a target or goal.
Workshop3 wit
This document contains a line graph with sales data on the y-axis ranging from 0 to 400,000 in increments of 50,000, and a target line is included. The graph shows sales numbers across an unspecified x-axis, and aims to compare actual sales to a set target level.
Workshop3_Siam
This document contains a line graph with sales data on the y-axis ranging from 0 to 400,000 in increments of 50,000, and a target line is included. The graph shows sales figures across an unspecified x-axis.
Workshop 3 rachaya
This bar chart shows sales figures compared to a target across 10 data points. Sales start at 0 and increase by 50,000 each time up to 400,000, while the target remains at 300,000. The sales are below the target for most of the values shown but exceed it at 350,000 and 400,000.
Workshop3 akaraya
This chart shows sales figures ranging from 0 to 400,000 on the y-axis against an unlabeled scale on the x-axis. A line graph depicts sales that increase steadily to around 300,000 but fail to reach the target line.
Workshop3 nitima
This graph shows sales versus a target across 10 data points ranging from 0 to 400,000. The sales numbers are below the target numbers for each data point, indicating that the company's actual sales have not met its targets. Overall, the sales have not reached the targets set by the company across the full range represented in the graph.
Sinong Gustong Maging Milyonaryo
A great review activity in Filipino subject using the tagalized version of Who Wants To be A Millionaire.
Welcome guide espanol
Este documento proporciona instrucciones para usar el sistema de aprendizaje de inglés Effortless English. Recomienda registrarse en los foros, descargar la primera lección y leer las instrucciones. Explica que cada módulo contiene varias clases sobre un mismo tema que deben escucharse juntas durante al menos dos semanas. Describe los diferentes tipos de clases y cómo usarlas de forma relajada para mejorar la fluidez y comprensión del inglés de manera efectiva.
Workshop 3 เบญจพร ม่วงสัมฤทธิ์
This chart shows the sales targets and actual sales for 4 categories over 3 time periods. Category 1 met its sales target for Series 1 but fell short for Series 2 and 3. Category 2 exceeded its target for Series 1 and 2 but missed for Series 3. Category 3 surpassed its target for all 3 series. Category 4 failed to reach its target for any of the series.
Understanding the Nature of Global Business Services in the context of Value ...
What do you need to do, in order to survive and succeed the next outsourcing tsunami. What skills do your leaders and staff need to realise this?
2012 District 5 Community Budget Meeting flyer
The document announces a community budget meeting for District 5 to be held on May 10, 2012 from 6-8pm at the Mayfair Community Center. Mayor Chuck Reed and other city leaders will discuss budget issues, concerns, and priorities for the upcoming 2012-13 fiscal year with Councilmember Xavier Campos hosting. The event is free and open to all District 5 residents with refreshments provided.
Infographie facebook operateurs telecom du Maroc
This single sentence document states that the infographic "INFOGRAPHIE FACEBOOK OPERATEURS TELECOM by MEHDI MD TAZI" is licensed under a Creative Commons Attribution-NonCommercial-NoDerivs 3.0 Unported License.
Question 1.1
My indie rock magazine front cover follows conventions like featuring a large dominant image to catch readers' eyes, includes the magazine name in a large font, and lists the issue number and date as well as quotes and cover lines representing stories inside.
CV + Foto
This curriculum vitae provides personal and professional details of Edward Barkey Mangatas Hutabarat. It includes his name, date and place of birth, contact information, education history, and work experience. For education, it lists that he attended MedanArea University in Medan. His work experience includes several accounting and finance roles, such as Head of Operations for a trucking company from 2006 to 2011 and completing internal audits for another company from 2004 to 2005. It also notes his experience as an auditor for an accounting firm from 2003 to 2004 and working in accounting and finance for a tax consultancy firm from 2001 to 2003.
Plight of the Farmworker - Episcopal Farmworker Ministry
Farmworkers are vital to the United States' agriculture industry by enabling the enjoyment of affordable fresh produce year-round. However, they remain among the lowest paid and least protected workers despite their economic and cultural contributions. Farmwork is physically demanding and seasonal, with migrant workers traveling to follow crops and living in temporary housing. Most farmworkers earn very low wages, have little access to healthcare or social services, and face health risks from pesticide exposure and dangerous working conditions. Children of farmworkers also often experience higher rates of health problems and unstable schooling. Despite their essential role, farmworkers have faced historical exclusion from many federal labor laws intended to protect other workers.
16 17
1) The document discusses teacher education and the integration of information and communication technologies (ICT) into classrooms. It analyzes different levels of ICT integration and their impact on teaching practices and student learning outcomes.
2) While ICT integration is still uneven, studies have found some positive effects, including improved student motivation and engagement. ICT allows for more individualized learning and accommodation of different learning styles. It also enables collaborative learning and access to real-world information.
3) However, changes in teaching practices have generally been superficial, focused on skill-building rather than transforming pedagogy or classroom organization. Barriers include unreliable technology and lack of support for teachers' professional development with ICT. More research is
167
O documento discute três principais pontos: 1) O período que antecede o verão preocupa bombeiros devido ao risco de incêndios; 2) Alunos realizaram prova do Enade sobre educação; 3) Uma nova ferrovia será tema de debate político.
Investors Ally Farjho Flyer
This document describes a new home ownership structure called FARJHOSM that allows homeowners to use their home equity to co-own homes with tenants. It provides three key benefits: 1) it allows owners to only co-own one home at a time to maintain single-family home ownership; 2) it uses member-level rather than property-level debt financing to eliminate the risk of foreclosure; and 3) the tenant's equity stake acts as a buffer against missed rent to provide stability for both tenants and investors.
MS09_Abschlussmeldung.pdf
[PDF] Pressemitteilung: Marketing+Services und Display ziehen positive Bilanz
[http://www.lifepr.de?boxid=109501]
Aa organisational behaviour
This document outlines the modules for a course on organizational behavior. The modules will cover individual psychology and the organization as a social system, models of organizational behavior like work motivation theories and applications, leadership styles and effectiveness theories, group dynamics including structure and effectiveness, power relations, organizational change and development approaches and methods, stress nature and effects, conflicts, and employee counseling approaches. Students will also participate in experiential learning programs and case studies.
Aplicaciones para la gestion de ti
El documento describe aplicaciones para la gestión de TI, incluyendo Project para la gestión de proyectos, SolarWinds para la detección y resolución de problemas de redes, y ManageEngine ServiceDesk Plus como herramienta de mesa de ayuda compatible con ITIL. También describe aplicaciones como IT Service Management para la gestión de servicios de TI, SysAid para la administración de mesas de ayuda y activos móviles, e IP Calculator y Network Mapper para análisis de red.
Sket sound analysis
The document breaks down the elements of a sket sound including dialogue with strong regional accents discussing revenge and violence, urban grime music, and sound effects like gun shots, a flat lining heart monitor, money sounds, and people being attacked.
Paginas Internet(2)
Educadores debatem Tecnologia Digital na Educação. Moradores reclamam do atraso na coleta de lixo no Bairro 5. Empresa realiza ação de beneficência ao Lar Bom Abrigo Solidariedade 12.
More Related Content
Viewers also liked
Welcome guide espanol
Este documento proporciona instrucciones para usar el sistema de aprendizaje de inglés Effortless English. Recomienda registrarse en los foros, descargar la primera lección y leer las instrucciones. Explica que cada módulo contiene varias clases sobre un mismo tema que deben escucharse juntas durante al menos dos semanas. Describe los diferentes tipos de clases y cómo usarlas de forma relajada para mejorar la fluidez y comprensión del inglés de manera efectiva.
Workshop 3 เบญจพร ม่วงสัมฤทธิ์
This chart shows the sales targets and actual sales for 4 categories over 3 time periods. Category 1 met its sales target for Series 1 but fell short for Series 2 and 3. Category 2 exceeded its target for Series 1 and 2 but missed for Series 3. Category 3 surpassed its target for all 3 series. Category 4 failed to reach its target for any of the series.
Understanding the Nature of Global Business Services in the context of Value ...
What do you need to do, in order to survive and succeed the next outsourcing tsunami. What skills do your leaders and staff need to realise this?
2012 District 5 Community Budget Meeting flyer
The document announces a community budget meeting for District 5 to be held on May 10, 2012 from 6-8pm at the Mayfair Community Center. Mayor Chuck Reed and other city leaders will discuss budget issues, concerns, and priorities for the upcoming 2012-13 fiscal year with Councilmember Xavier Campos hosting. The event is free and open to all District 5 residents with refreshments provided.
Infographie facebook operateurs telecom du Maroc
This single sentence document states that the infographic "INFOGRAPHIE FACEBOOK OPERATEURS TELECOM by MEHDI MD TAZI" is licensed under a Creative Commons Attribution-NonCommercial-NoDerivs 3.0 Unported License.
Question 1.1
My indie rock magazine front cover follows conventions like featuring a large dominant image to catch readers' eyes, includes the magazine name in a large font, and lists the issue number and date as well as quotes and cover lines representing stories inside.
CV + Foto
This curriculum vitae provides personal and professional details of Edward Barkey Mangatas Hutabarat. It includes his name, date and place of birth, contact information, education history, and work experience. For education, it lists that he attended MedanArea University in Medan. His work experience includes several accounting and finance roles, such as Head of Operations for a trucking company from 2006 to 2011 and completing internal audits for another company from 2004 to 2005. It also notes his experience as an auditor for an accounting firm from 2003 to 2004 and working in accounting and finance for a tax consultancy firm from 2001 to 2003.
Plight of the Farmworker - Episcopal Farmworker Ministry
Farmworkers are vital to the United States' agriculture industry by enabling the enjoyment of affordable fresh produce year-round. However, they remain among the lowest paid and least protected workers despite their economic and cultural contributions. Farmwork is physically demanding and seasonal, with migrant workers traveling to follow crops and living in temporary housing. Most farmworkers earn very low wages, have little access to healthcare or social services, and face health risks from pesticide exposure and dangerous working conditions. Children of farmworkers also often experience higher rates of health problems and unstable schooling. Despite their essential role, farmworkers have faced historical exclusion from many federal labor laws intended to protect other workers.
16 17
1) The document discusses teacher education and the integration of information and communication technologies (ICT) into classrooms. It analyzes different levels of ICT integration and their impact on teaching practices and student learning outcomes.
2) While ICT integration is still uneven, studies have found some positive effects, including improved student motivation and engagement. ICT allows for more individualized learning and accommodation of different learning styles. It also enables collaborative learning and access to real-world information.
3) However, changes in teaching practices have generally been superficial, focused on skill-building rather than transforming pedagogy or classroom organization. Barriers include unreliable technology and lack of support for teachers' professional development with ICT. More research is
167
O documento discute três principais pontos: 1) O período que antecede o verão preocupa bombeiros devido ao risco de incêndios; 2) Alunos realizaram prova do Enade sobre educação; 3) Uma nova ferrovia será tema de debate político.
Investors Ally Farjho Flyer
This document describes a new home ownership structure called FARJHOSM that allows homeowners to use their home equity to co-own homes with tenants. It provides three key benefits: 1) it allows owners to only co-own one home at a time to maintain single-family home ownership; 2) it uses member-level rather than property-level debt financing to eliminate the risk of foreclosure; and 3) the tenant's equity stake acts as a buffer against missed rent to provide stability for both tenants and investors.
MS09_Abschlussmeldung.pdf
[PDF] Pressemitteilung: Marketing+Services und Display ziehen positive Bilanz
[http://www.lifepr.de?boxid=109501]
Aa organisational behaviour
This document outlines the modules for a course on organizational behavior. The modules will cover individual psychology and the organization as a social system, models of organizational behavior like work motivation theories and applications, leadership styles and effectiveness theories, group dynamics including structure and effectiveness, power relations, organizational change and development approaches and methods, stress nature and effects, conflicts, and employee counseling approaches. Students will also participate in experiential learning programs and case studies.
Aplicaciones para la gestion de ti
El documento describe aplicaciones para la gestión de TI, incluyendo Project para la gestión de proyectos, SolarWinds para la detección y resolución de problemas de redes, y ManageEngine ServiceDesk Plus como herramienta de mesa de ayuda compatible con ITIL. También describe aplicaciones como IT Service Management para la gestión de servicios de TI, SysAid para la administración de mesas de ayuda y activos móviles, e IP Calculator y Network Mapper para análisis de red.
Sket sound analysis
The document breaks down the elements of a sket sound including dialogue with strong regional accents discussing revenge and violence, urban grime music, and sound effects like gun shots, a flat lining heart monitor, money sounds, and people being attacked.
Paginas Internet(2)
Educadores debatem Tecnologia Digital na Educação. Moradores reclamam do atraso na coleta de lixo no Bairro 5. Empresa realiza ação de beneficência ao Lar Bom Abrigo Solidariedade 12.
Viewers also liked (20)
Understanding the Nature of Global Business Services in the context of Value ...
Understanding the Nature of Global Business Services in the context of Value ...
Plight of the Farmworker - Episcopal Farmworker Ministry
Plight of the Farmworker - Episcopal Farmworker Ministry
More from keaittisak17
Workshop2 keaittisak
The document lists the positions and names of people in a new organization for 2016. It includes the positions of MD, Financial Manager, Production Manager, HR Manager, and Marketing Manager. The names listed are Keaittisak Nakaja and Assistance.
Workshop6 keaittisak
This document discusses management skills and lists leadership, power, self-control, socialability, and visionary as important skills. It then provides the name Manee Thana Somsri. In 3 sentences or less, this summarizes the high level information that the document discusses management skills and lists several important ones, and also provides a name.
Workshop6 keaittisak
This document discusses management skills and lists leadership, power, self-control, socialability, and visionary as important skills. It then provides the name Manee Thana Somsri but does not provide any additional context or information about these management skills or the individual named.
Workshop5 keaittisak
This chart shows the monthly sales and margin percentage for an unnamed company over the first 5 months of the year. Sales were highest in March at around $3 million but margins peaked in February at 1.5%. Overall margins declined as sales increased through the early months of the year.
Workshop3 keaittisak
This graph shows sales figures on the y-axis ranging from 0 to 400,000 with a target line at 250,000. The x-axis is unlabeled but implies a time-based scale as sales figures increase from left to right, starting below the target and exceeding the target near the 300,000 mark before leveling off below 400,000.
More from keaittisak17 (12)
Recently uploaded
A Strategic Approach: GenAI in Education
Artificial Intelligence (AI) technologies such as Generative AI, Image Generators and Large Language Models have had a dramatic impact on teaching, learning and assessment over the past 18 months. The most immediate threat AI posed was to Academic Integrity with Higher Education Institutes (HEIs) focusing their efforts on combating the use of GenAI in assessment. Guidelines were developed for staff and students, policies put in place too. Innovative educators have forged paths in the use of Generative AI for teaching, learning and assessments leading to pockets of transformation springing up across HEIs, often with little or no top-down guidance, support or direction.
This Gasta posits a strategic approach to integrating AI into HEIs to prepare staff, students and the curriculum for an evolving world and workplace. We will highlight the advantages of working with these technologies beyond the realm of teaching, learning and assessment by considering prompt engineering skills, industry impact, curriculum changes, and the need for staff upskilling. In contrast, not engaging strategically with Generative AI poses risks, including falling behind peers, missed opportunities and failing to ensure our graduates remain employable. The rapid evolution of AI technologies necessitates a proactive and strategic approach if we are to remain relevant.
Azure Interview Questions and Answers PDF By ScholarHat
Azure Interview Questions and Answers PDF By ScholarHat
Chapter 4 - Islamic Financial Institutions in Malaysia.pptx
Chapter 4 - Islamic Financial Institutions in Malaysia.pptxMohd Adib Abd Muin, Senior Lecturer at Universiti Utara Malaysia
This slide is special for master students (MIBS & MIFB) in UUM. Also useful for readers who are interested in the topic of contemporary Islamic banking.
The History of Stoke Newington Street Names
Presented at the Stoke Newington Literary Festival on 9th June 2024
www.StokeNewingtonHistory.com
CACJapan - GROUP Presentation 1- Wk 4.pdf
Macroeconomics- Movie Location
This will be used as part of your Personal Professional Portfolio once graded.
Objective:
Prepare a presentation or a paper using research, basic comparative analysis, data organization and application of economic information. You will make an informed assessment of an economic climate outside of the United States to accomplish an entertainment industry objective.
Natural birth techniques - Mrs.Akanksha Trivedi Rama University
Natural birth techniques - Mrs.Akanksha Trivedi Rama UniversityAkanksha trivedi rama nursing college kanpur.
Natural birth techniques are various type such as/ water birth , alexender method, hypnosis, bradley method, lamaze method etcIntroduction to AI for Nonprofits with Tapp Network
Dive into the world of AI! Experts Jon Hill and Tareq Monaur will guide you through AI's role in enhancing nonprofit websites and basic marketing strategies, making it easy to understand and apply.
PCOS corelations and management through Ayurveda.
This presentation includes basic of PCOS their pathology and treatment and also Ayurveda correlation of PCOS and Ayurvedic line of treatment mentioned in classics.
Executive Directors Chat Leveraging AI for Diversity, Equity, and Inclusion
Let’s explore the intersection of technology and equity in the final session of our DEI series. Discover how AI tools, like ChatGPT, can be used to support and enhance your nonprofit's DEI initiatives. Participants will gain insights into practical AI applications and get tips for leveraging technology to advance their DEI goals.
How to Fix the Import Error in the Odoo 17
An import error occurs when a program fails to import a module or library, disrupting its execution. In languages like Python, this issue arises when the specified module cannot be found or accessed, hindering the program's functionality. Resolving import errors is crucial for maintaining smooth software operation and uninterrupted development processes.
A Survey of Techniques for Maximizing LLM Performance.pptx
A Survey of Techniques for Maximizing LLM Performance
Top five deadliest dog breeds in America
Thinking of getting a dog? Be aware that breeds like Pit Bulls, Rottweilers, and German Shepherds can be loyal and dangerous. Proper training and socialization are crucial to preventing aggressive behaviors. Ensure safety by understanding their needs and always supervising interactions. Stay safe, and enjoy your furry friends!
বাংলাদেশ অর্থনৈতিক সমীক্ষা (Economic Review) ২০২৪ UJS App.pdf
বাংলাদেশের অর্থনৈতিক সমীক্ষা ২০২৪ [Bangladesh Economic Review 2024 Bangla.pdf] কম্পিউটার , ট্যাব ও স্মার্ট ফোন ভার্সন সহ সম্পূর্ণ বাংলা ই-বুক বা pdf বই " সুচিপত্র ...বুকমার্ক মেনু 🔖 ও হাইপার লিংক মেনু 📝👆 যুক্ত ..
আমাদের সবার জন্য খুব খুব গুরুত্বপূর্ণ একটি বই ..বিসিএস, ব্যাংক, ইউনিভার্সিটি ভর্তি ও যে কোন প্রতিযোগিতা মূলক পরীক্ষার জন্য এর খুব ইম্পরট্যান্ট একটি বিষয় ...তাছাড়া বাংলাদেশের সাম্প্রতিক যে কোন ডাটা বা তথ্য এই বইতে পাবেন ...
তাই একজন নাগরিক হিসাবে এই তথ্য গুলো আপনার জানা প্রয়োজন ...।
বিসিএস ও ব্যাংক এর লিখিত পরীক্ষা ...+এছাড়া মাধ্যমিক ও উচ্চমাধ্যমিকের স্টুডেন্টদের জন্য অনেক কাজে আসবে ...
clinical examination of hip joint (1).pdf
described clinical examination all orthopeadic conditions .
BÀI TẬP BỔ TRỢ TIẾNG ANH 8 CẢ NĂM - GLOBAL SUCCESS - NĂM HỌC 2023-2024 (CÓ FI...
BÀI TẬP BỔ TRỢ TIẾNG ANH 8 CẢ NĂM - GLOBAL SUCCESS - NĂM HỌC 2023-2024 (CÓ FI...Nguyen Thanh Tu Collection
https://app.box.com/s/y977uz6bpd3af4qsebv7r9b7s21935vdRecently uploaded (20)
Azure Interview Questions and Answers PDF By ScholarHat
Azure Interview Questions and Answers PDF By ScholarHat
Chapter 4 - Islamic Financial Institutions in Malaysia.pptx
Chapter 4 - Islamic Financial Institutions in Malaysia.pptx
Film vocab for eal 3 students: Australia the movie
Film vocab for eal 3 students: Australia the movie
Natural birth techniques - Mrs.Akanksha Trivedi Rama University
Natural birth techniques - Mrs.Akanksha Trivedi Rama University
Introduction to AI for Nonprofits with Tapp Network
Introduction to AI for Nonprofits with Tapp Network
Executive Directors Chat Leveraging AI for Diversity, Equity, and Inclusion
Executive Directors Chat Leveraging AI for Diversity, Equity, and Inclusion
A Survey of Techniques for Maximizing LLM Performance.pptx
A Survey of Techniques for Maximizing LLM Performance.pptx
বাংলাদেশ অর্থনৈতিক সমীক্ষা (Economic Review) ২০২৪ UJS App.pdf
বাংলাদেশ অর্থনৈতিক সমীক্ষা (Economic Review) ২০২৪ UJS App.pdf
BÀI TẬP BỔ TRỢ TIẾNG ANH 8 CẢ NĂM - GLOBAL SUCCESS - NĂM HỌC 2023-2024 (CÓ FI...
BÀI TẬP BỔ TRỢ TIẾNG ANH 8 CẢ NĂM - GLOBAL SUCCESS - NĂM HỌC 2023-2024 (CÓ FI...