Downloaded 28 times


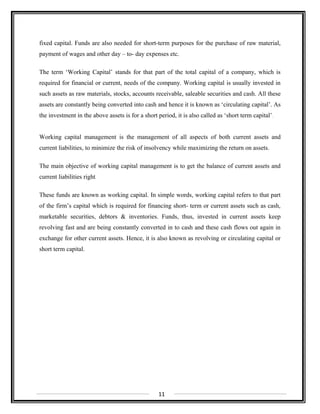

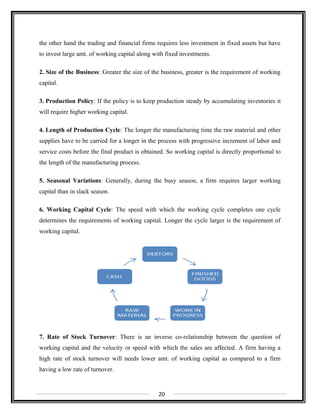

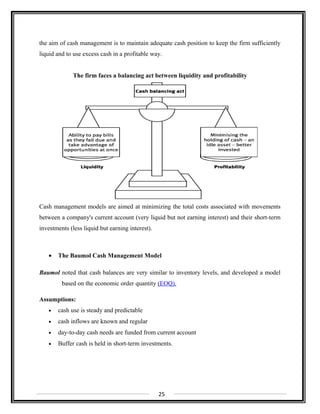

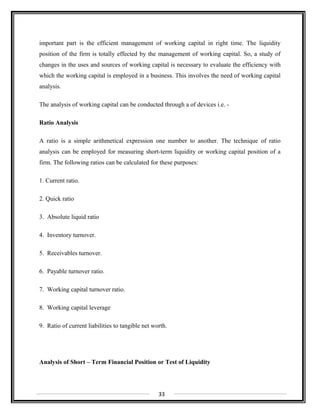
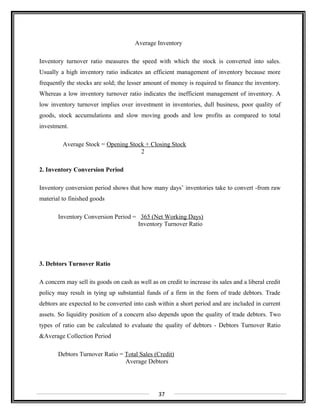
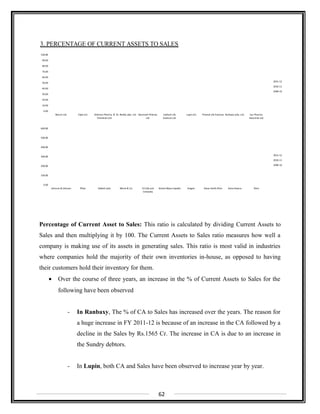
![The lower limit, L is set by management depending upon how much risk of a cash shortfall the
firm is willing to accept, and this, in turn, depend both on access to borrowings and on the
consequences of cash shortfall.
The formulae for the Miller-Orr model are:
Return point = Lower limit + (1/3 × spread)
Spread = 3 [(3/4 × Transaction cost × Variance of cash flows) ÷ Interest rate] 1/3
Note: variance and interest rates should be expressed in daily terms. Variance = standard
deviation squared.
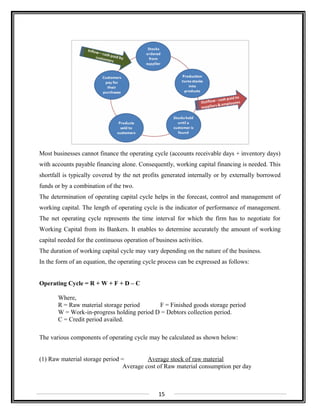
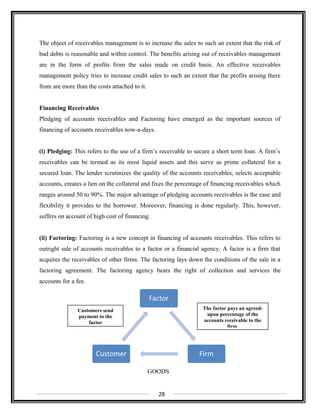
Management of Receivables
Accounts receivable is a permanent investment and an ever rolling account. The finance
manager has to determine the level of this account suitable so that there will be an easy
flow of working capital. The management should see that debtors turn fast, if the debtors
turnover velocity is high then the firm can minimize borrowings for working capital. All this
i.e. maintenance of debtors at optimum level, the degree of credit sales to be made, making the
debtors turn fast, involves the “Accounts Receivables Management.”
27](https://image.slidesharecdn.com/workingcapitalmanagement2-150124234328-conversion-gate02/85/Working-capital-management-of-Jubilant-Life-Sciences-2-27-320.jpg)
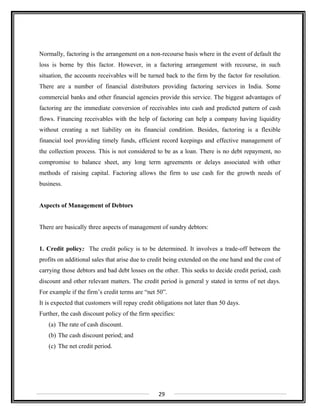

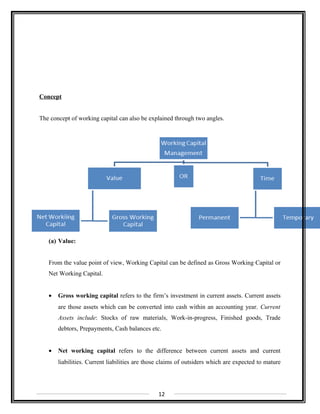
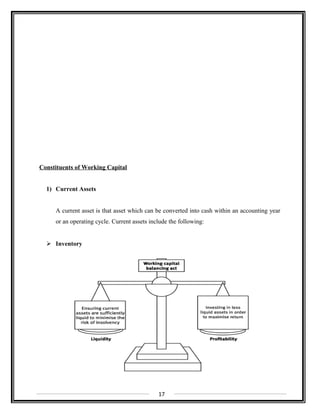
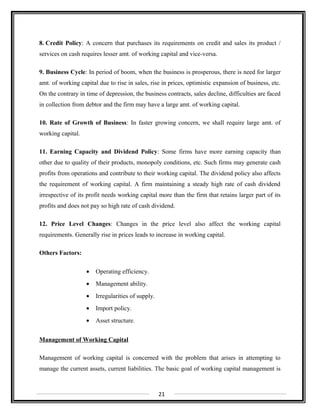
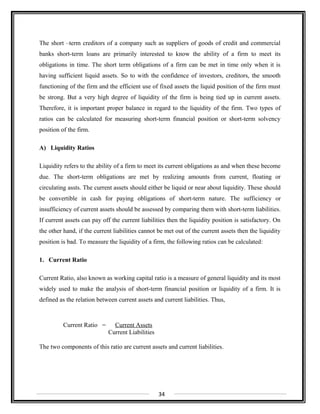
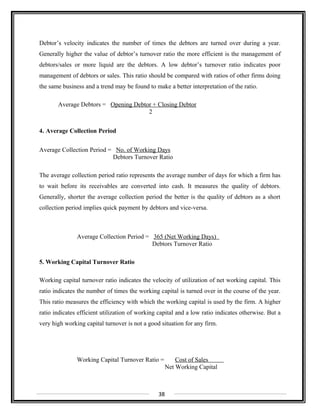
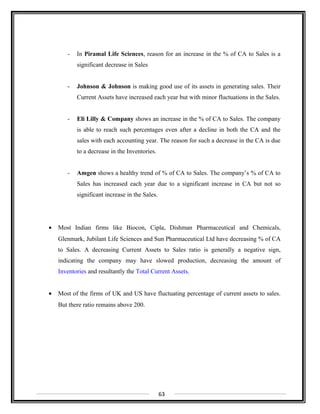
![- Critical to firm’s processes or to those of customers
- Some inventory items do not require great deal of attention (C items)
- Commonplace, easy to obtain
- B items fall between items A & C
- ABC system segregates items by value and places tighter control on higher cost (value)
pieces
• Just In Time (JIT) Inventory System
- Inventory supplied
- At exactly the right time
- In exactly the right quantities
- Theoretically eliminates the need for factory inventory
- Shortens operating cycle
- Reduces costs
- Eliminate wasteful procedures
- But: late delivery can stop factory’s entire production line
- Works best with large manufacturers who are powerful with respect to supplier
- Supplier is willing to do almost anything to keep the manufacturer’s business
• Economic Order Quantity (EOQ) Model
- EOQ model recognizes trade-offs between carrying costs and ordering costs
- Carrying costs increase with amount of inventory held ( from larger orders)
- Ordering costs increase with the number of orders placed (from more orders)
- EOQ minimizes total of sum of ordering and carrying costs
EOQ model is:
1/2
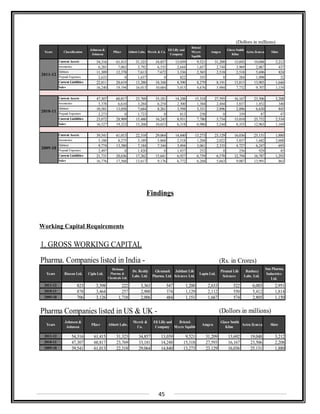
Working Capital Analysis
As we know working capital is the life blood and the center of a business. Adequate amount of
working capital is very much essential for the smooth running of the business. And the most
32
[ ]c
2FD
Q =
Where,
Q= order size in units
D= annual quantity used in units
F= cost of placing one order
C= annual cost of carrying one unit in stock ½ denotes square root](https://image.slidesharecdn.com/workingcapitalmanagement2-150124234328-conversion-gate02/85/Working-capital-management-of-Jubilant-Life-Sciences-2-32-320.jpg)


The document provides information on Jubilant Bhartia Group, an Indian conglomerate valued at over $3 billion with a presence in pharmaceuticals, life sciences, food, oil and gas, agriculture, retail, and consulting services. The group employs over 30,000 people globally and has established partnerships in various businesses. Its core segments include pharmaceuticals and life sciences, agri products, performance polymers and retail, food, oil and gas exploration, and services. Some of its subsidiaries and their operations are also summarized.


![[DSC Europe 25] Paula Garcia Esteban -Building the Future: The Role of Data S...](https://cdn.slidesharecdn.com/ss_thumbnails/9ld1r1bsqpwve8qfvphy-paula-garcia-esteban-building-the-future-260122103838-4171f5cb-thumbnail.jpg?width=640&height=640&fit=bounds)
![[DSC Europe 25] Tali Fulman - Guild Meetings, Then What? Building Data Commun...](https://cdn.slidesharecdn.com/ss_thumbnails/fgohhi33rwmhqdowdj5k-tali-fulman-guild-meetings-then-what-building-data-communities-that-actually-ch-260120105855-528492c3-thumbnail.jpg?width=640&height=640&fit=bounds)
![[DSC Europe 25] Josip Saban - Career building for data professionals.pptx](https://cdn.slidesharecdn.com/ss_thumbnails/zroflcttkm1vmli0txea-josip-saban-career-building-for-data-professionals-260123083019-587cdb8c-thumbnail.jpg?width=640&height=640&fit=bounds)
![[DSC Europe 25] Borko Kozomora - Optimizing business workflows with advances ...](https://cdn.slidesharecdn.com/ss_thumbnails/hbgekyb0txw0xpo4yfml-borko-kozomora-leading-ai-transformation-260122103838-cc29ee38-thumbnail.jpg?width=640&height=640&fit=bounds)

![[DSC Europe 25] Harshvardhan Jain - From Pre-Trained to Purpose-Built: Fine-T...](https://cdn.slidesharecdn.com/ss_thumbnails/zru4zmiseku5tgvu2dgw-harshvardhan-jain-from-pre-trained-to-purpose-built-fine-tuning-llms-for-high-i-260119101520-8335585f-thumbnail.jpg?width=640&height=640&fit=bounds)

![[DSC Europe 25] Milos Belcevic - Product Professional's Journey to Full-Stack...](https://cdn.slidesharecdn.com/ss_thumbnails/1zovd6fgsycdg4wvgvls-milos-belcevic-product-professionals-journey-to-full-stack-product-developer-260123083019-d993120d-thumbnail.jpg?width=640&height=640&fit=bounds)
![[DSC Europe 25] Srdj Stanisic - Local and Private AI in UX.pdf](https://cdn.slidesharecdn.com/ss_thumbnails/vwmetykqmztgmokmmkfa-3-srdjan-stanisic-local-and-small-ai-in-ux-260120105855-55a31869-thumbnail.jpg?width=640&height=640&fit=bounds)
![[DSC Europe 25] Tamas Srancsik - How To Teach Your AI Football? An Argument f...](https://cdn.slidesharecdn.com/ss_thumbnails/bcjh1m9xtbosv20ucftb-tamas-srancsik-how-to-teach-your-ai-football-260121115910-08b53e9e-thumbnail.jpg?width=640&height=640&fit=bounds)
![[DSC Europe 25] Bojan Djuricic - Predictive Design Process.pdf](https://cdn.slidesharecdn.com/ss_thumbnails/5awdrbedqdek3gqu2ezy-4-the-predictive-design-bojan-djuricic-260120105856-6c399e9b-thumbnail.jpg?width=640&height=640&fit=bounds)


![[DSC Europe 25] Jovan Sumarac - Real-World Applications of Computer Vision in...](https://cdn.slidesharecdn.com/ss_thumbnails/fiksms22smcpopvvld03-jovan-sumarac-real-life-applications-of-computer-vision-in-automotive-systems-260120105855-de622abb-thumbnail.jpg?width=640&height=640&fit=bounds)
![[DSC Europe 25] Egor Krasheninnikov - The Control Stack: Building Guardrails ...](https://cdn.slidesharecdn.com/ss_thumbnails/3lzcz7hxqmo51mtalv4u-the-control-stack-260119101520-ea90841a-thumbnail.jpg?width=640&height=640&fit=bounds)


