© Health Catalyst. Confidential and Proprietary.
Why Your Tools Are Failing You:
Implement Augmented Intelligence for
Intentional and Accurate Improvement
© Health Catalyst. Confidential and Proprietary.
Jason Jones, PhD
Chief Analytics & Data Science Officer
& General Manager of Platform
Health Catalyst
© Health Catalyst. Confidential and Proprietary.
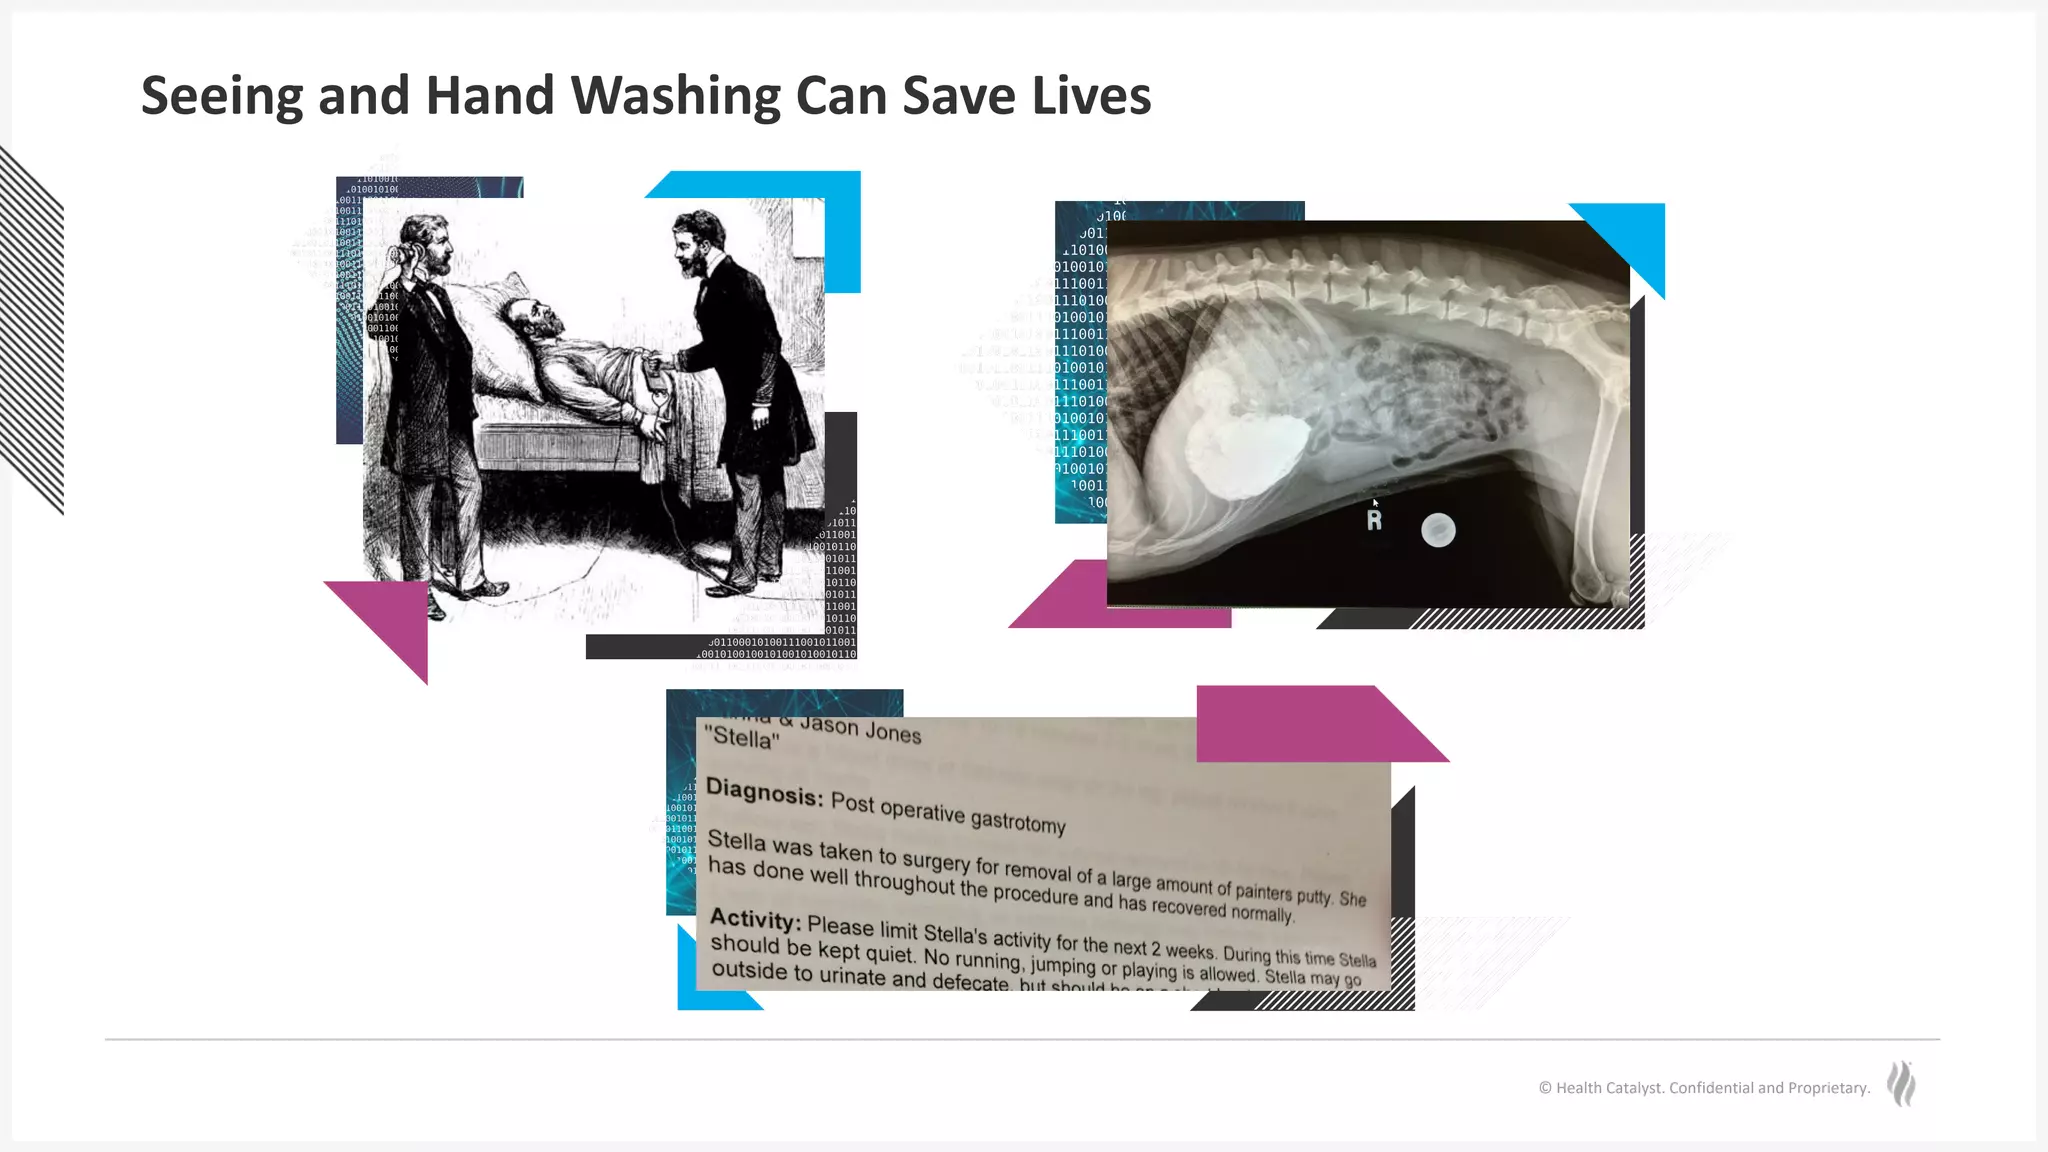
Seeing and Hand Washing Can Save Lives
© Health Catalyst. Confidential and Proprietary.
The Stakes Are Higher than Ever – But So Are the Opportunities
Faster turnaround
requirements and
smaller margins
for error
Across the breadth
of stakeholders
needing support
While balancing a
smaller budget
© Health Catalyst. Confidential and Proprietary.
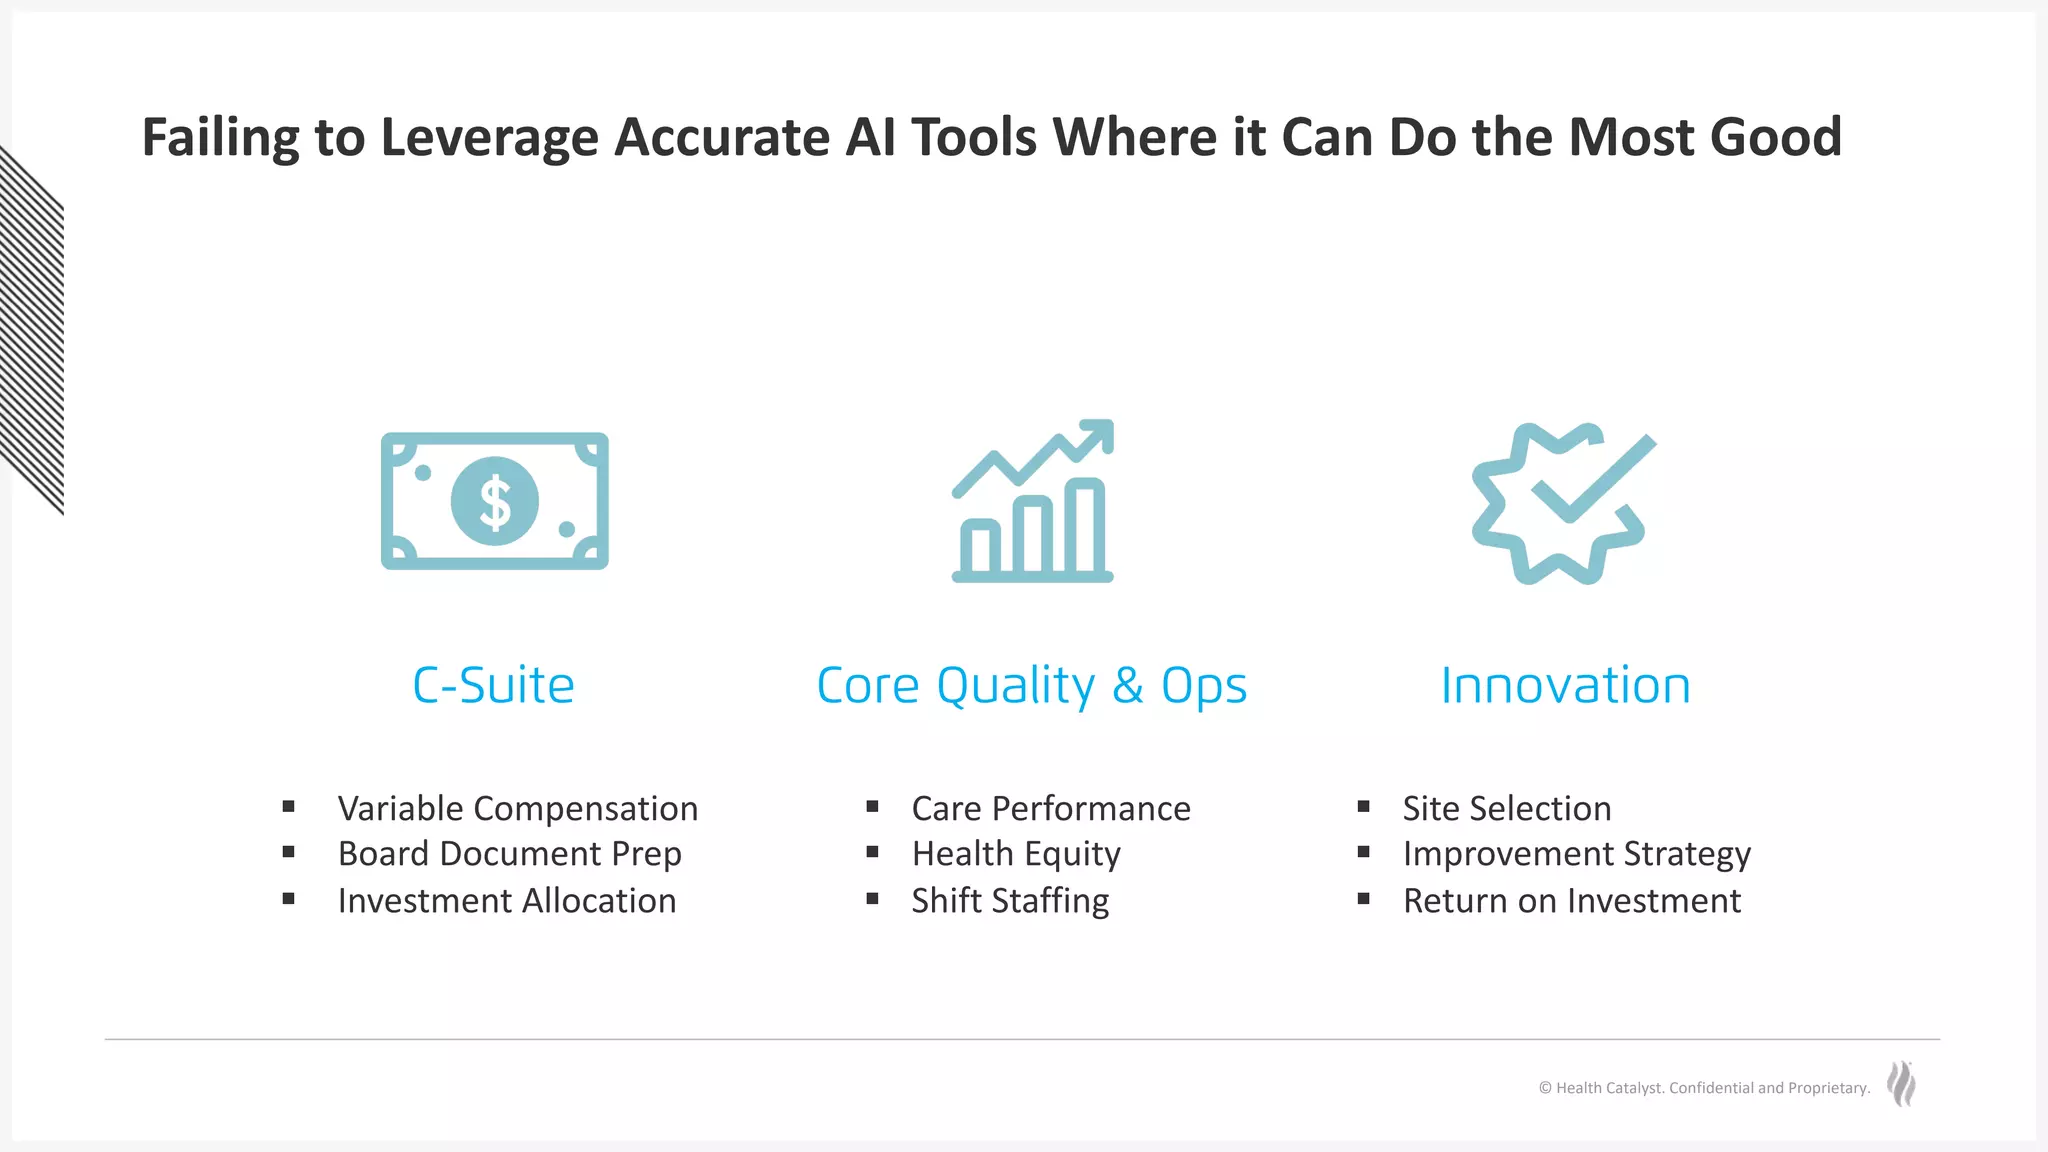
Failing to Leverage Accurate AI Tools Where it Can Do the Most Good
C-Suite Core Quality & Ops Innovation
§ Care Performance
§ Health Equity
§ Shift Staffing
§ Site Selection
§ Improvement Strategy
§ Return on Investment
§ Variable Compensation
§ Board Document Prep
§ Investment Allocation
Poll
Question
When was the last time you suspect your organization
made a significant error in executive decision making
that was preventable?
A. Last week
B. Last month
C. Last quarter
D. Last year
E. Never
© Health Catalyst. Confidential and Proprietary.
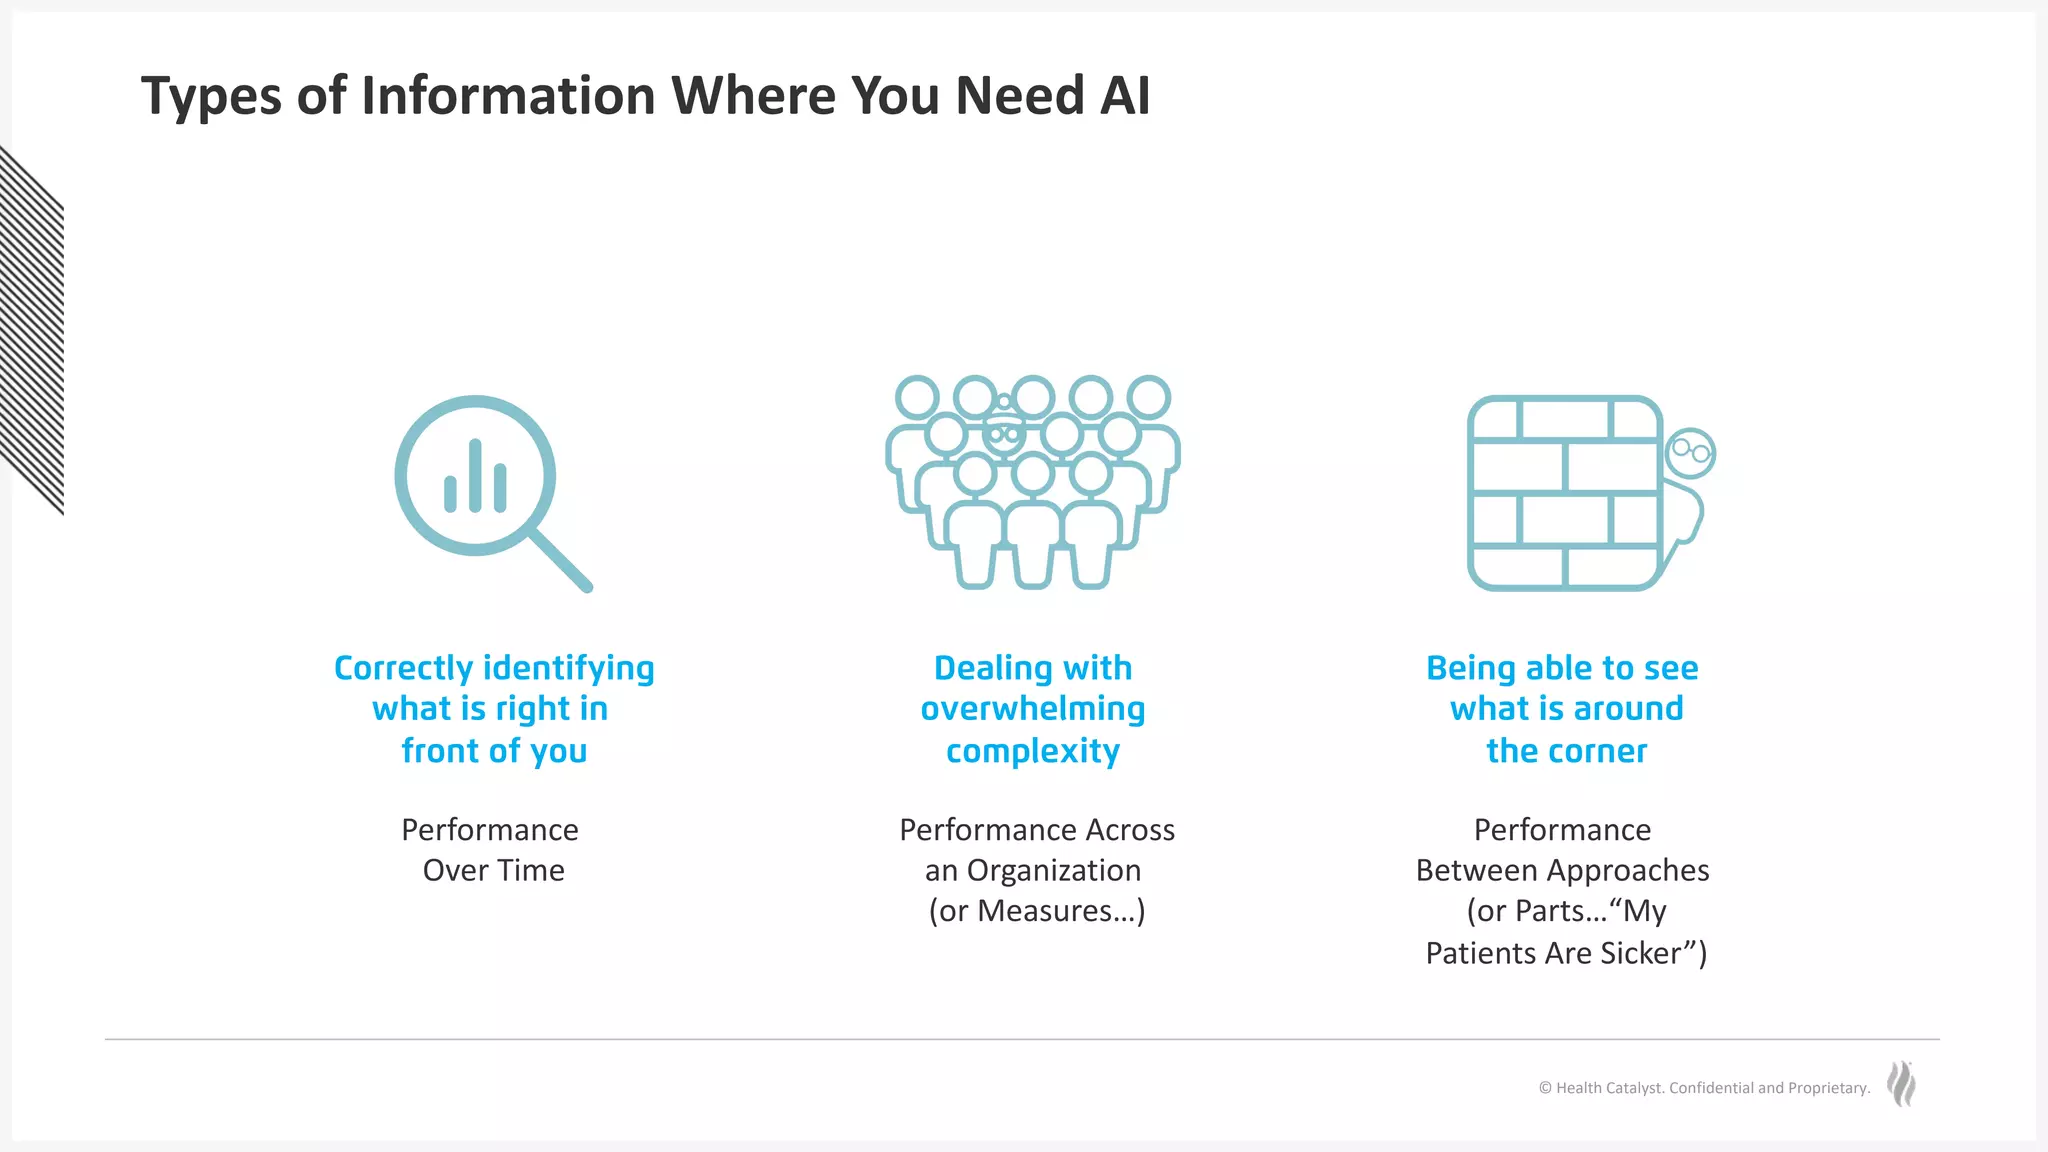
Types of Information Where You Need AI
Correctly identifying
what is right in
front of you
Dealing with
overwhelming
complexity
Being able to see
what is around
the corner
Performance
Between Approaches
(or Parts…“My
Patients Are Sicker”)
Performance Across
an Organization
(or Measures…)
Performance
Over Time
© Health Catalyst. Confidential and Proprietary.
Correctly Identifying
what Is Right in Front of You
Performance Over Time
© Health Catalyst. Confidential and Proprietary.
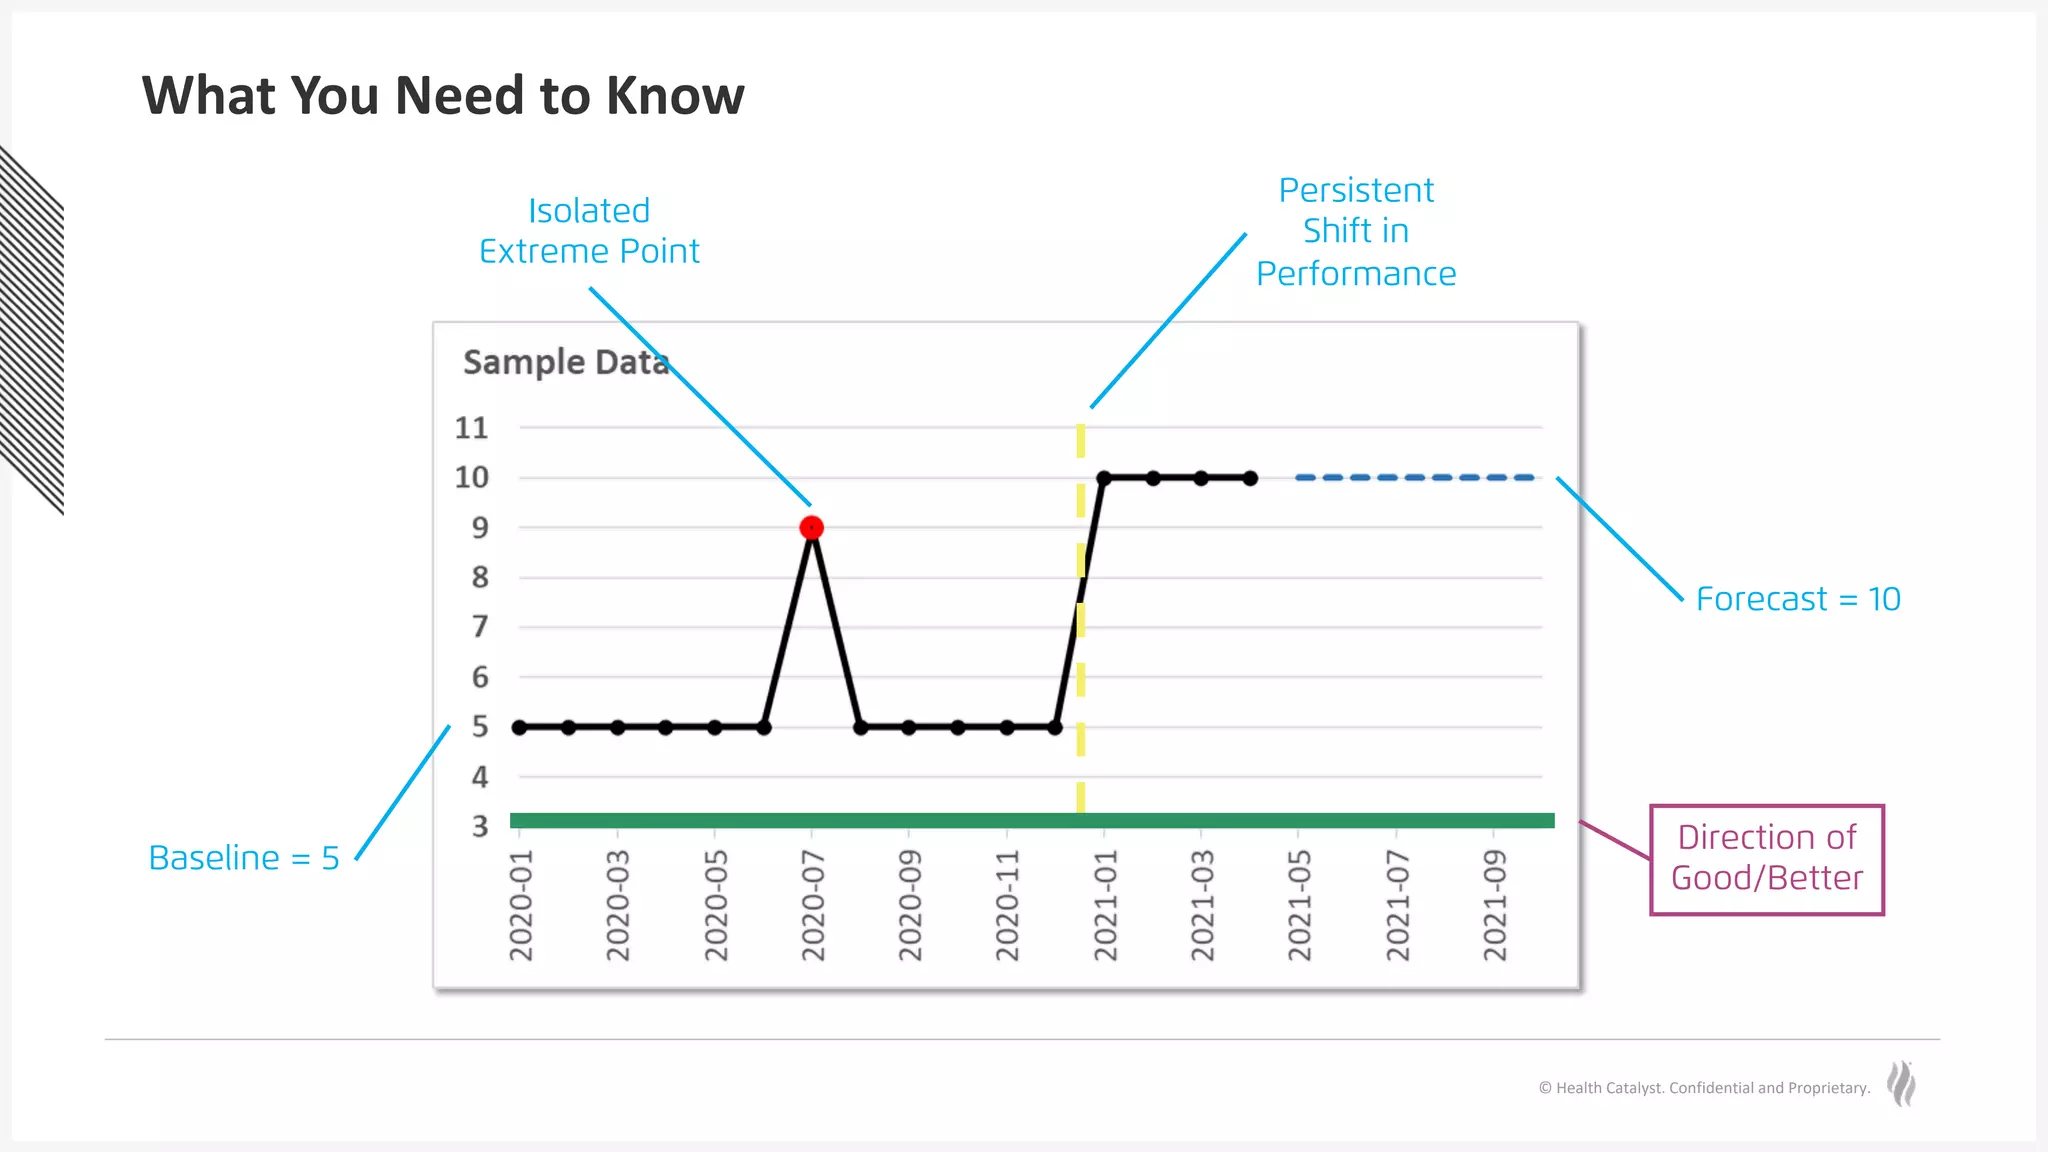
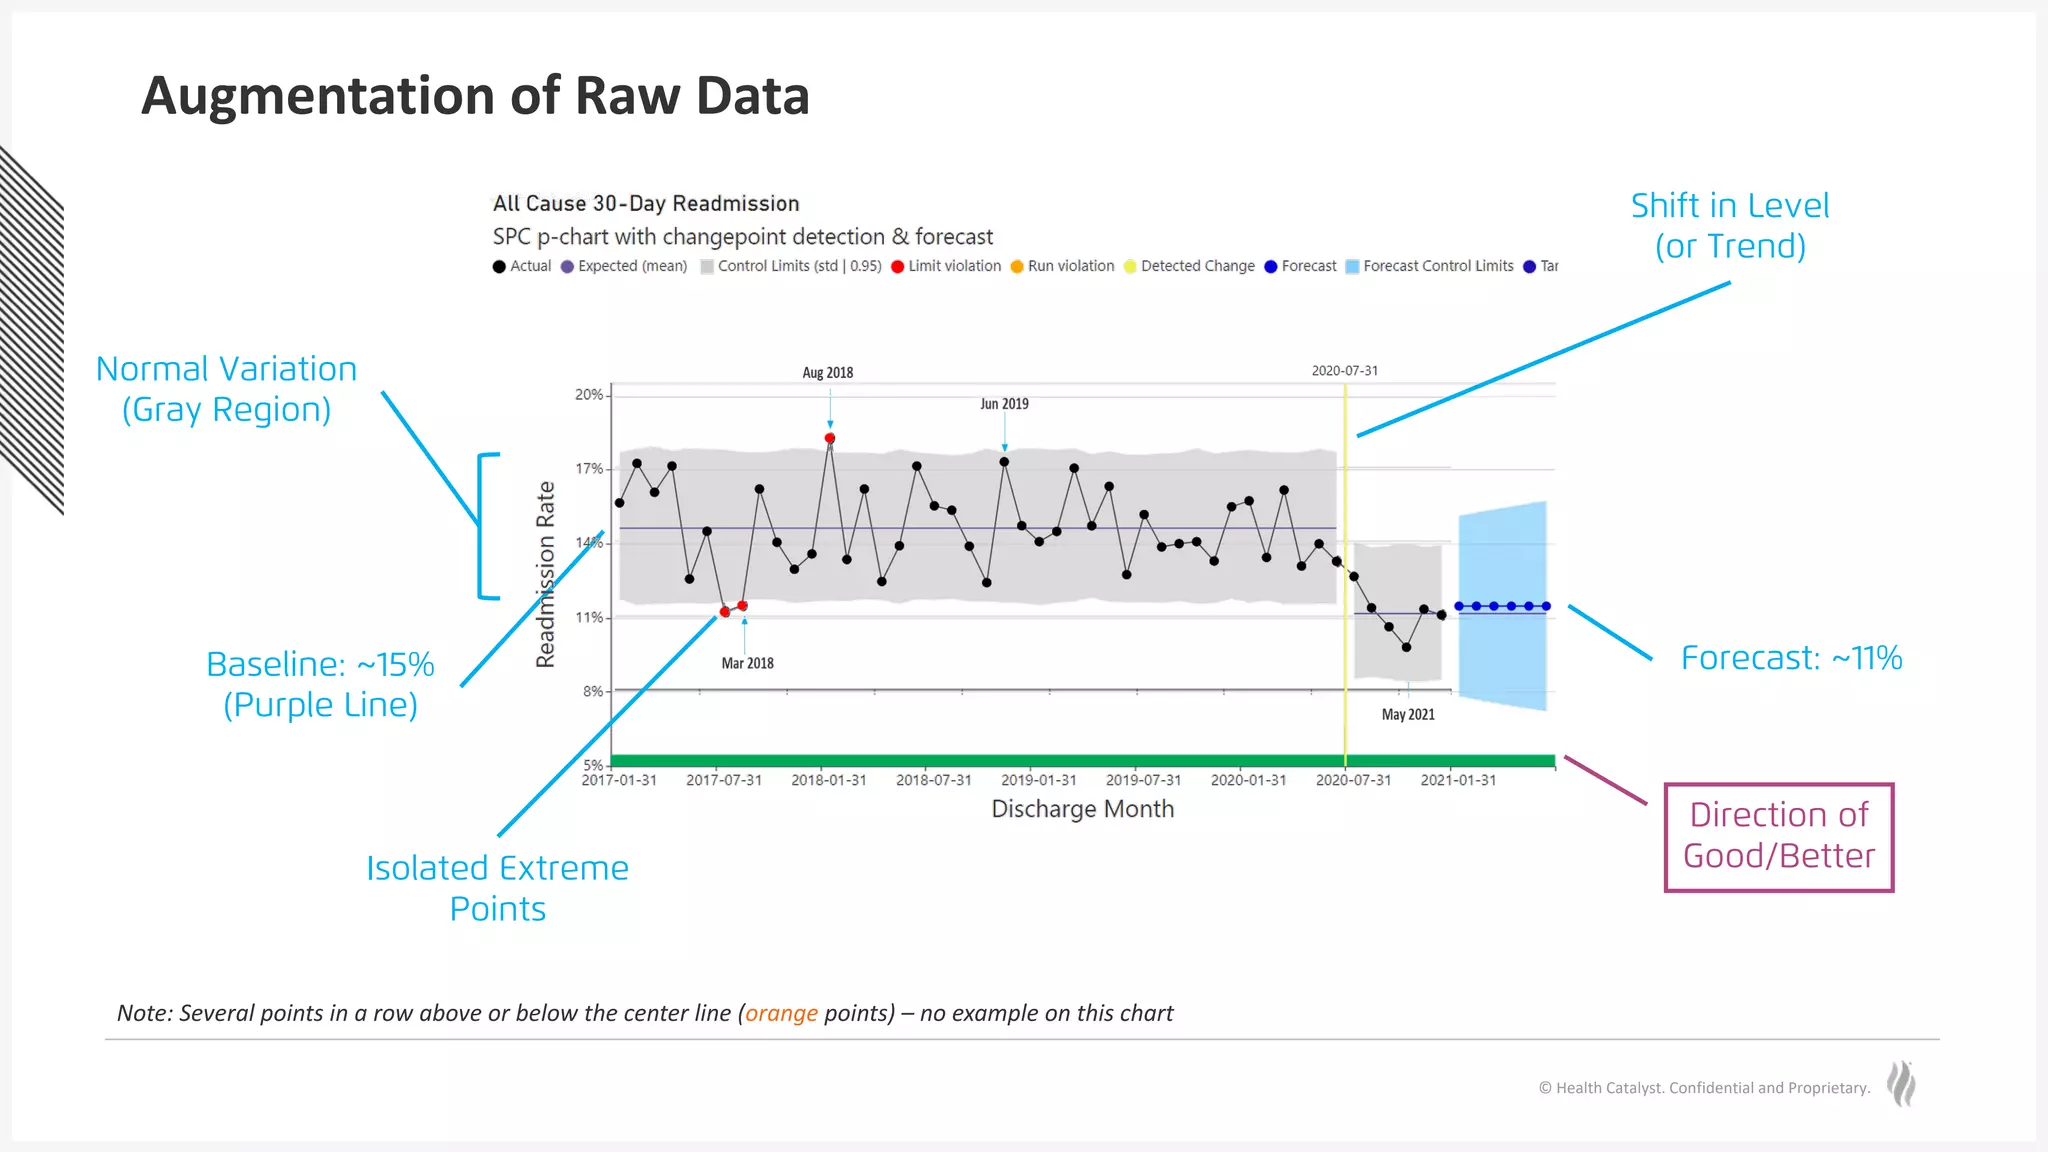
What You Need to Know
Baseline = 5
Isolated
Extreme Point
Persistent
Shift in
Performance
Forecast = 10
Direction of
Good/Better
© Health Catalyst. Confidential and Proprietary.
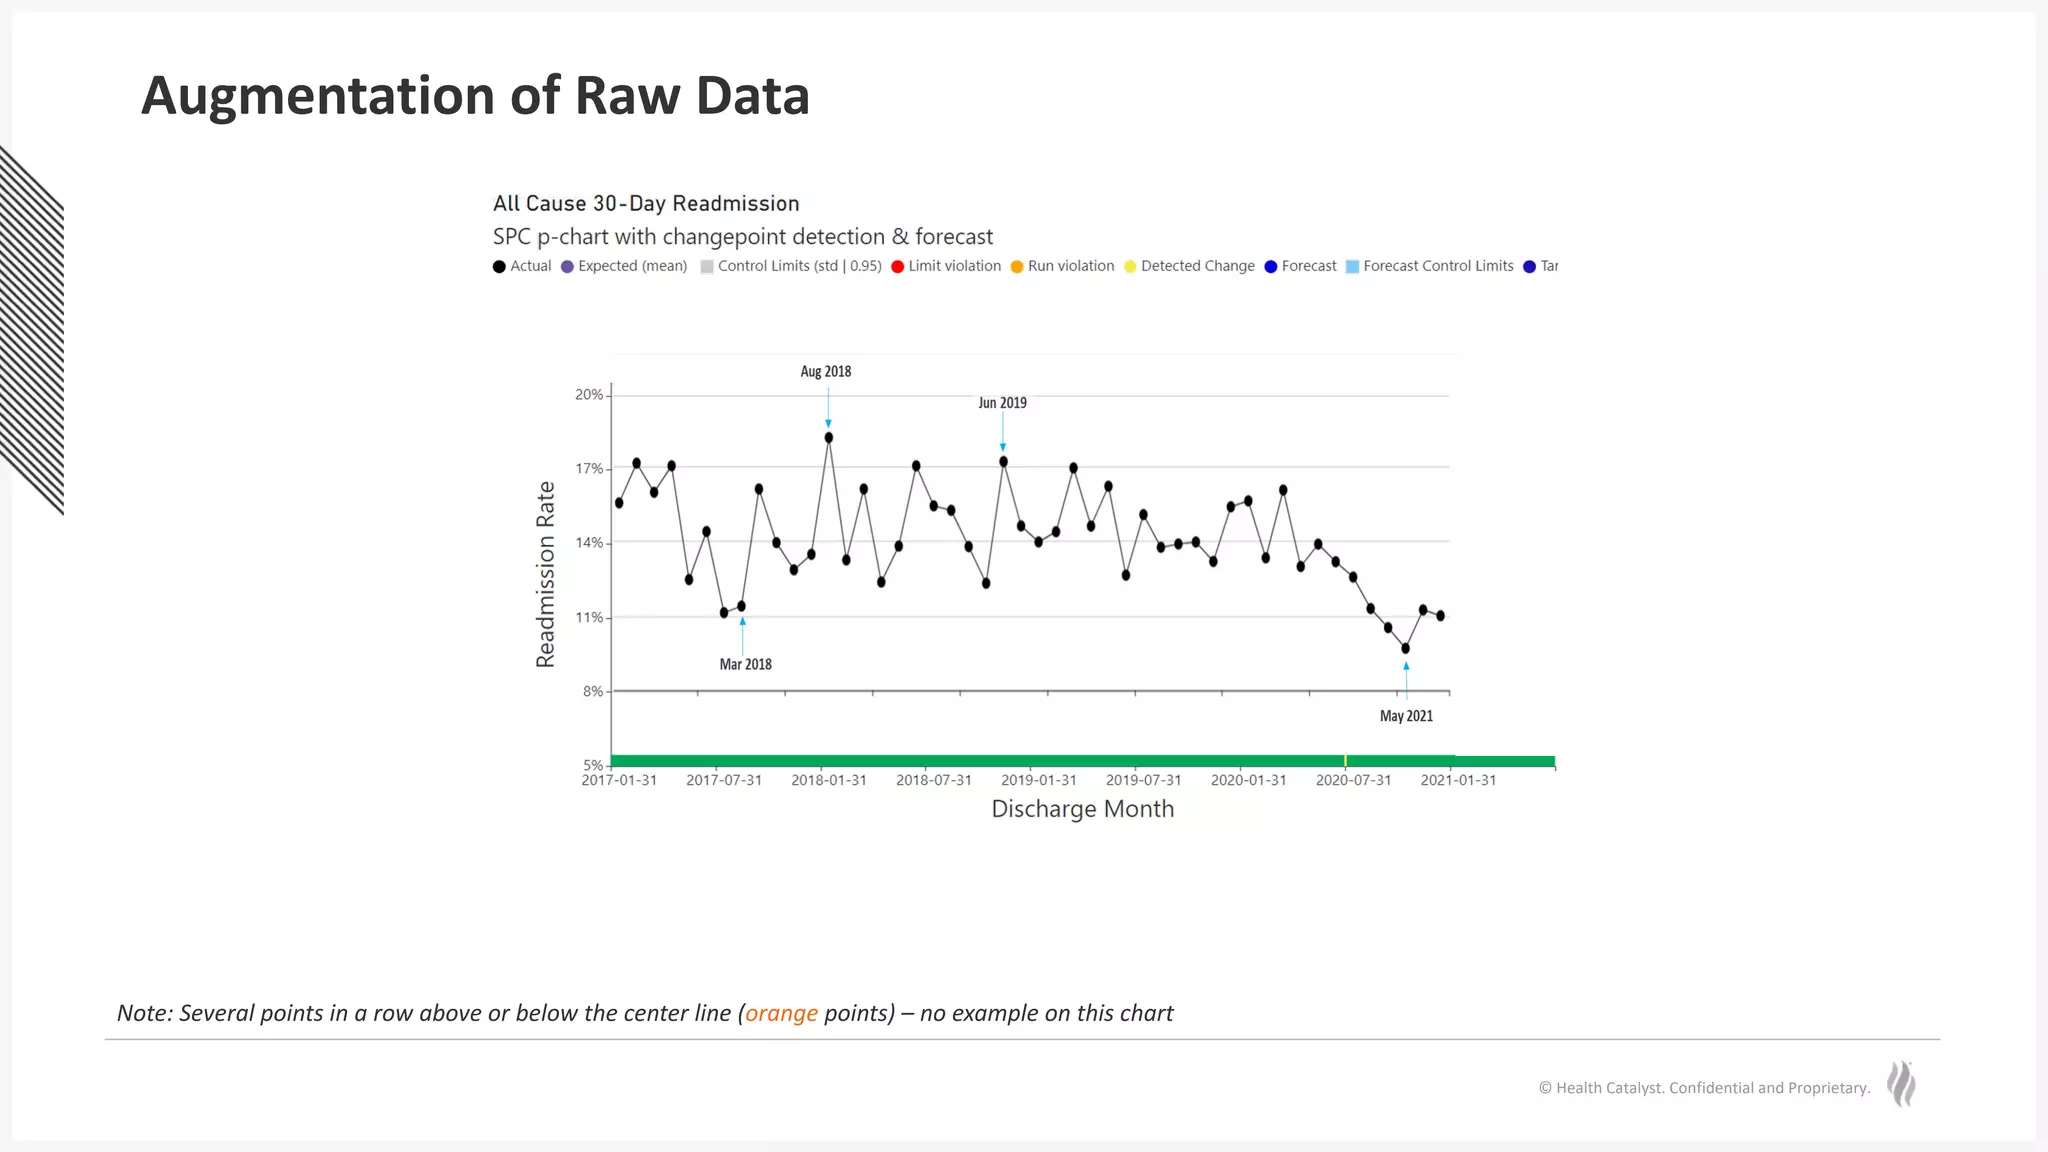
Augmentation of Raw Data
Note: Several points in a row above or below the center line (orange points) – no example on this chart
Poll
Question
How confident are you that you can identify the 4 key
things you need to know from a time series line chart?
A. Very confident
B. Somewhat confident
C. Not confident
© Health Catalyst. Confidential and Proprietary.
Augmentation of Raw Data
Note: Several points in a row above or below the center line (orange points) – no example on this chart
Normal Variation
(Gray Region)
Baseline: ~15%
(Purple Line)
Forecast: ~11%
Direction of
Good/Better
Isolated Extreme
Points
Shift in Level
(or Trend)
© Health Catalyst. Confidential and Proprietary.
Why Your Tools Are Failing You
Here’s The Good News
Modern BI tools have made it easy to create beautiful charts. AI can make
it easy to draw correct, consistent, and transparent conclusions from them.
Correctly identifying what is right in front of you
© Health Catalyst. Confidential and Proprietary.
Dealing with Overwhelming Complexity
Performance Across
an Organization (or Measures…)
© Health Catalyst. Confidential and Proprietary.
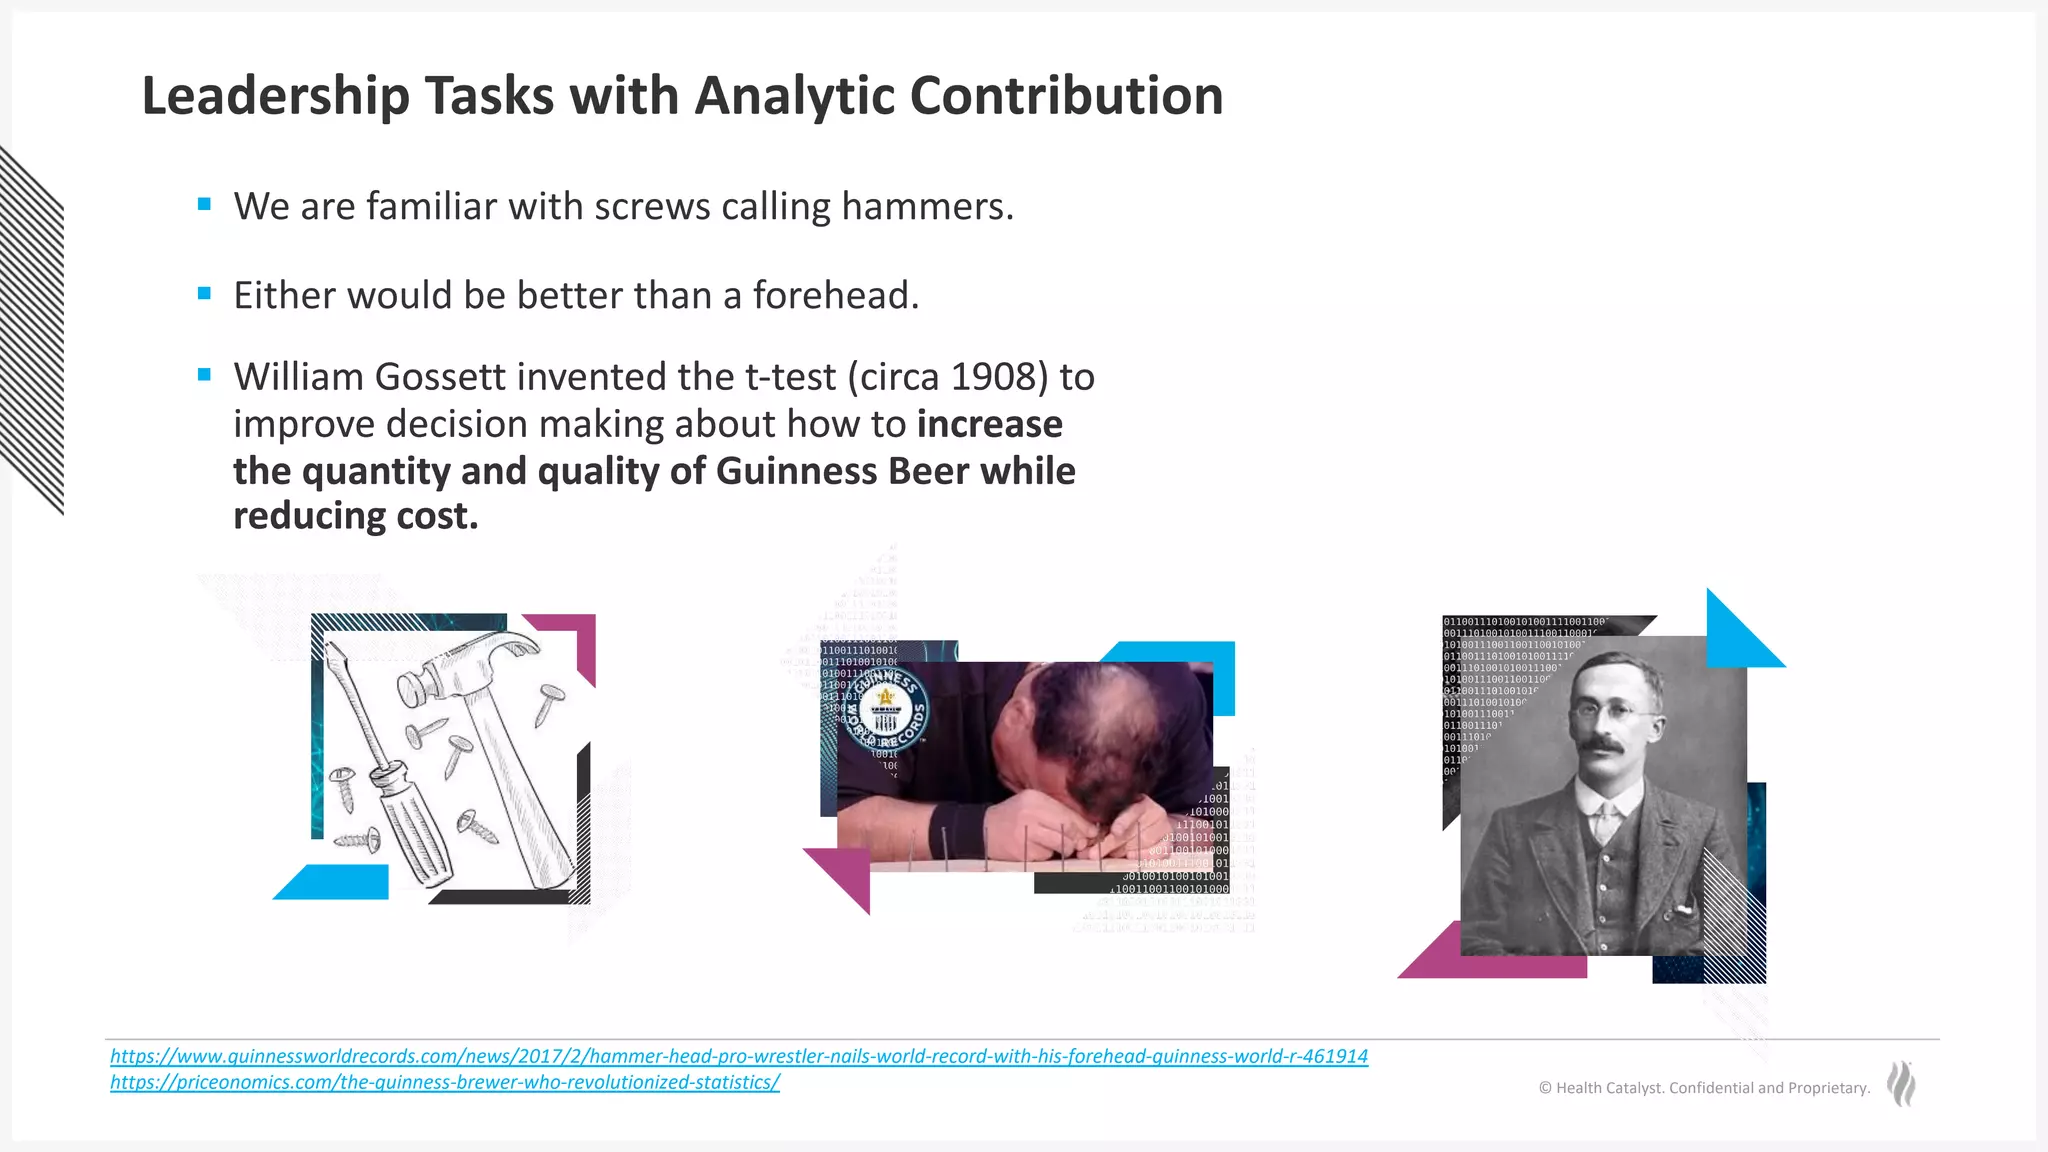
§ William Gossett invented the t-test (circa 1908) to
improve decision making about how to increase
the quantity and quality of Guinness Beer while
reducing cost.
§ We are familiar with screws calling hammers.
§ Either would be better than a forehead.
§ William Gossett invented the t-test (circa 1908) to
improve decision making about how to increase
the quantity and quality of Guinness Beer while
reducing cost.
Leadership Tasks with Analytic Contribution
https://www.guinnessworldrecords.com/news/2017/2/hammer-head-pro-wrestler-nails-world-record-with-his-forehead-guinness-world-r-461914
https://priceonomics.com/the-guinness-brewer-who-revolutionized-statistics/
Poll
Question
When was the last time you used a statistical
technique to support an executive decision?
A. Last week
B. Last month
C. Last quarter
D. Last year
E. Never
© Health Catalyst. Confidential and Proprietary.
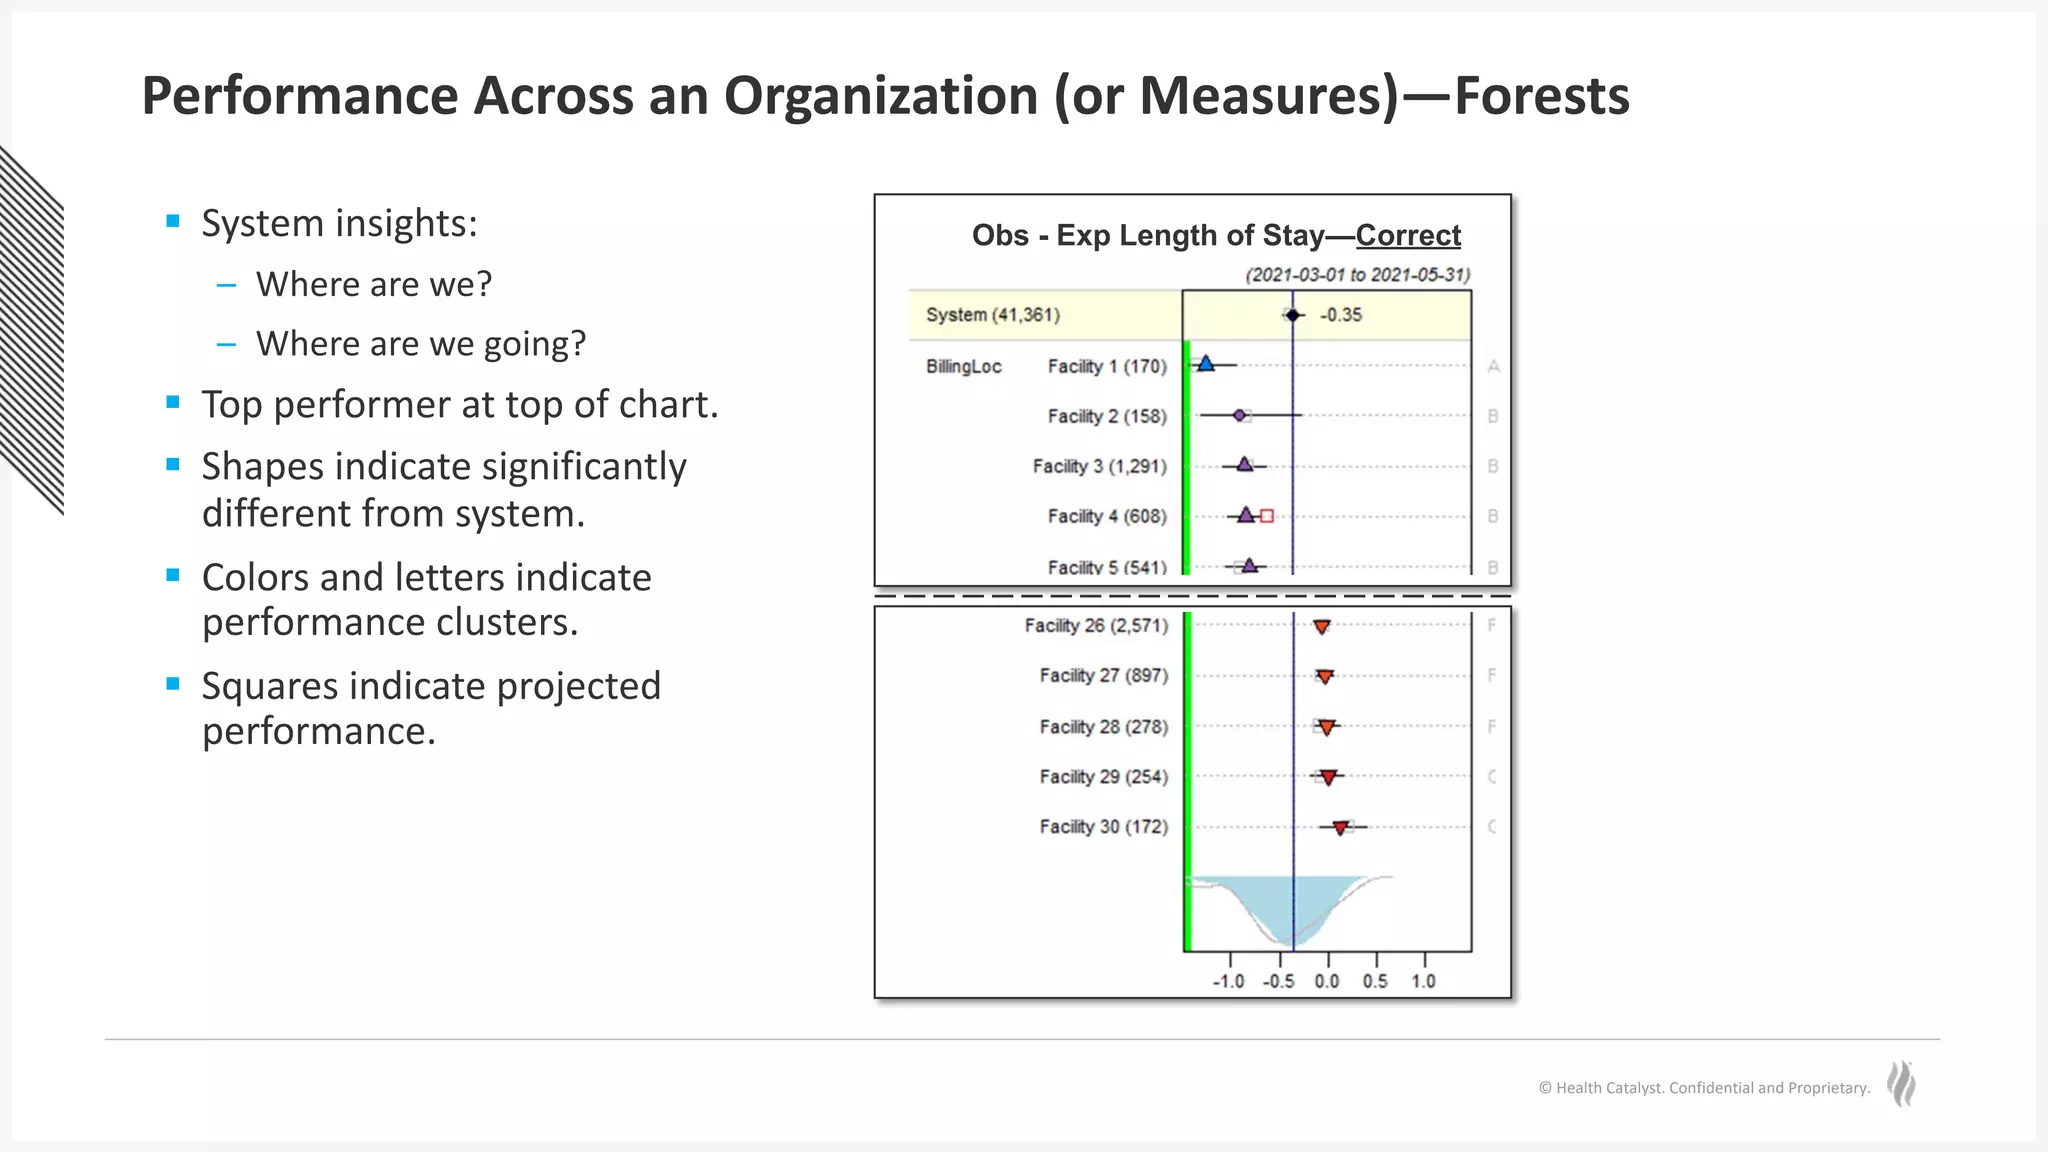
Performance Across an Organization (or Measures)—Forests
Obs - Exp Length of Stay—Correct
§ System insights:
– Where are we?
– Where are we going?
§ Top performer at top of chart.
§ Shapes indicate significantly
different from system.
§ Colors and letters indicate
performance clusters.
§ Squares indicate projected
performance.
© Health Catalyst. Confidential and Proprietary.
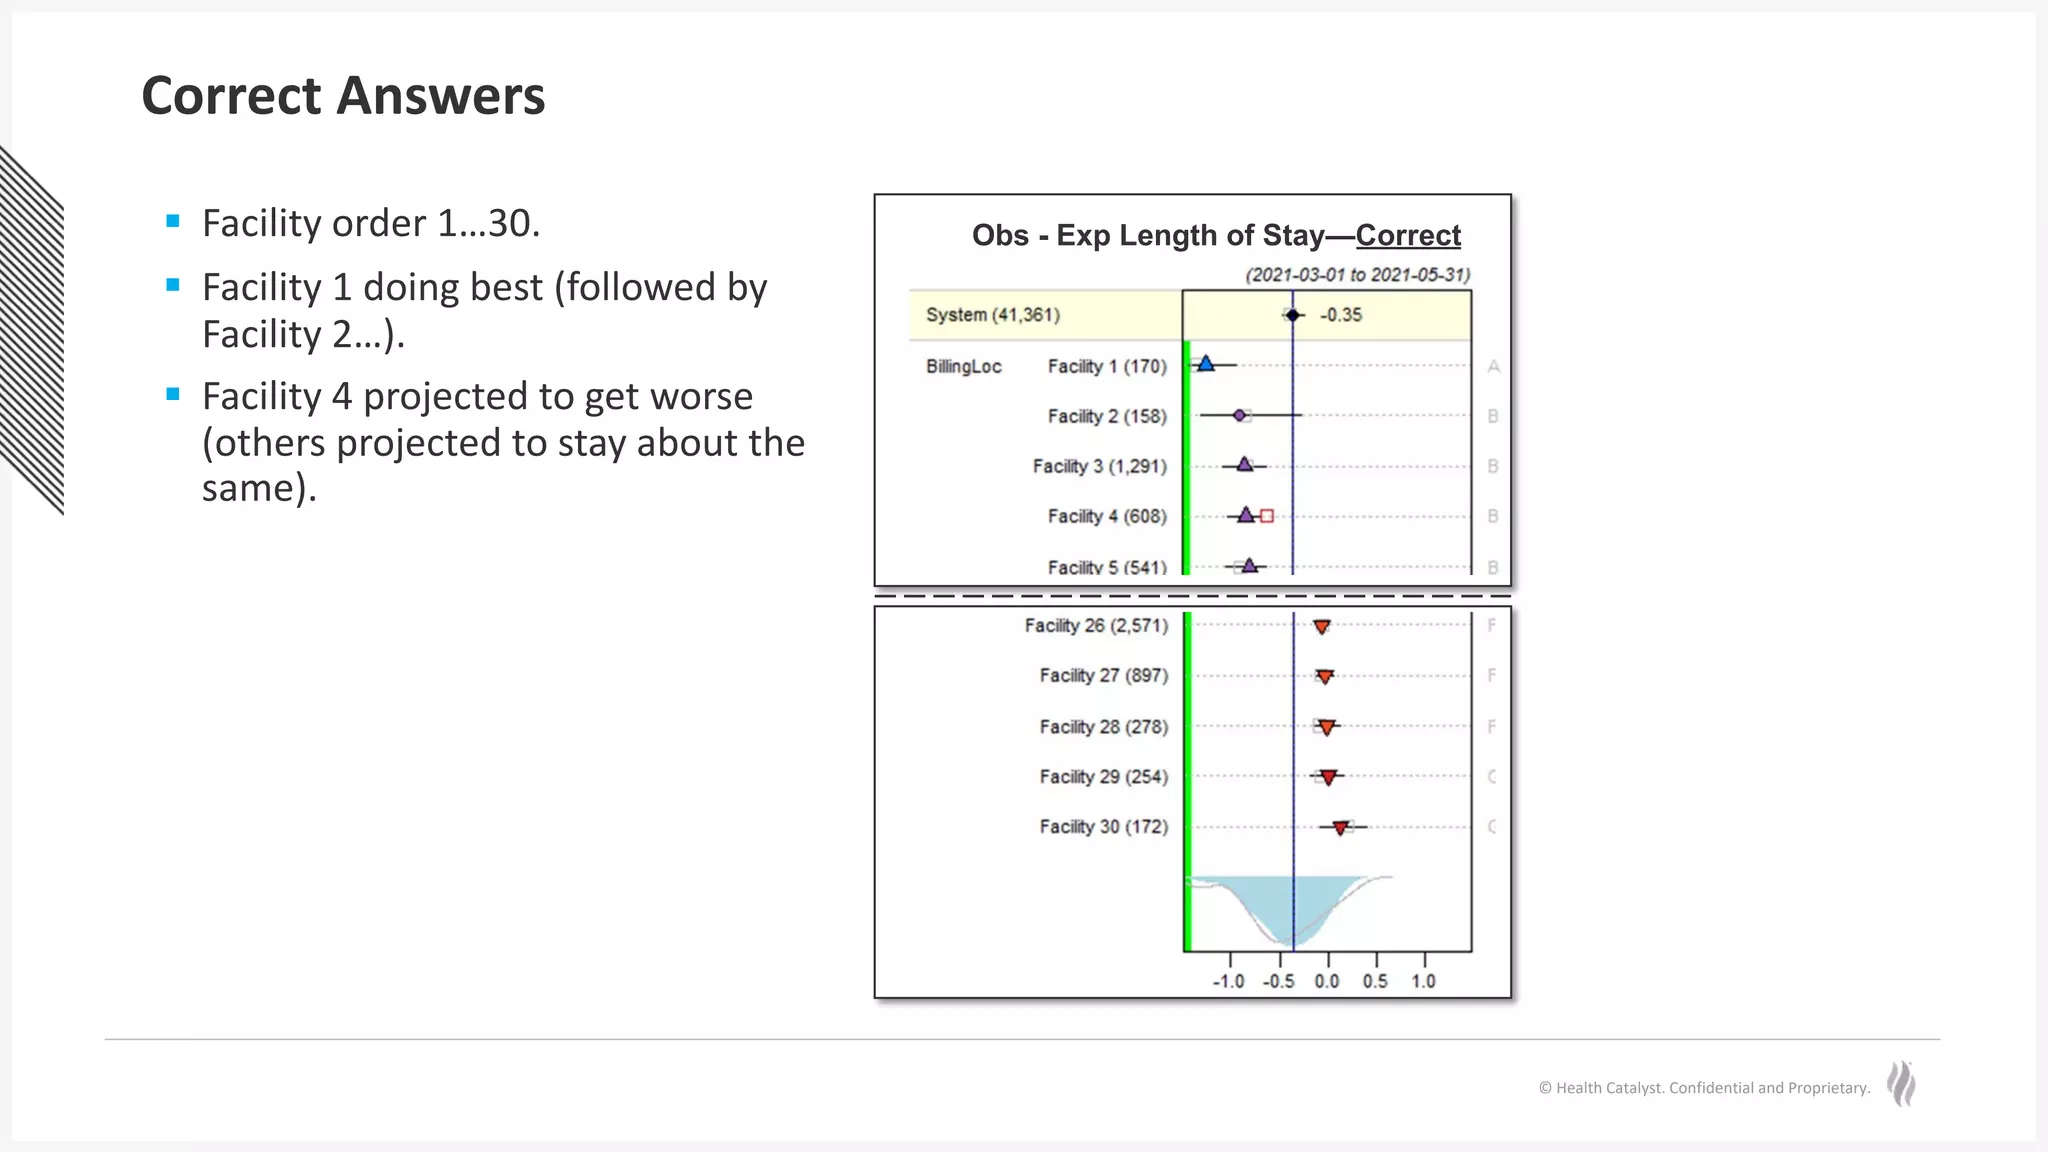
Correct Answers
Obs - Exp Length of Stay—Correct
§ Facility order 1…30.
§ Facility 1 doing best (followed by
Facility 2…).
§ Facility 4 projected to get worse
(others projected to stay about the
same).
© Health Catalyst. Confidential and Proprietary.
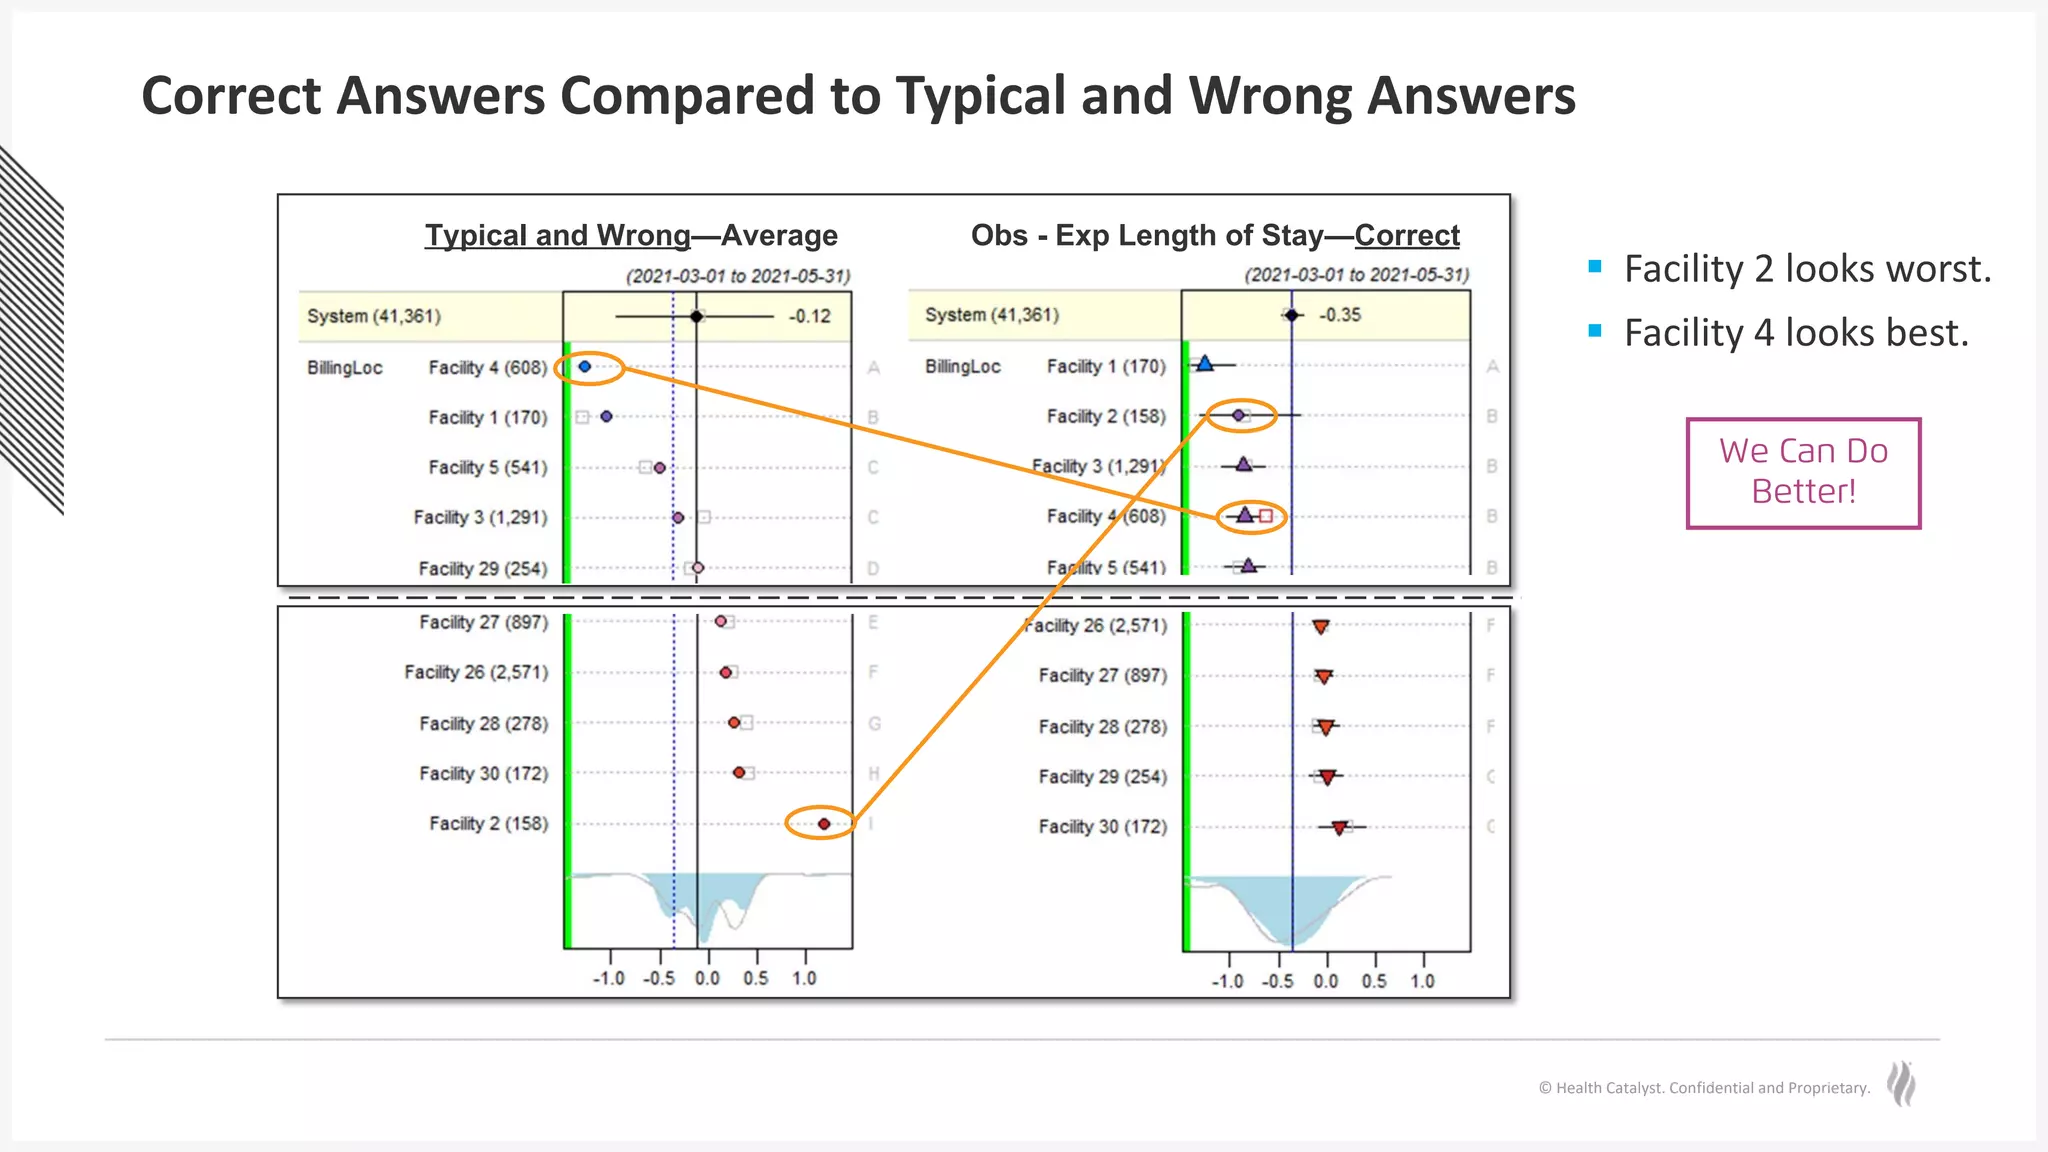
Correct Answers Compared to Typical and Wrong Answers
Obs - Exp Length of Stay—Correct
Typical and Wrong—Average
§ Facility 2 looks worst.
§ Facility 4 looks best.
We Can Do
Better!
© Health Catalyst. Confidential and Proprietary.
Why Your Tools Are Failing You
Here’s The Good News
You can expect more than tabular displays of data with inferior methods.
In the face of increasing complexity, AI can help you make better decisions
with confidence.
Dealing with overwhelming complexity
© Health Catalyst. Confidential and Proprietary.
Being Able to See
What Is Around the Corner
Performance Between Approaches
(or Parts… “My Patients Are Sicker”)
© Health Catalyst. Confidential and Proprietary.
Why We Do Trials…
We Knew (2011)11: Dealing with social
determinants of health for high-risk
patients could reduce hospitalizations.
We Learned (2020)12: High-risk
patients did experience decreased
hospitalization—but there was no
difference between treatment and
control groups…and now we’re trying
refined approaches.
We were able to learn only because we
had the right study design up front.
The same has happened with intensive
monitoring in severe sepsis or septic
shock and tight glucose control.
Hot Spotting
Gawande A. (2011). The hot spotters: Can we lower medical costs by giving the neediest patients better care? New Yorker (New York, N.Y.), 40–51. Finkelstein, A.,
Zhou, A., Taubman, S., & Doyle, J. (2020). Health care hotspotting – A randomized, controlled trial. The New England Journal of Medicine, 382(2), 152–162.
https://doi.org/10.1056/NEJMsa1906848
Poll
Question
For which of the following types of decisions have you
used AI (or other advanced techniques) recently?
A. Drug formulary
B. Surgical device/implant/cart
C. Care management implementation/expansion
D. Facility/provider comparison
E. Care/revenue process change
F. Other, similar type of decision
© Health Catalyst. Confidential and Proprietary.
Should We Continue/Expand Support for a Work Training Program?
Understanding the “Apples to Oranges” Comparison
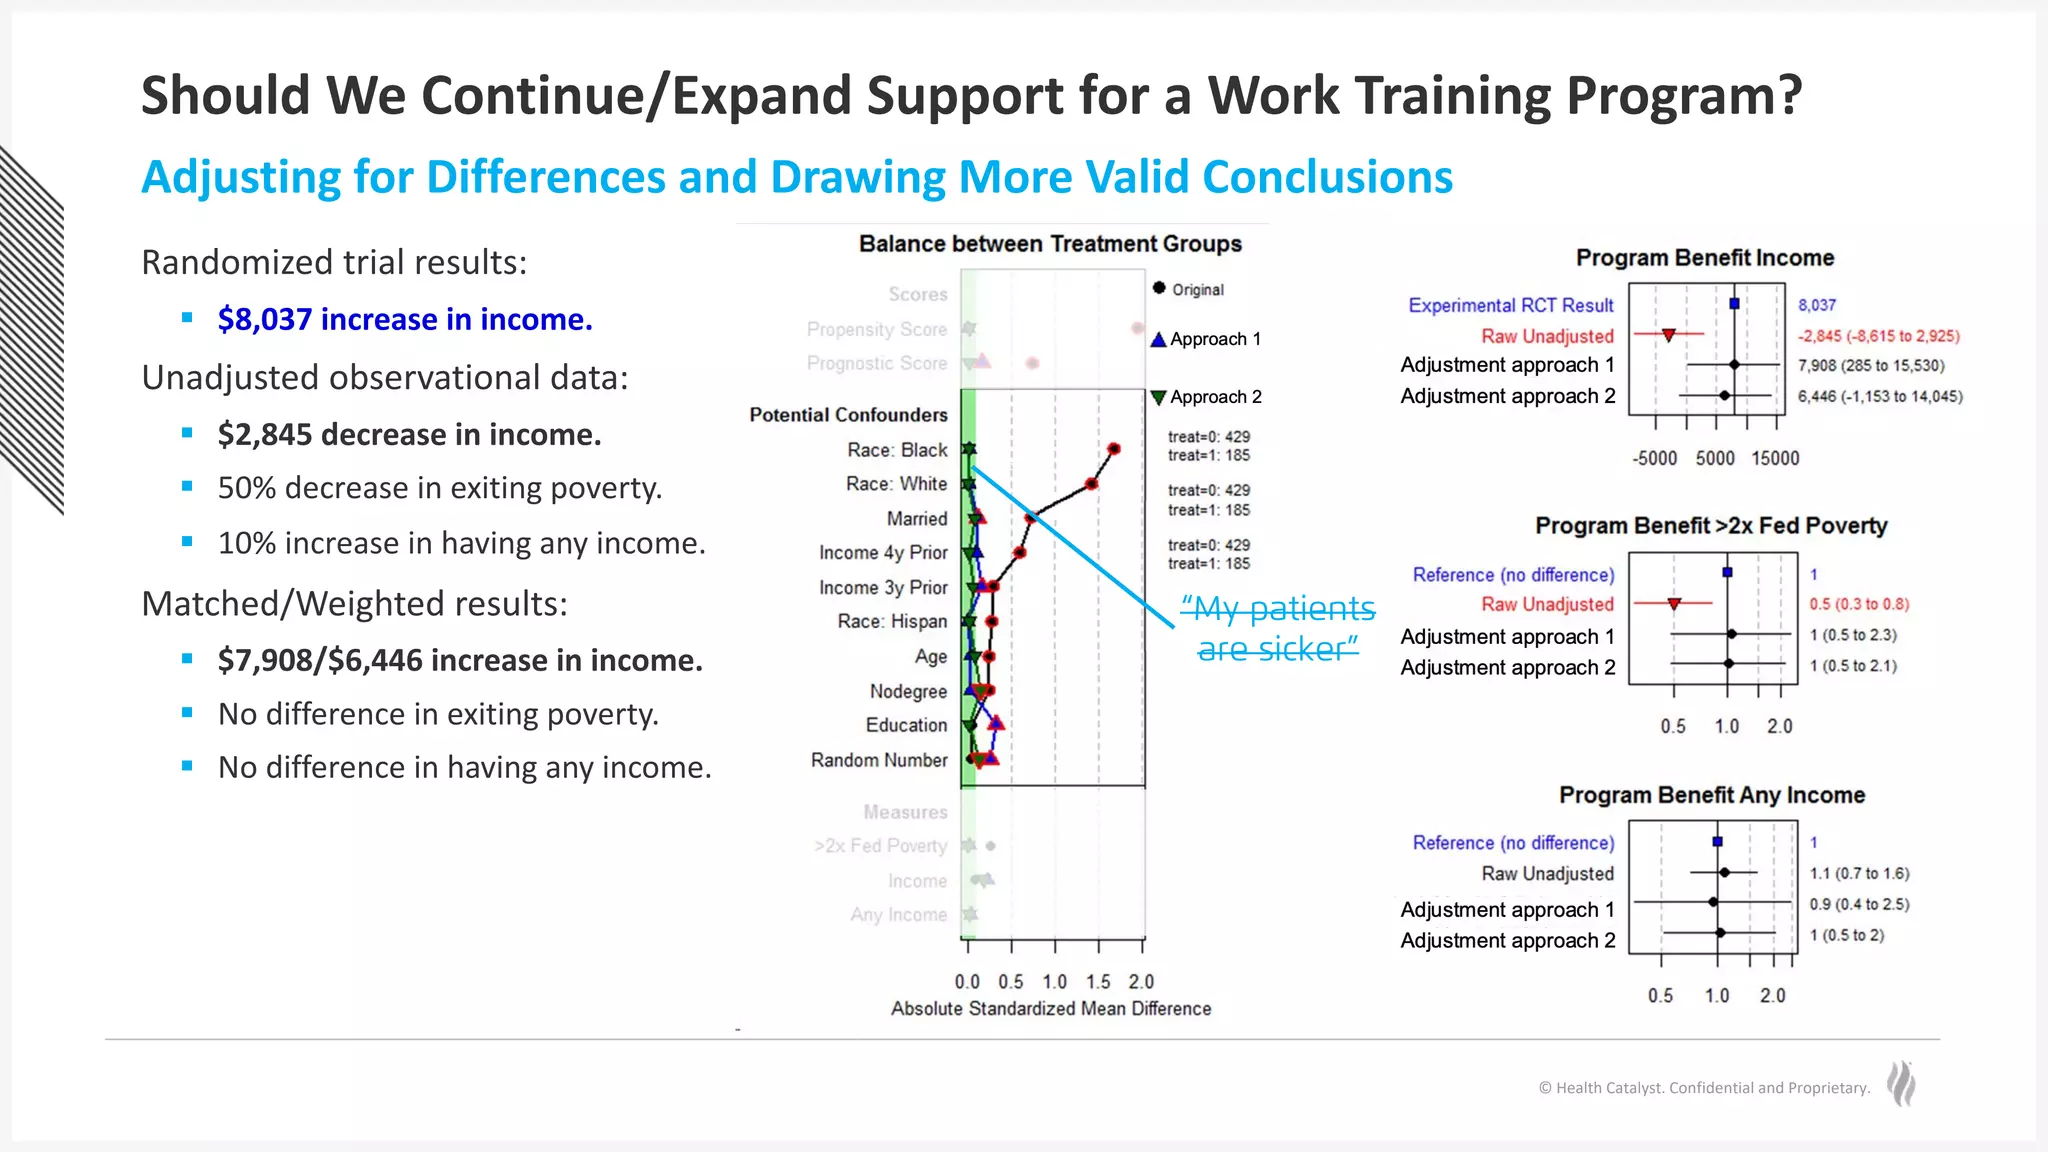
Left plot shows important “imbalances”
(potential confounding):
§ Important differences in race, marital
status, prior income, age, and having
no degree.
§ Small differences in education level.
§ Random number no difference…as
expected.
Confounding:
§ Want to draw a conclusion about
how “A” (e.g., training) impacts “B”
(e.g., income).
§ But a Confounder (e.g., prior income)
is related to both A and B.
A B
C
“My patients
are sicker”
© Health Catalyst. Confidential and Proprietary.
Should We Continue/Expand Support for a Work Training Program?
Adjusting for Differences and Drawing More Valid Conclusions
“My patients
are sicker”
Randomized trial results:
§ $8,037 increase in income.
Unadjusted observational data:
§ $2,845 decrease in income.
§ 50% decrease in exiting poverty.
§ 10% increase in having any income.
Matched/Weighted results:
§ $7,908/$6,446 increase in income.
§ No difference in exiting poverty.
§ No difference in having any income.
© Health Catalyst. Confidential and Proprietary.
Why Your Tools Are Failing You
Here’s The Good News
Healthcare analytics are always complex. AI tools allow you to address the
(un)known unkowns such as when some patients are sicker, allowing you to
draw more valid conclusions.
Being able to see what is around the corner
© Health Catalyst. Confidential and Proprietary.
Accessibility and Application
© Health Catalyst. Confidential and Proprietary.
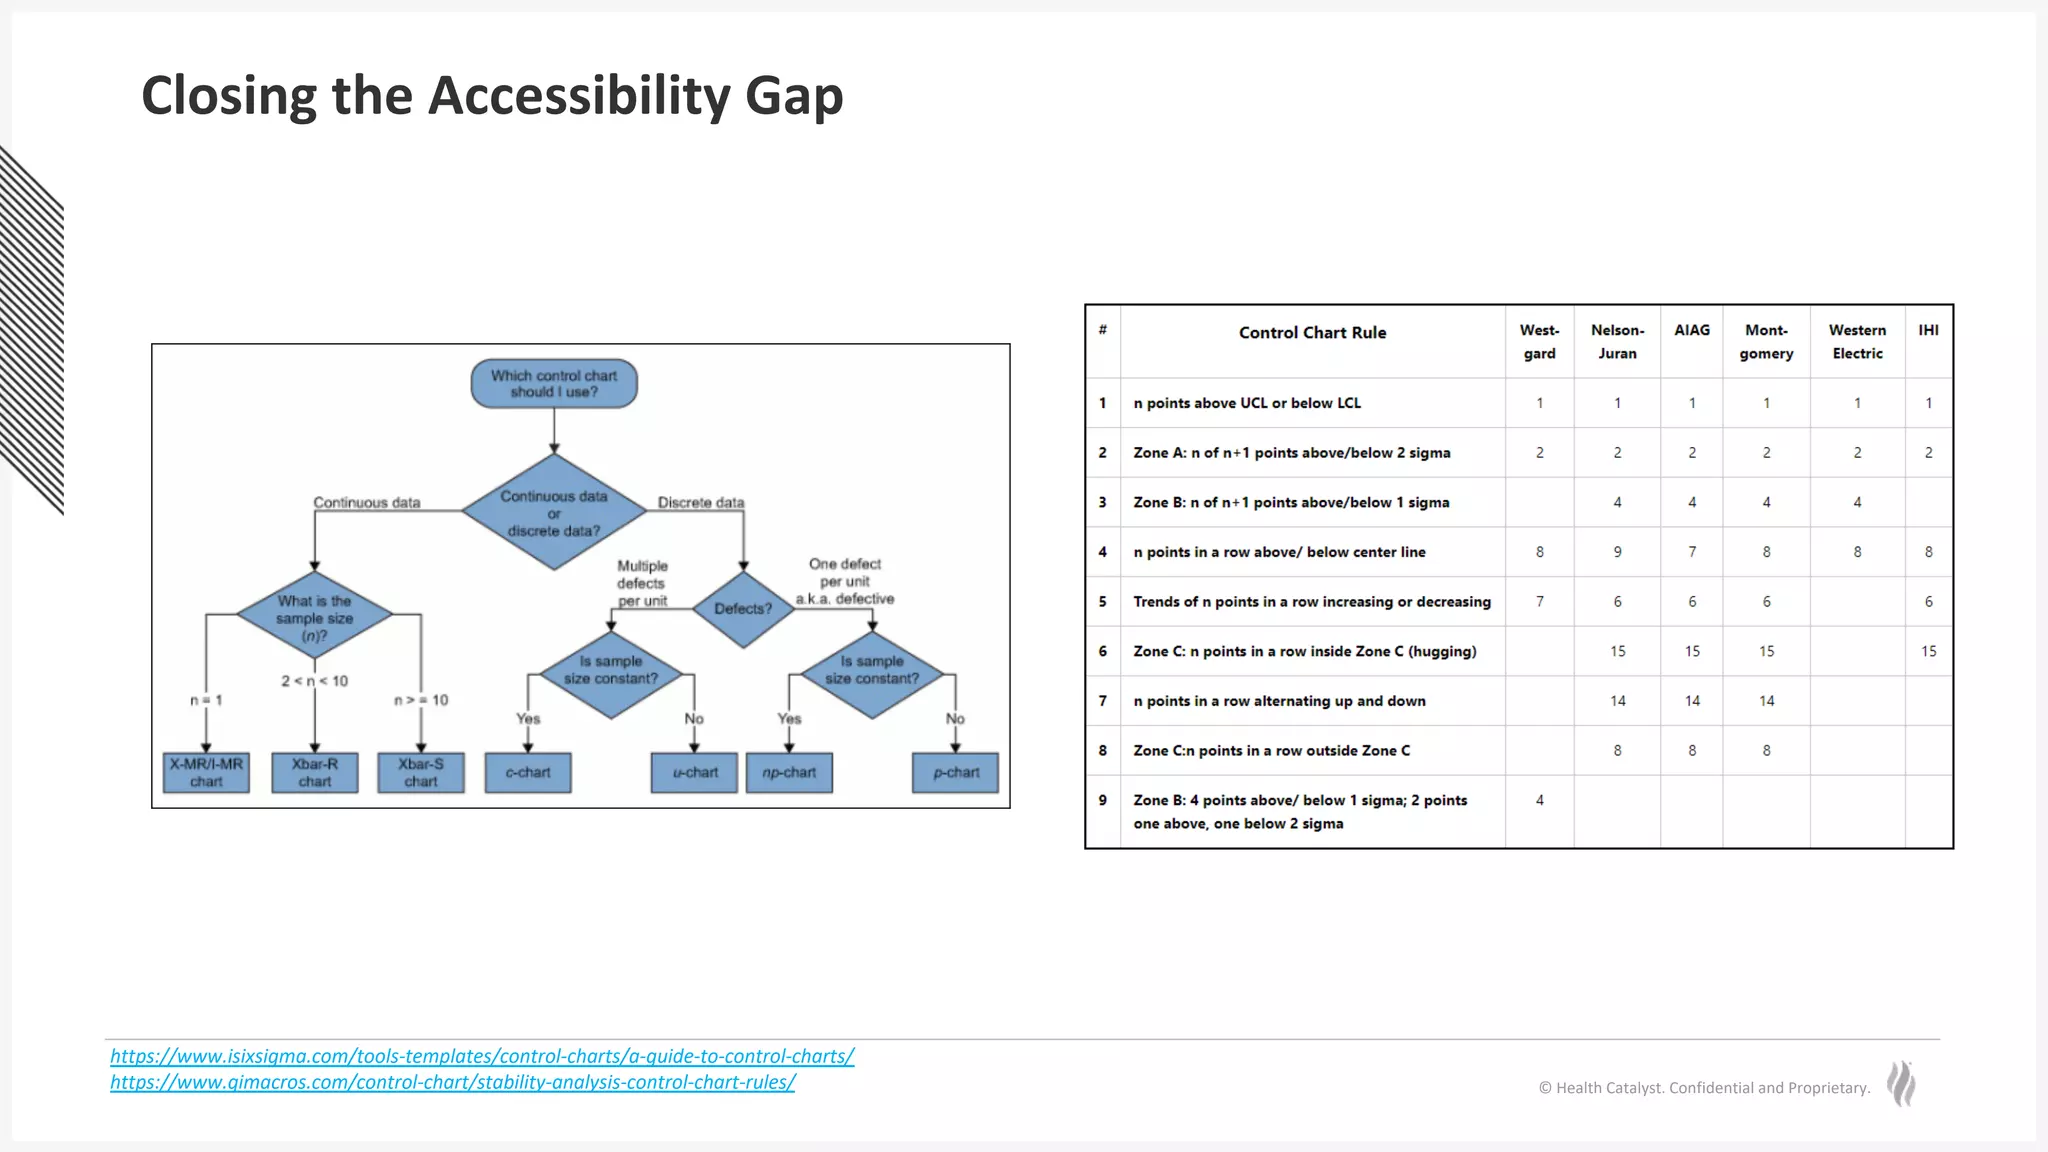
Closing the Accessibility Gap
https://www.isixsigma.com/tools-templates/control-charts/a-guide-to-control-charts/
https://www.qimacros.com/control-chart/stability-analysis-control-chart-rules/
© Health Catalyst. Confidential and Proprietary.
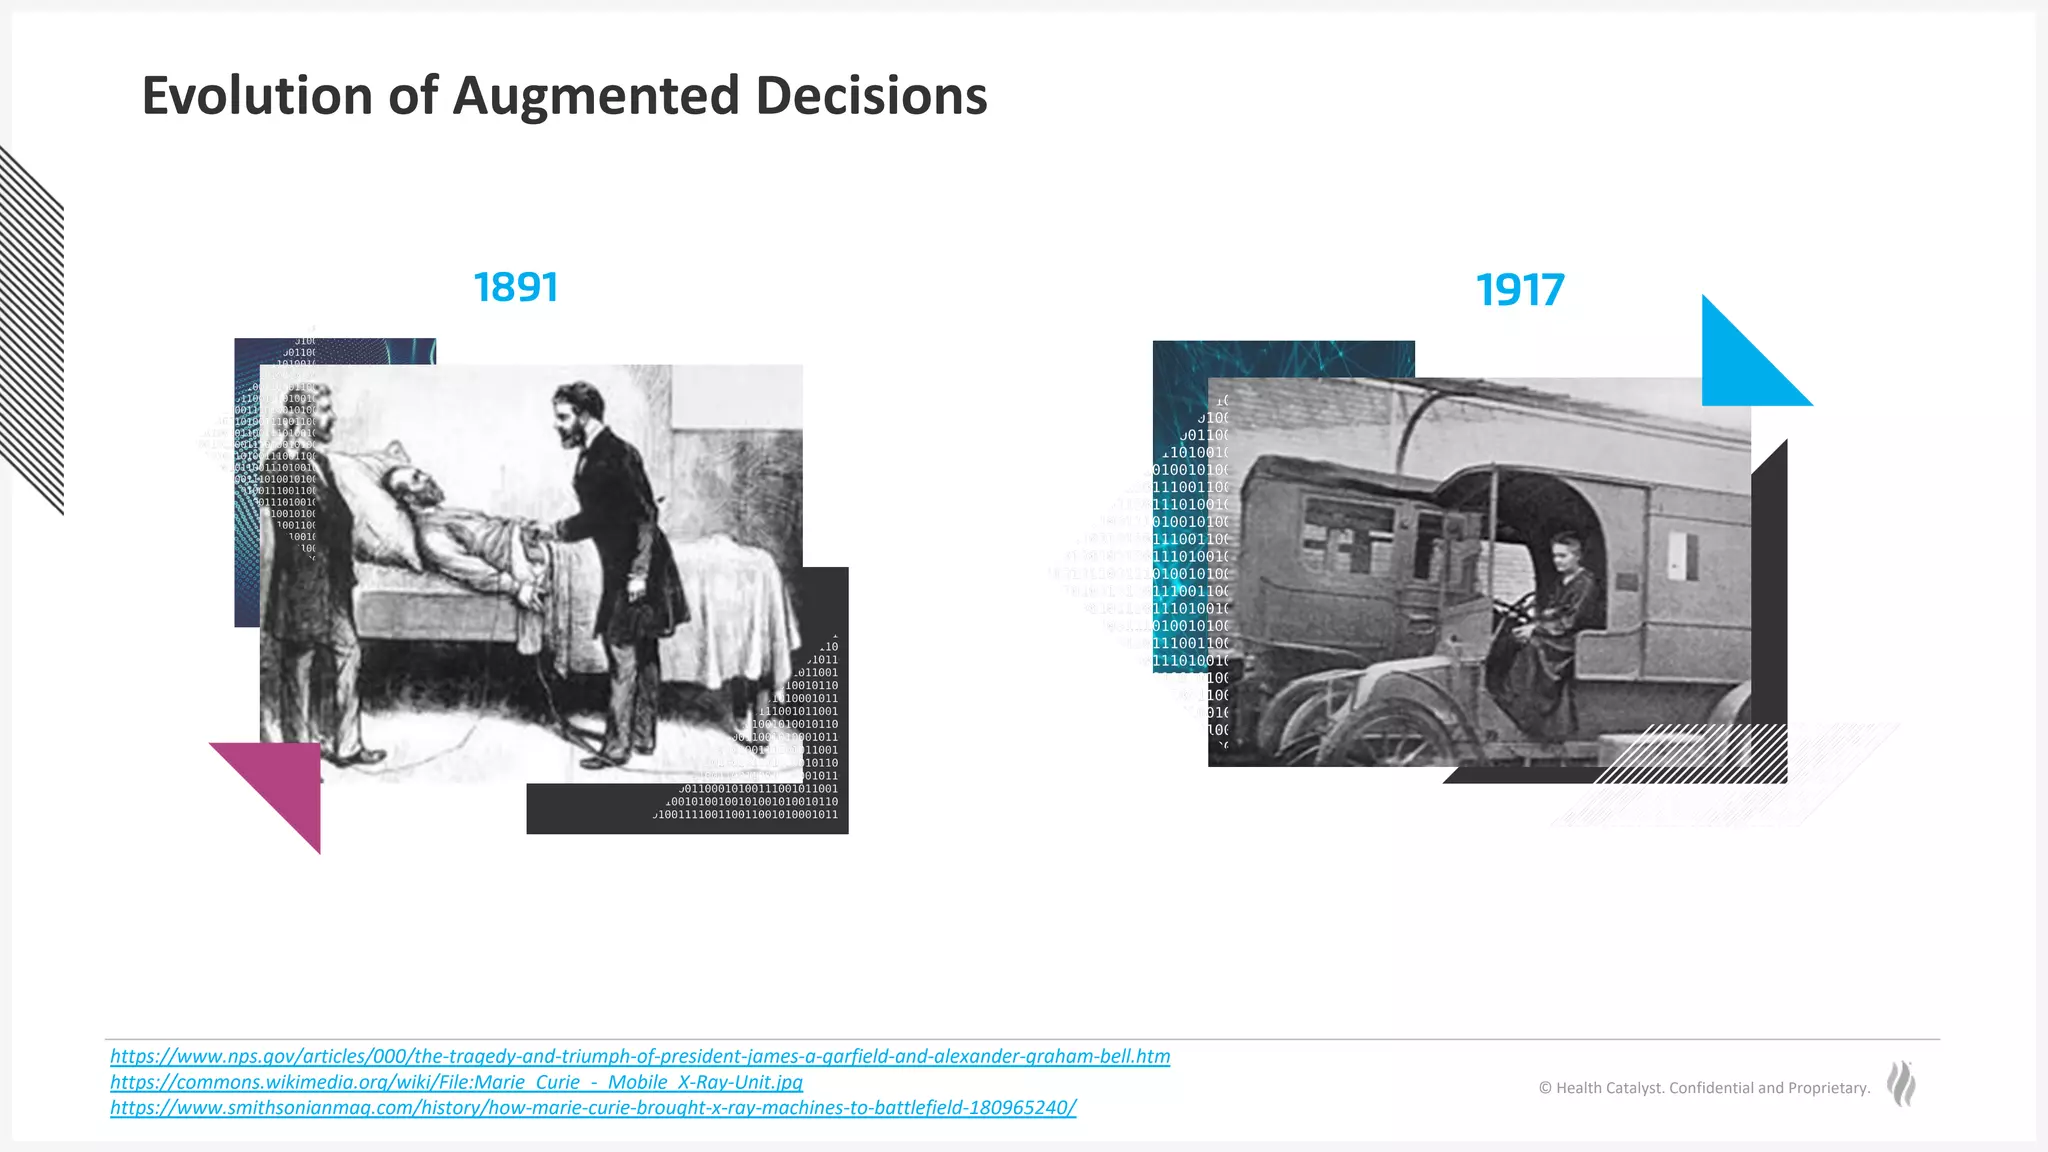
Evolution of Augmented Decisions
1891 1917
https://www.nps.gov/articles/000/the-tragedy-and-triumph-of-president-james-a-garfield-and-alexander-graham-bell.htm
https://commons.wikimedia.org/wiki/File:Marie_Curie_-_Mobile_X-Ray-Unit.jpg
https://www.smithsonianmag.com/history/how-marie-curie-brought-x-ray-machines-to-battlefield-180965240/
© Health Catalyst. Confidential and Proprietary.
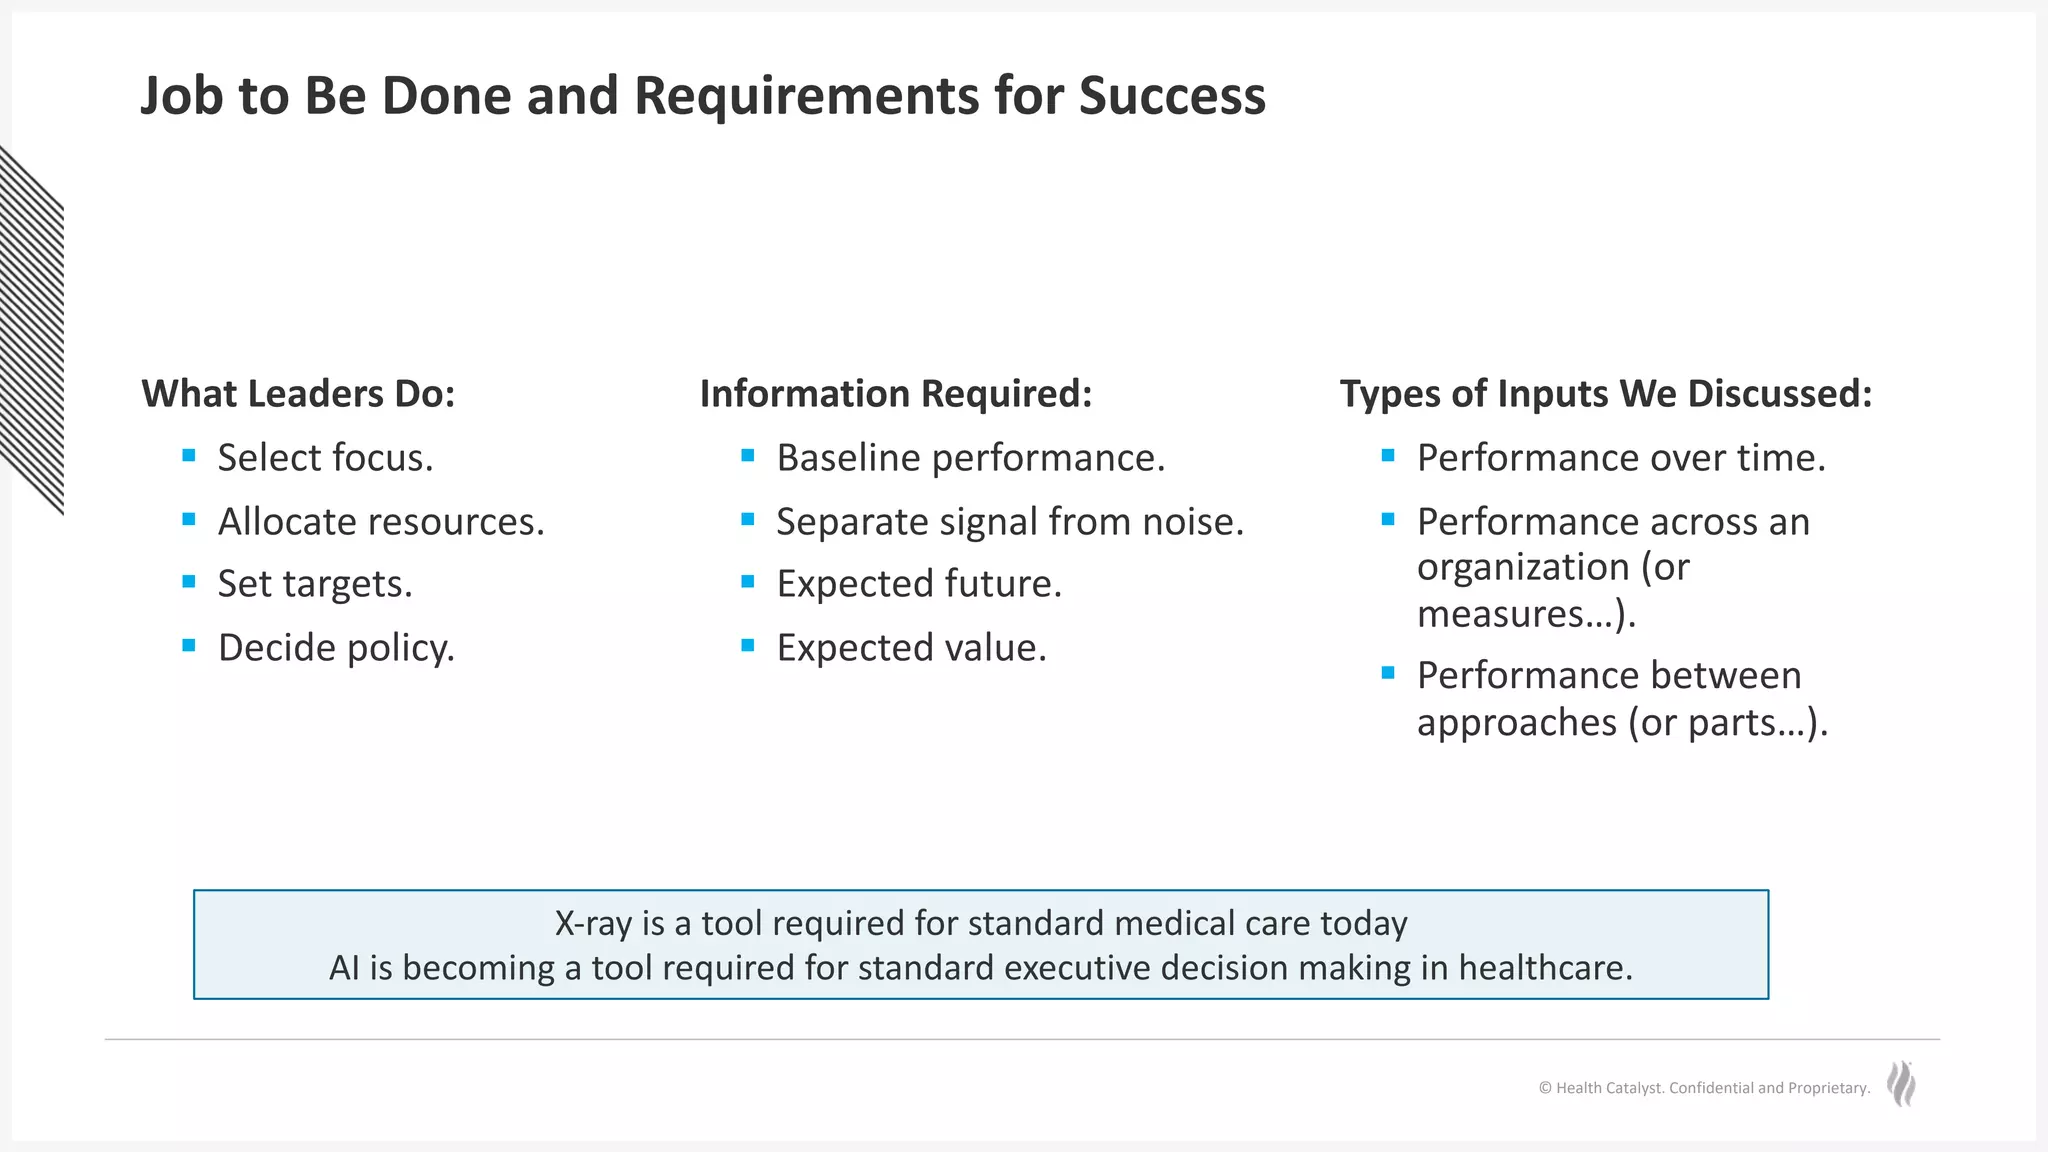
Job to Be Done and Requirements for Success
What Leaders Do:
§ Select focus.
§ Allocate resources.
§ Set targets.
§ Decide policy.
Information Required:
§ Baseline performance.
§ Separate signal from noise.
§ Expected future.
§ Expected value.
Types of Inputs We Discussed:
§ Performance over time.
§ Performance across an
organization (or
measures…).
§ Performance between
approaches (or parts…).
X-ray is a tool required for standard medical care today
AI is becoming a tool required for standard executive decision making in healthcare.
© Health Catalyst. Confidential and Proprietary.
Questions?
Jason Jones, PhD
Chief Analytics & Data Science Officer
General Manager of Platform
Health Catalyst
© Health Catalyst. Confidential and Proprietary.
Why Your Tools Are Failing You
Without accurate interpretation of analytics, healthcare leaders don’t
have real data-driven insight to know how to strategically improve
and measure wins and losses.
https://tinyurl.com/4afvukpu
Test Your Knowledge
4%
Only
are accurate