Download as PDF, PPTX

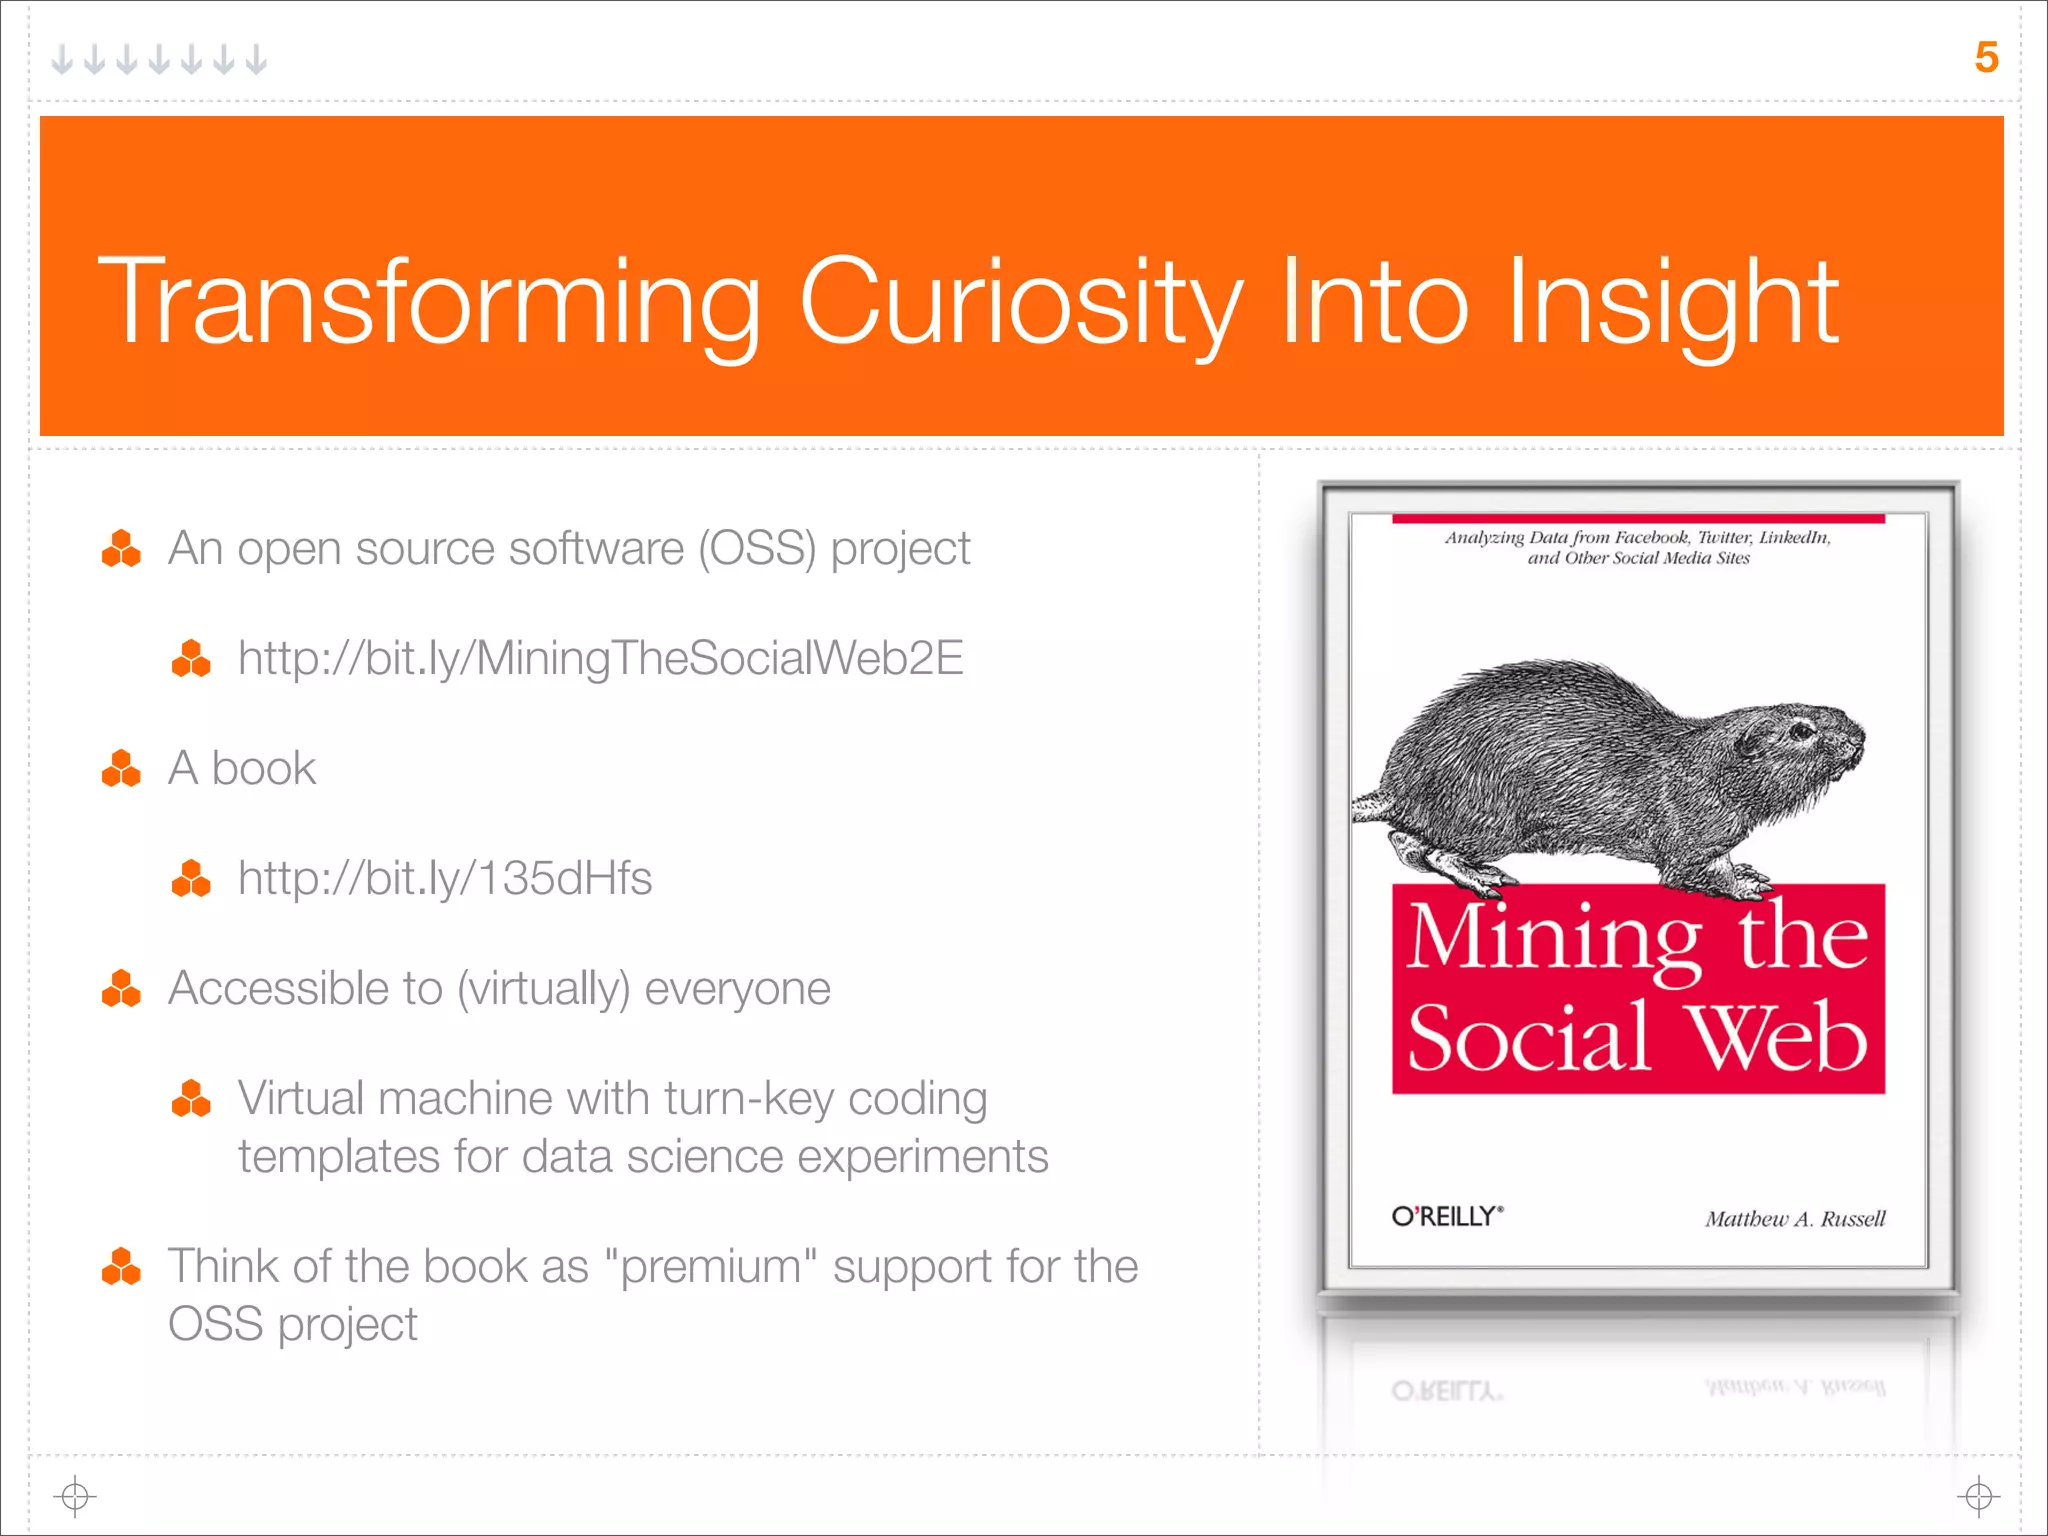


The document discusses the significance of Twitter as a platform for data science and predictive analytics, highlighting its role in understanding human behavior and modeling real-world events. It provides insights into Twitter's user dynamics, data mining techniques, and various applications while emphasizing an open-source project designed to support these efforts. The author shares a structured approach for data science experiments and offers numerous resources for further exploration.


![Vibe Coding vs. Spec-Driven Development [Free Meetup]](https://cdn.slidesharecdn.com/ss_thumbnails/vibecodingvsspecdrivendevelopment-251209105622-43f455e7-thumbnail.jpg?width=640&height=640&fit=bounds)


