Downloaded 102 times


![33
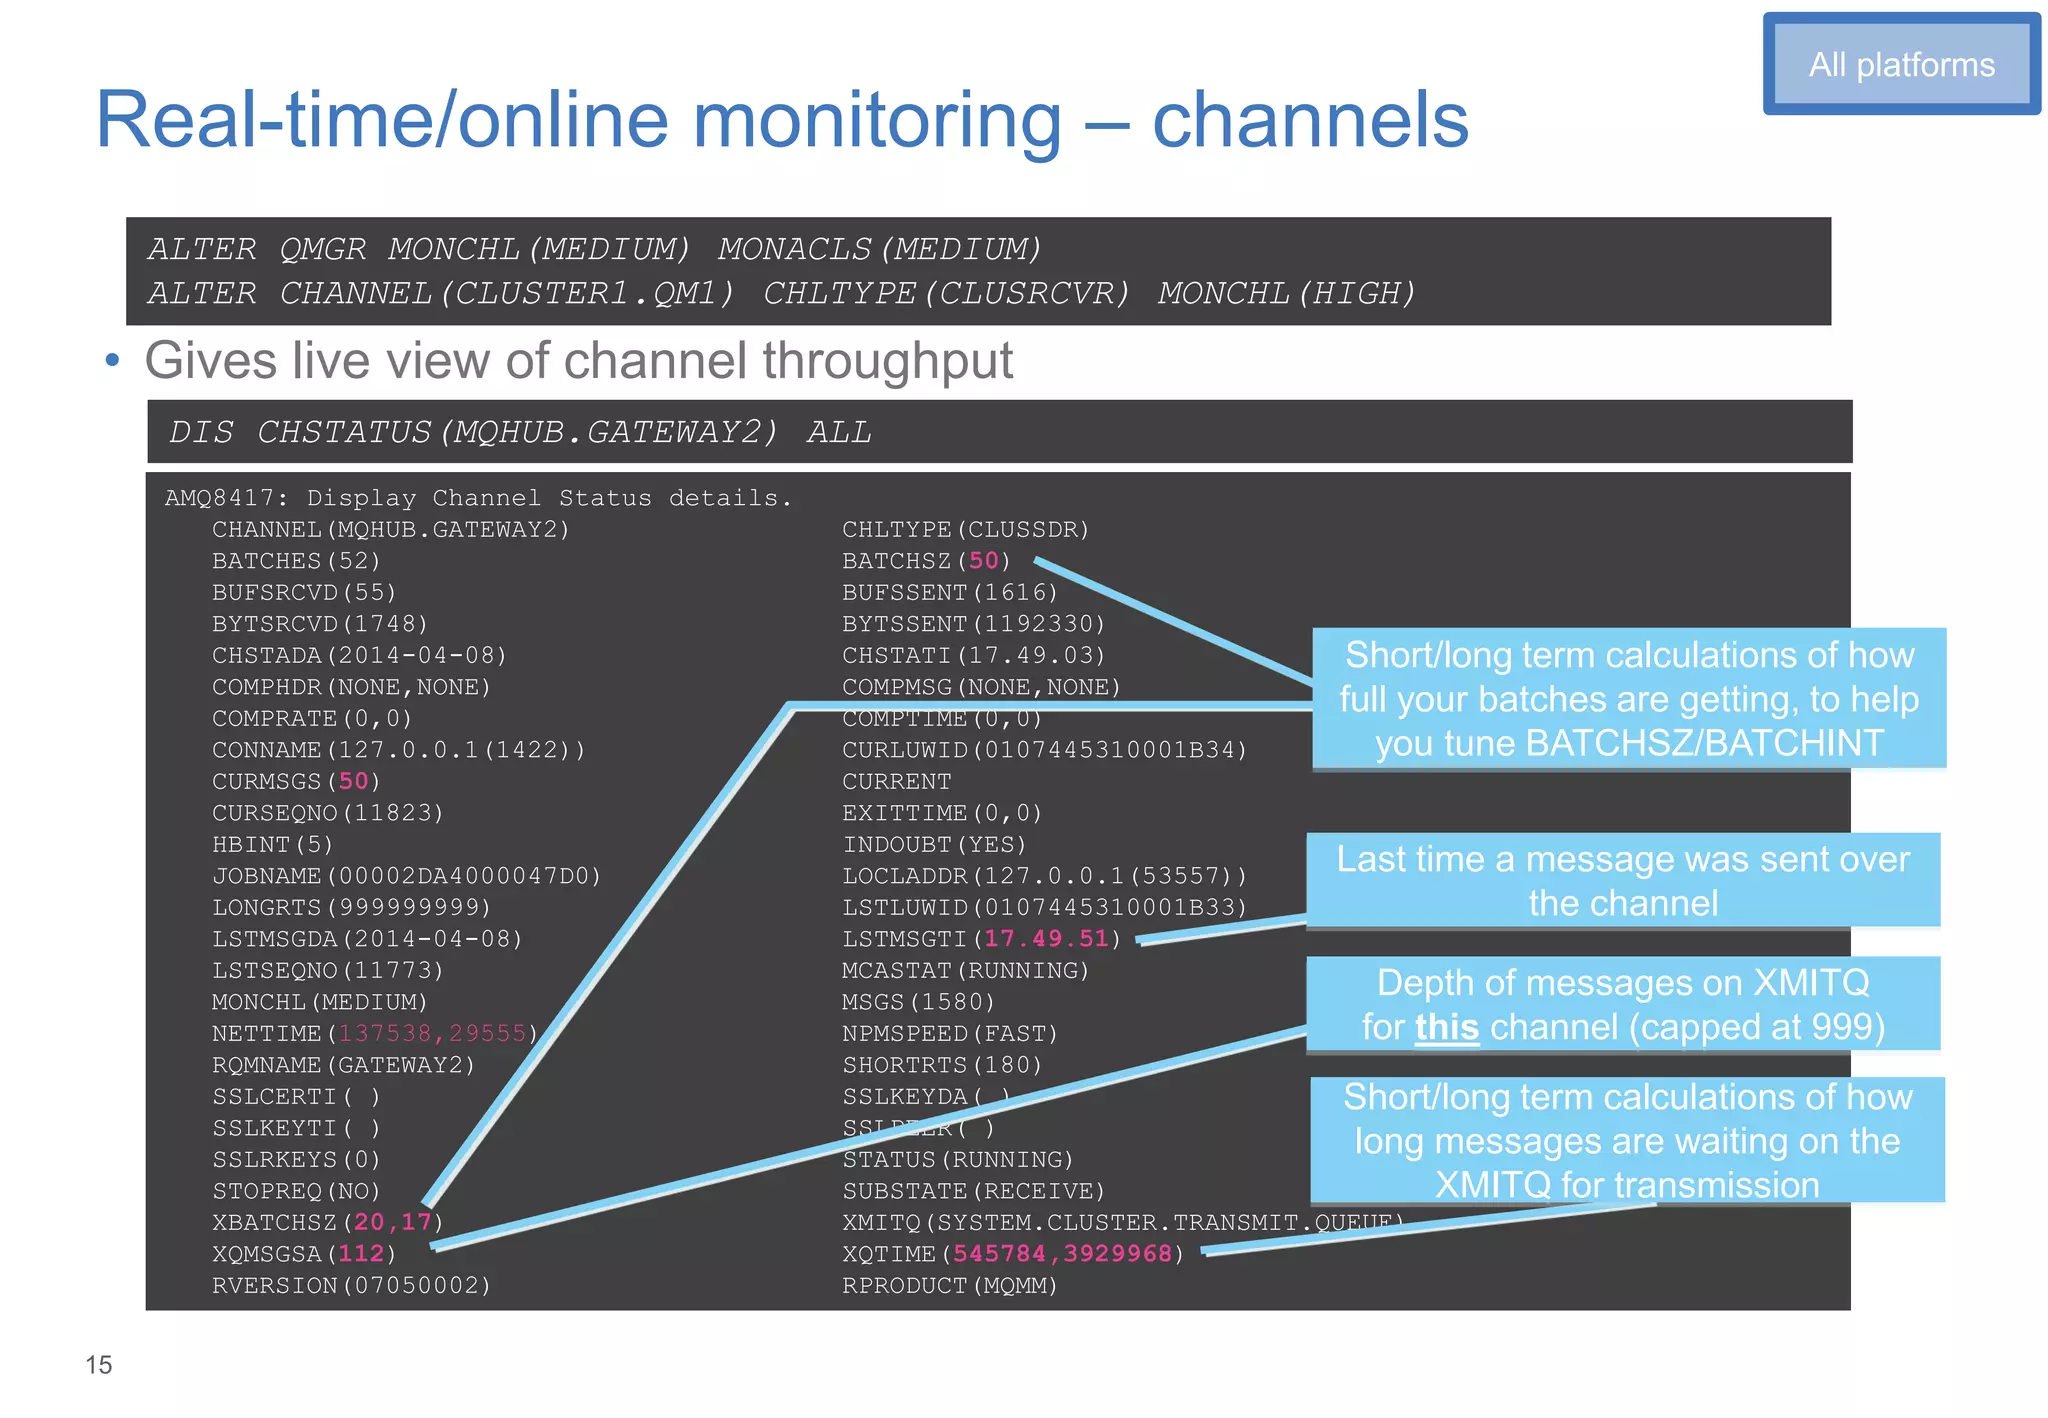
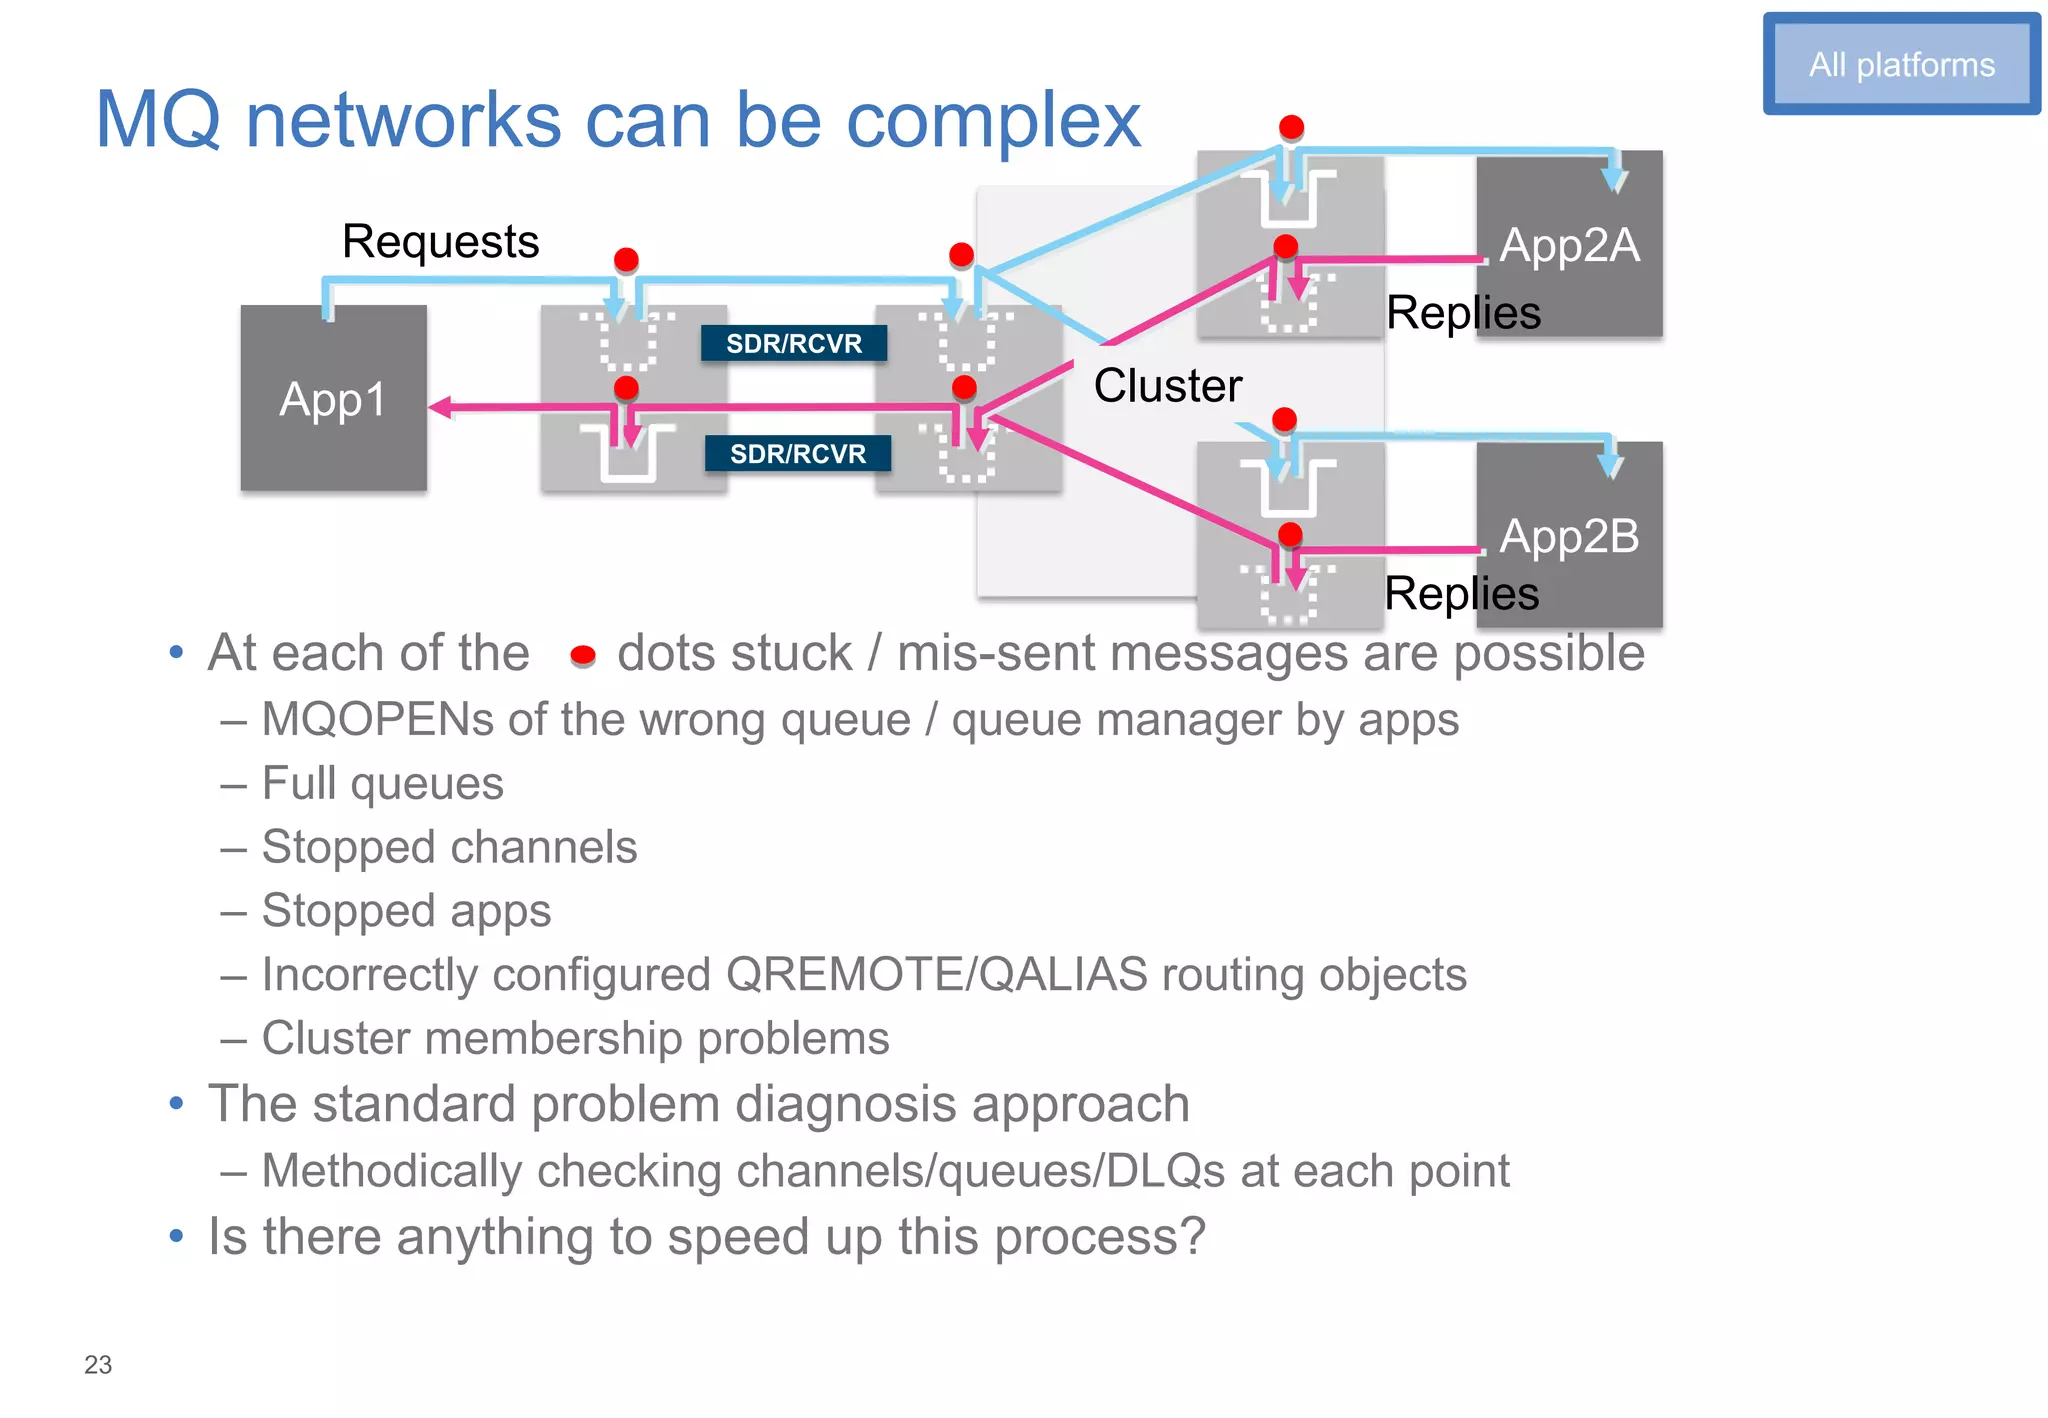
DISPLAY CONN
DISPLAY CONN(*) TYPE(HANDLE) ALL
AMQ8276: Display Connection details.
CONN(577C425321295301)
EXTCONN(414D5143474154455741593120202020)
TYPE(HANDLE)
OBJNAME(WLMMDB.REQUEST) OBJTYPE(QUEUE)
ASTATE(NONE) HSTATE(INACTIVE)
OPENOPTS(MQOO_OUTPUT,MQOO_FAIL_IF_QUIESCING)
READA(NO)
OBJNAME(SENDINGAPP.REPLY) OBJTYPE(QUEUE)
ASTATE(ACTIVE) HSTATE(ACTIVE)
OPENOPTS(MQOO_INPUT_SHARED,MQOO_INQUIRE,MQOO_SAVE_ALL_CONTEXT,MQOO_FAIL_IF_QUIESCING)
READA(NO)
AMQ8276: Display Connection details.
CONN(577C425321295301)
EXTCONN(414D5143474154455741593120202020)
TYPE(CONN)
PID(9740) TID(185)
APPLDESC(WebSphere MQ Channel) APPLTAG(jms/GATEWAY1_CF)
APPLTYPE(SYSTEM) ASTATE(NONE)
CHANNEL(WAS.CLIENTS) CONNAME(127.0.0.1)
CONNOPTS(MQCNO_SHARED_BINDING) USERID(pbroad)
UOWLOG( ) UOWSTDA(2014-04-08)
UOWSTTI(13.24.00) UOWLOGDA( )
UOWLOGTI( ) URTYPE(XA)
EXTURID(XA_FORMATID[DSAW]
XA_GTRID[00000145414B8AB40000000104DF48FC0001020304050607080900010203040506070809]
XA_BQUAL[00000145414B8AB40000000104DF48FC0001020304050607080900010203040506070809000000010000000000000000
000000000001])
QMURID(0.7940075) UOWSTATE(ACTIVE)
Use CONN to match TYPE(CONN) and
TYPE(HANDLE) records
TYPE(HANDLE) records let you find
applications by the objects they access.
See all open handles for an app in one place,
unlike DIS QSTATUS records
Long running UOW information.
XID can be tied up with app server txn timeout
Channel name + IP help identify client apps.
MQ V7.5 and later JMS clients can supply
an application name in the CF
3
DISPLAY CONN(*) ALL
All platforms](https://image.slidesharecdn.com/6889-170329191828/75/Where-is-My-Message-4-2048.jpg)


![18
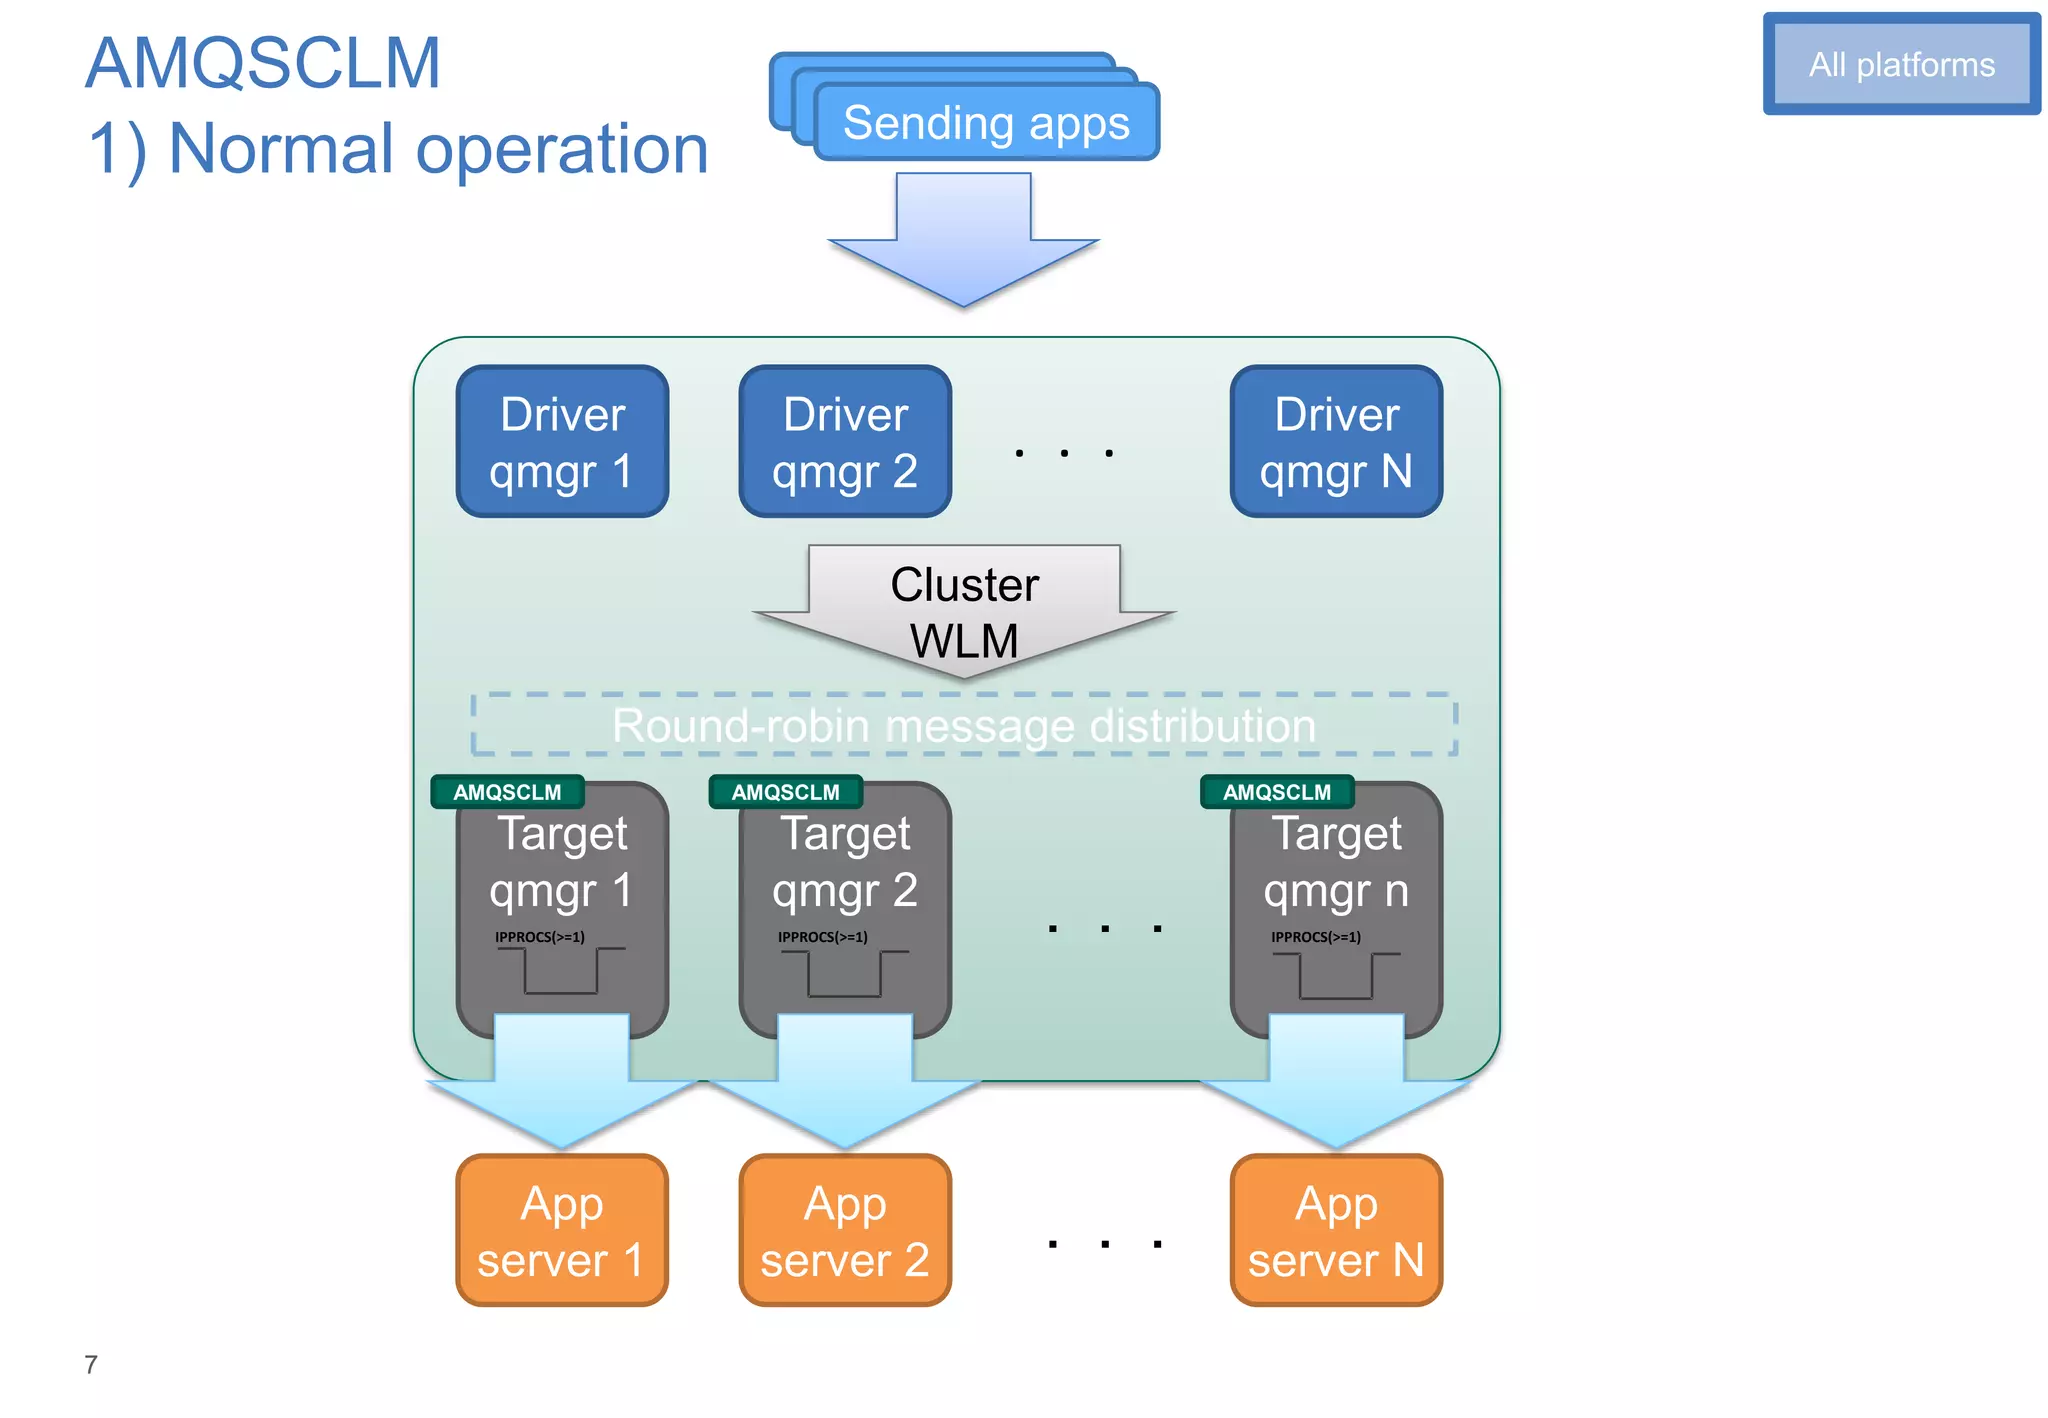
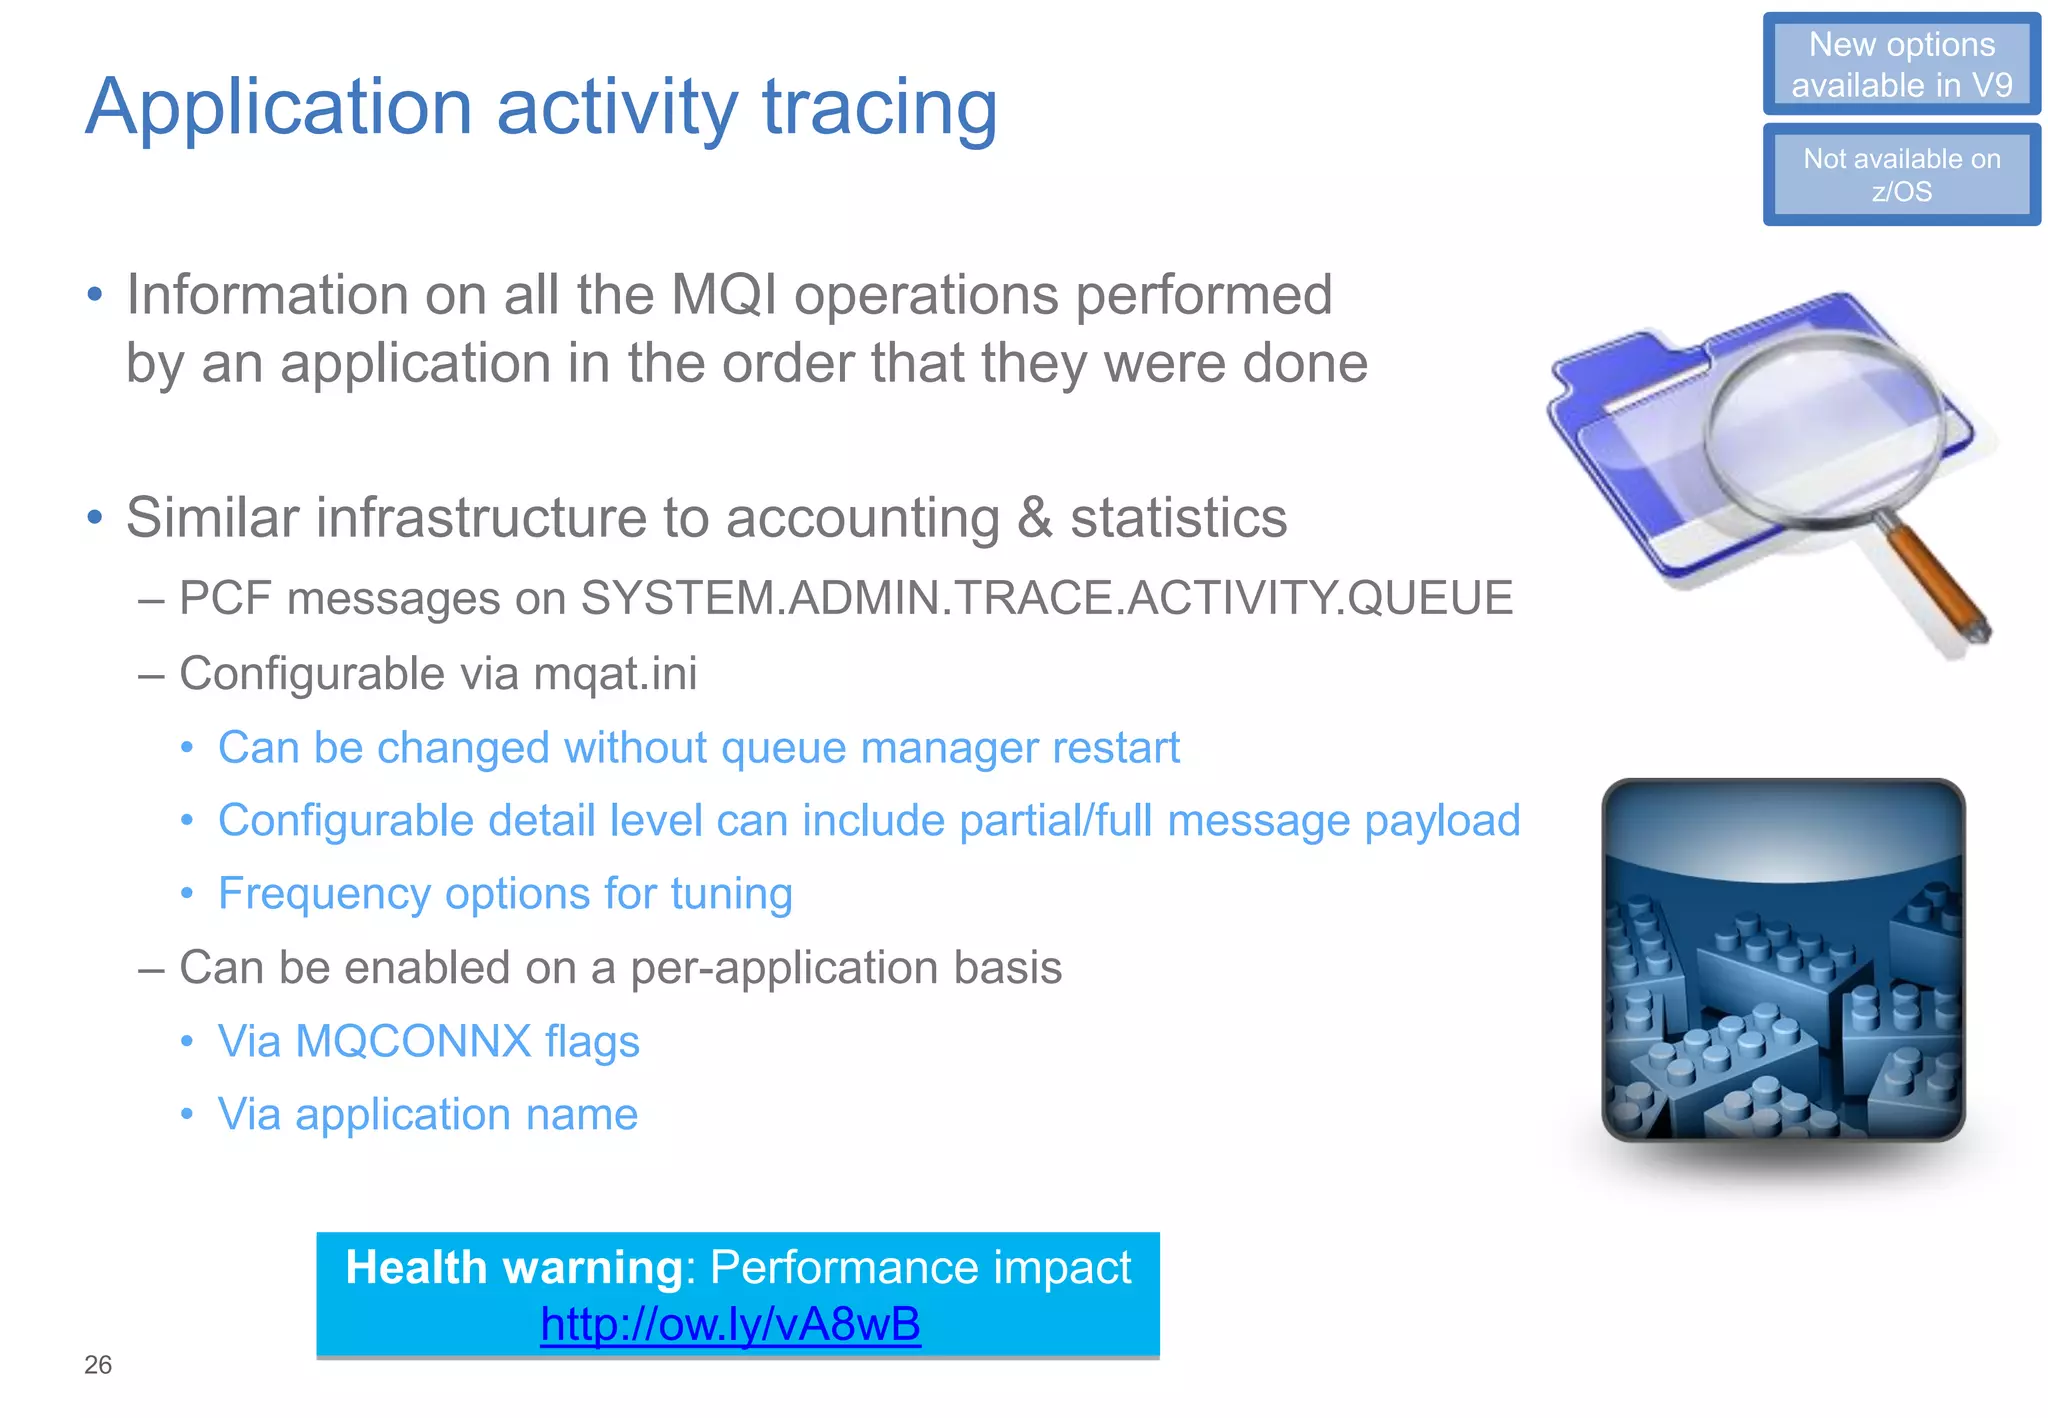
Simple practical example using amqsmon
• Overall QMGR busyness
• Simple data format
– Multiple values are
[Persistent, NonPersistent]
• One message every X seconds
– Use amqsmon directly (perl/cron)
• Low/high water marks for
subscriptions
– Grouped by subscription type
• amqsmon is a sample so you can
use it as a base for your own tools
ALTER QMGR STATMQI(ON)
Wait a bit, but not the default 30 minutes between stats records
RESET QMGR TYPE(STATISTICS)
amqsmon -m GATEWAY1 -t statistics -a -w 0
MonitoringType: MQIStatistics
QueueManager: 'GATEWAY1'
IntervalStartDate: '2014-04-09'
IntervalStartTime: '00.00.35'
IntervalEndDate: '2014-04-09'
IntervalEndTime: '00.01.13'
CommandLevel: 700
ConnCount: 35
PutCount: [271, 0]
PutFailCount: 0
Put1Count: [2, 0]
Put1FailCount: 0
PutBytes: [273976, 0]
GetCount: [270, 0]
GetBytes: [269468, 0]
GetFailCount: 19
DurableSubscriptionHighWater: [0, 0, 0, 0]
DurableSubscriptionLowWater: [0, 0, 0, 0]
NonDurableSubscriptionHighWater: [0, 0, 0, 0]
NonDurableSubscriptionLowWater: [0, 0, 0, 0]
PutTopicCount: [0, 0]
PutTopicFailCount: 0
Put1TopicCount: [0, 0]
Put1TopicFailCount: 0
PutTopicBytes: [0, 0]
PublishMsgCount: [0, 0]
PublishMsgBytes: [0, 0]
1
New options
available in V9
Different on z/OS
SMF used instead](https://image.slidesharecdn.com/6889-170329191828/75/Where-is-My-Message-18-2048.jpg)

![20
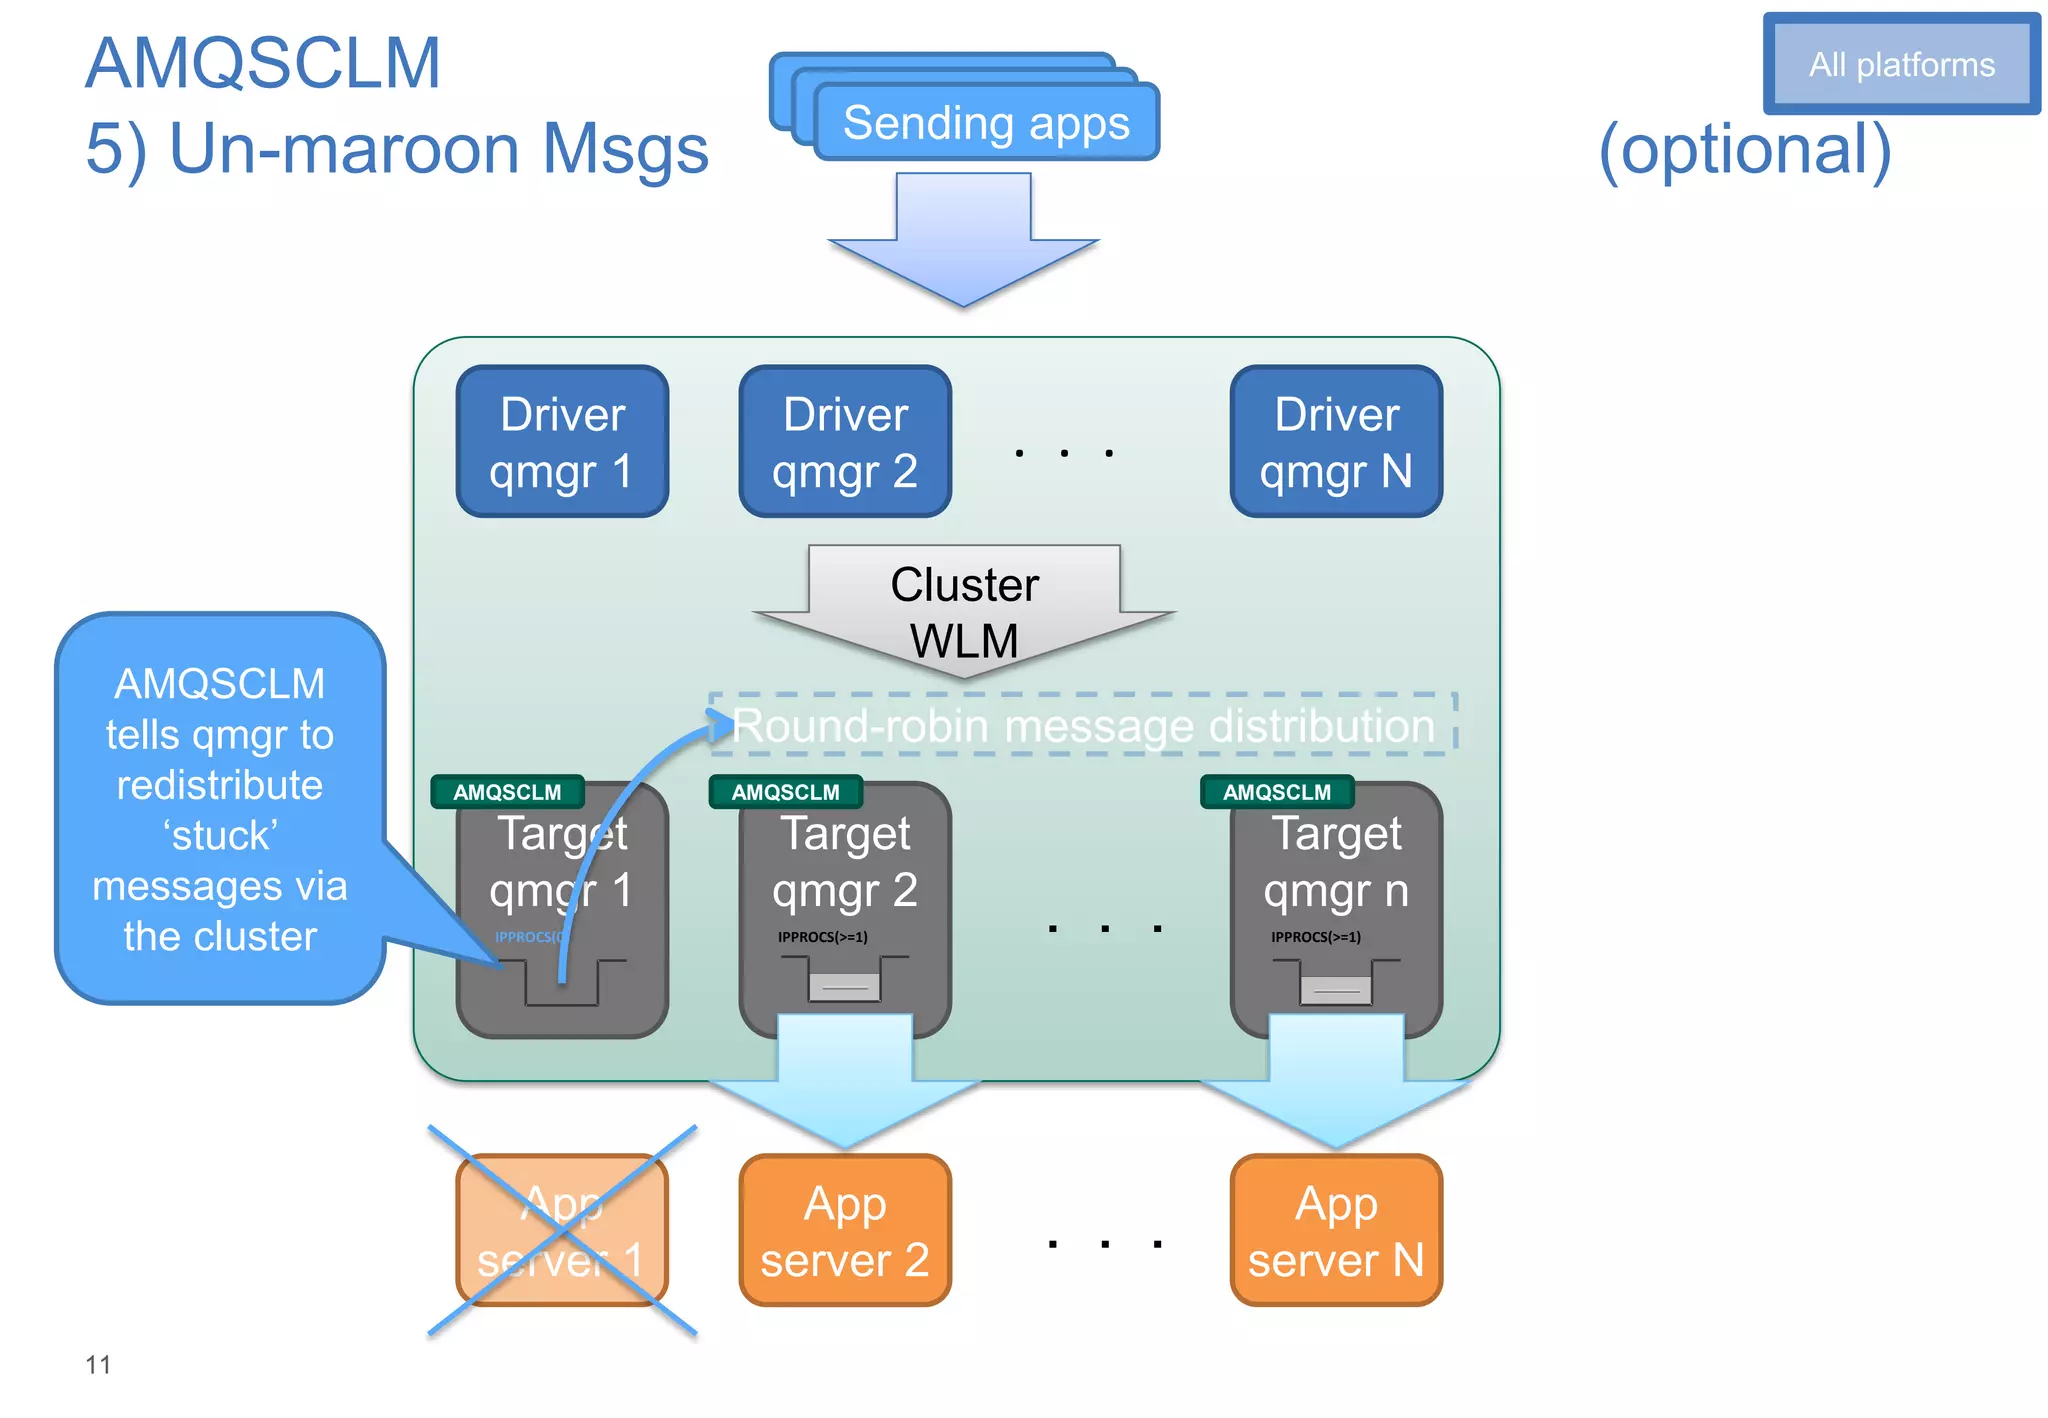
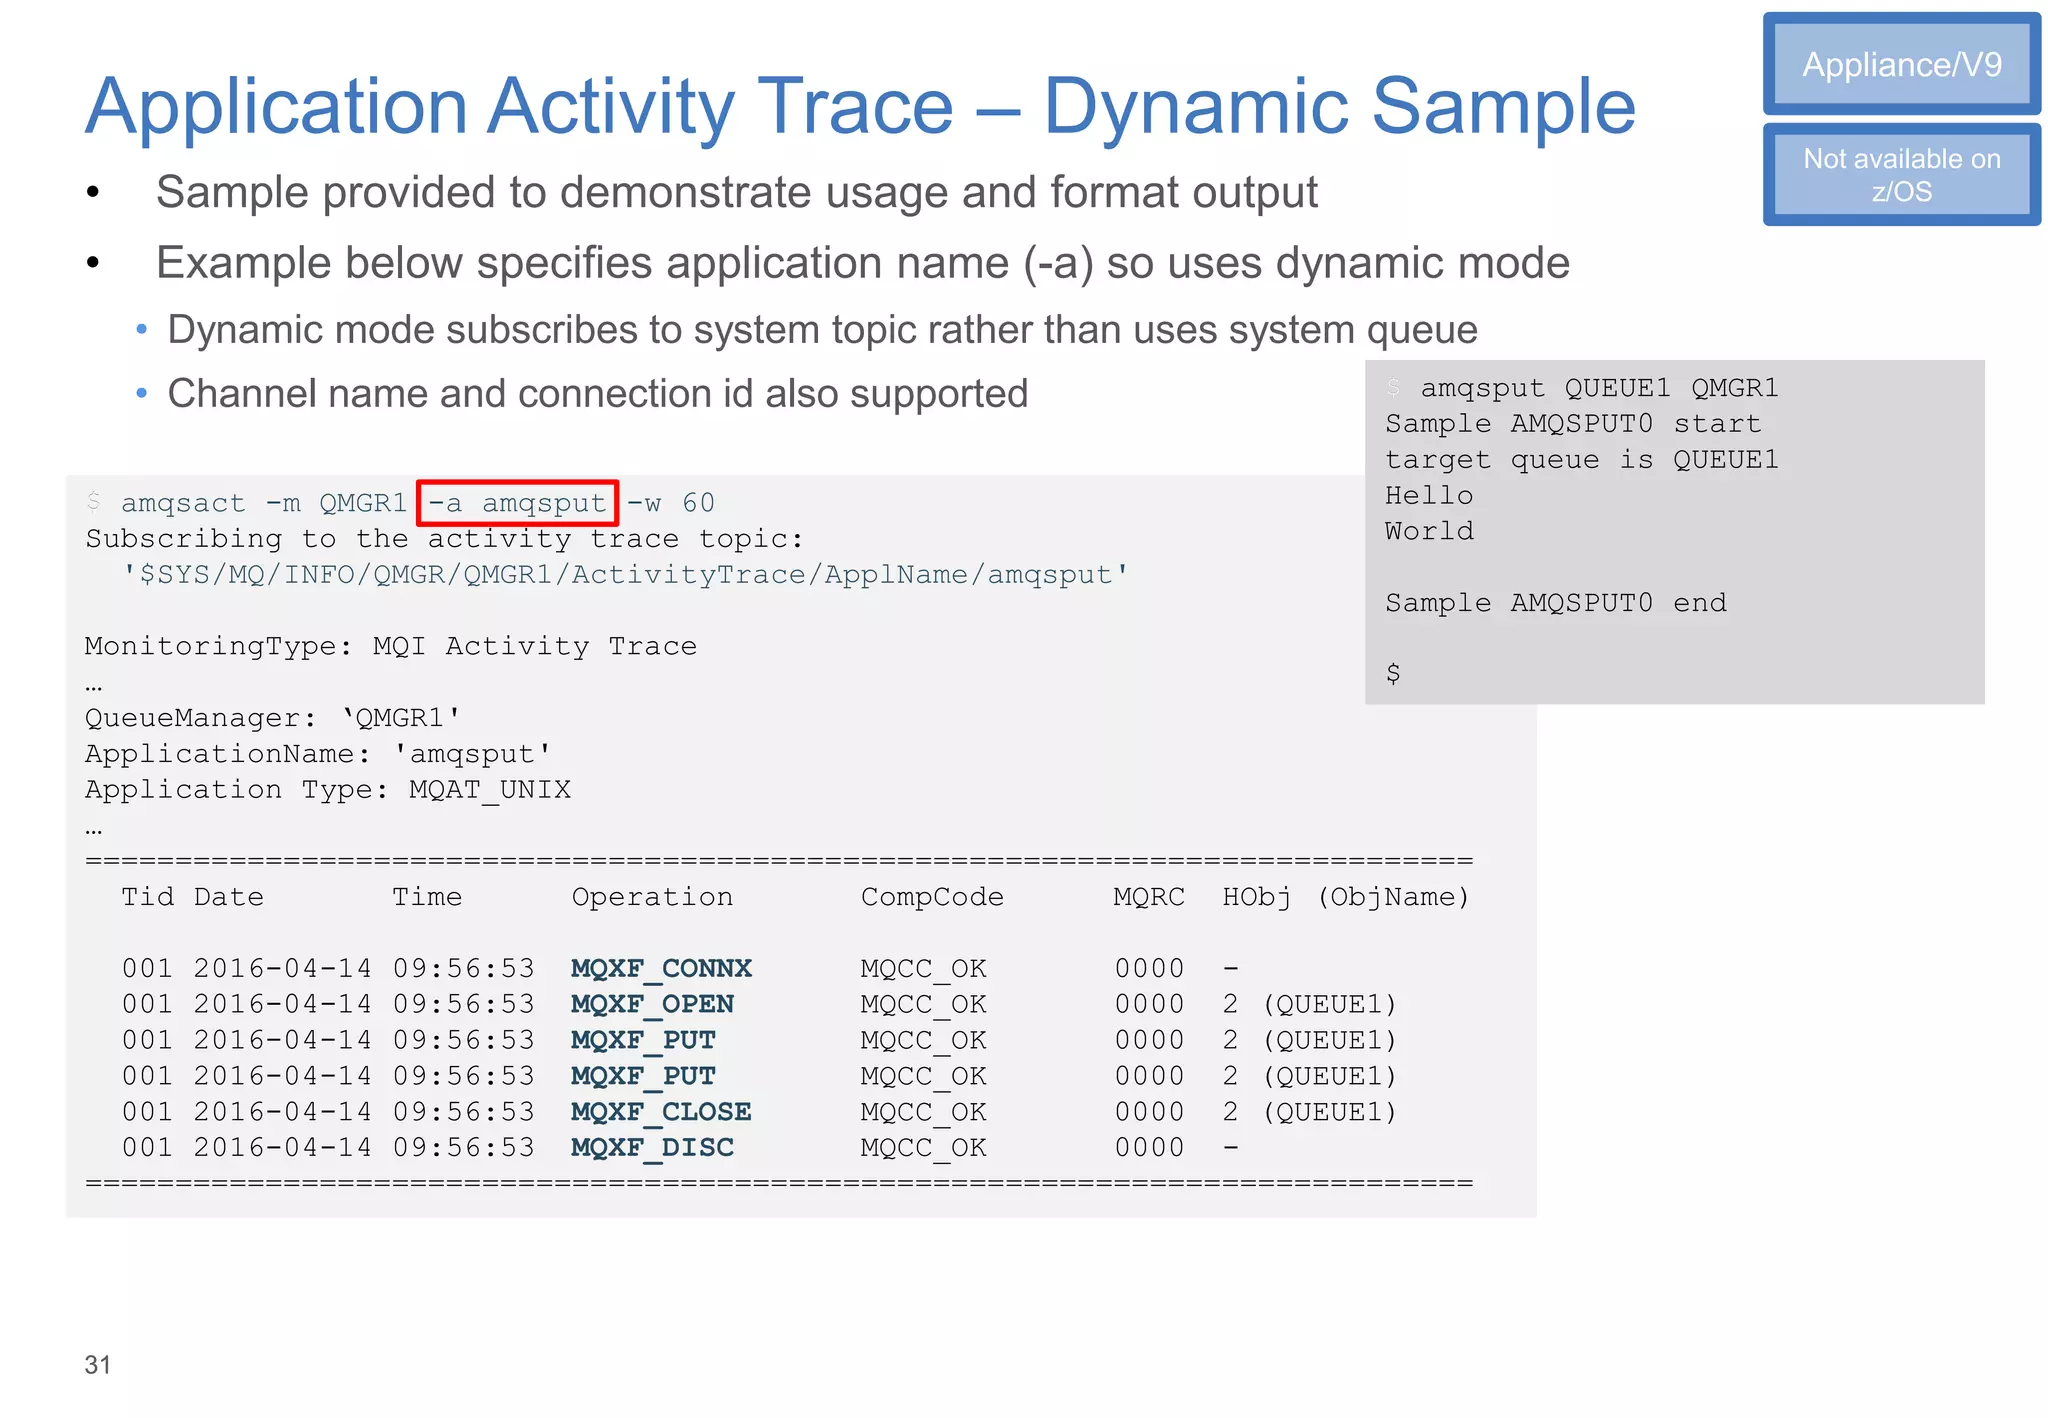
System Monitoring
• Familiar statistics available through subscriptions
– Queue manager wide statistics (connects, disconnects, opens, closes, puts, gets, …)
– Queue level statistics (opens, closes, puts, gets, …)
– NB: statistics available from system topics is not a 1-1 mapping to those available from system queues
• E.g no channel statistics, some missing information, some new information, some merged information
– No support for accounting data
• Extended to include CPU and Disk usage. For example…
– Queue manager CPU time, memory usage
– Disk reads/writes, disk latency,
• Subscribe to meta-topic to learn which classes of statistics are available
– $SYS/MQ/INFO/QMGR/QMGR1/Monitor/METADATA/CLASSES
– Then subscribe to specific topics
• $SYS/MQ/INFO/QMGR/QMGR-NAME/Monitor/class[/instance]/type]
– See amqsrua sample program
Appliance/V9
Not available on
z/OS.](https://image.slidesharecdn.com/6889-170329191828/75/Where-is-My-Message-20-2048.jpg)


![36
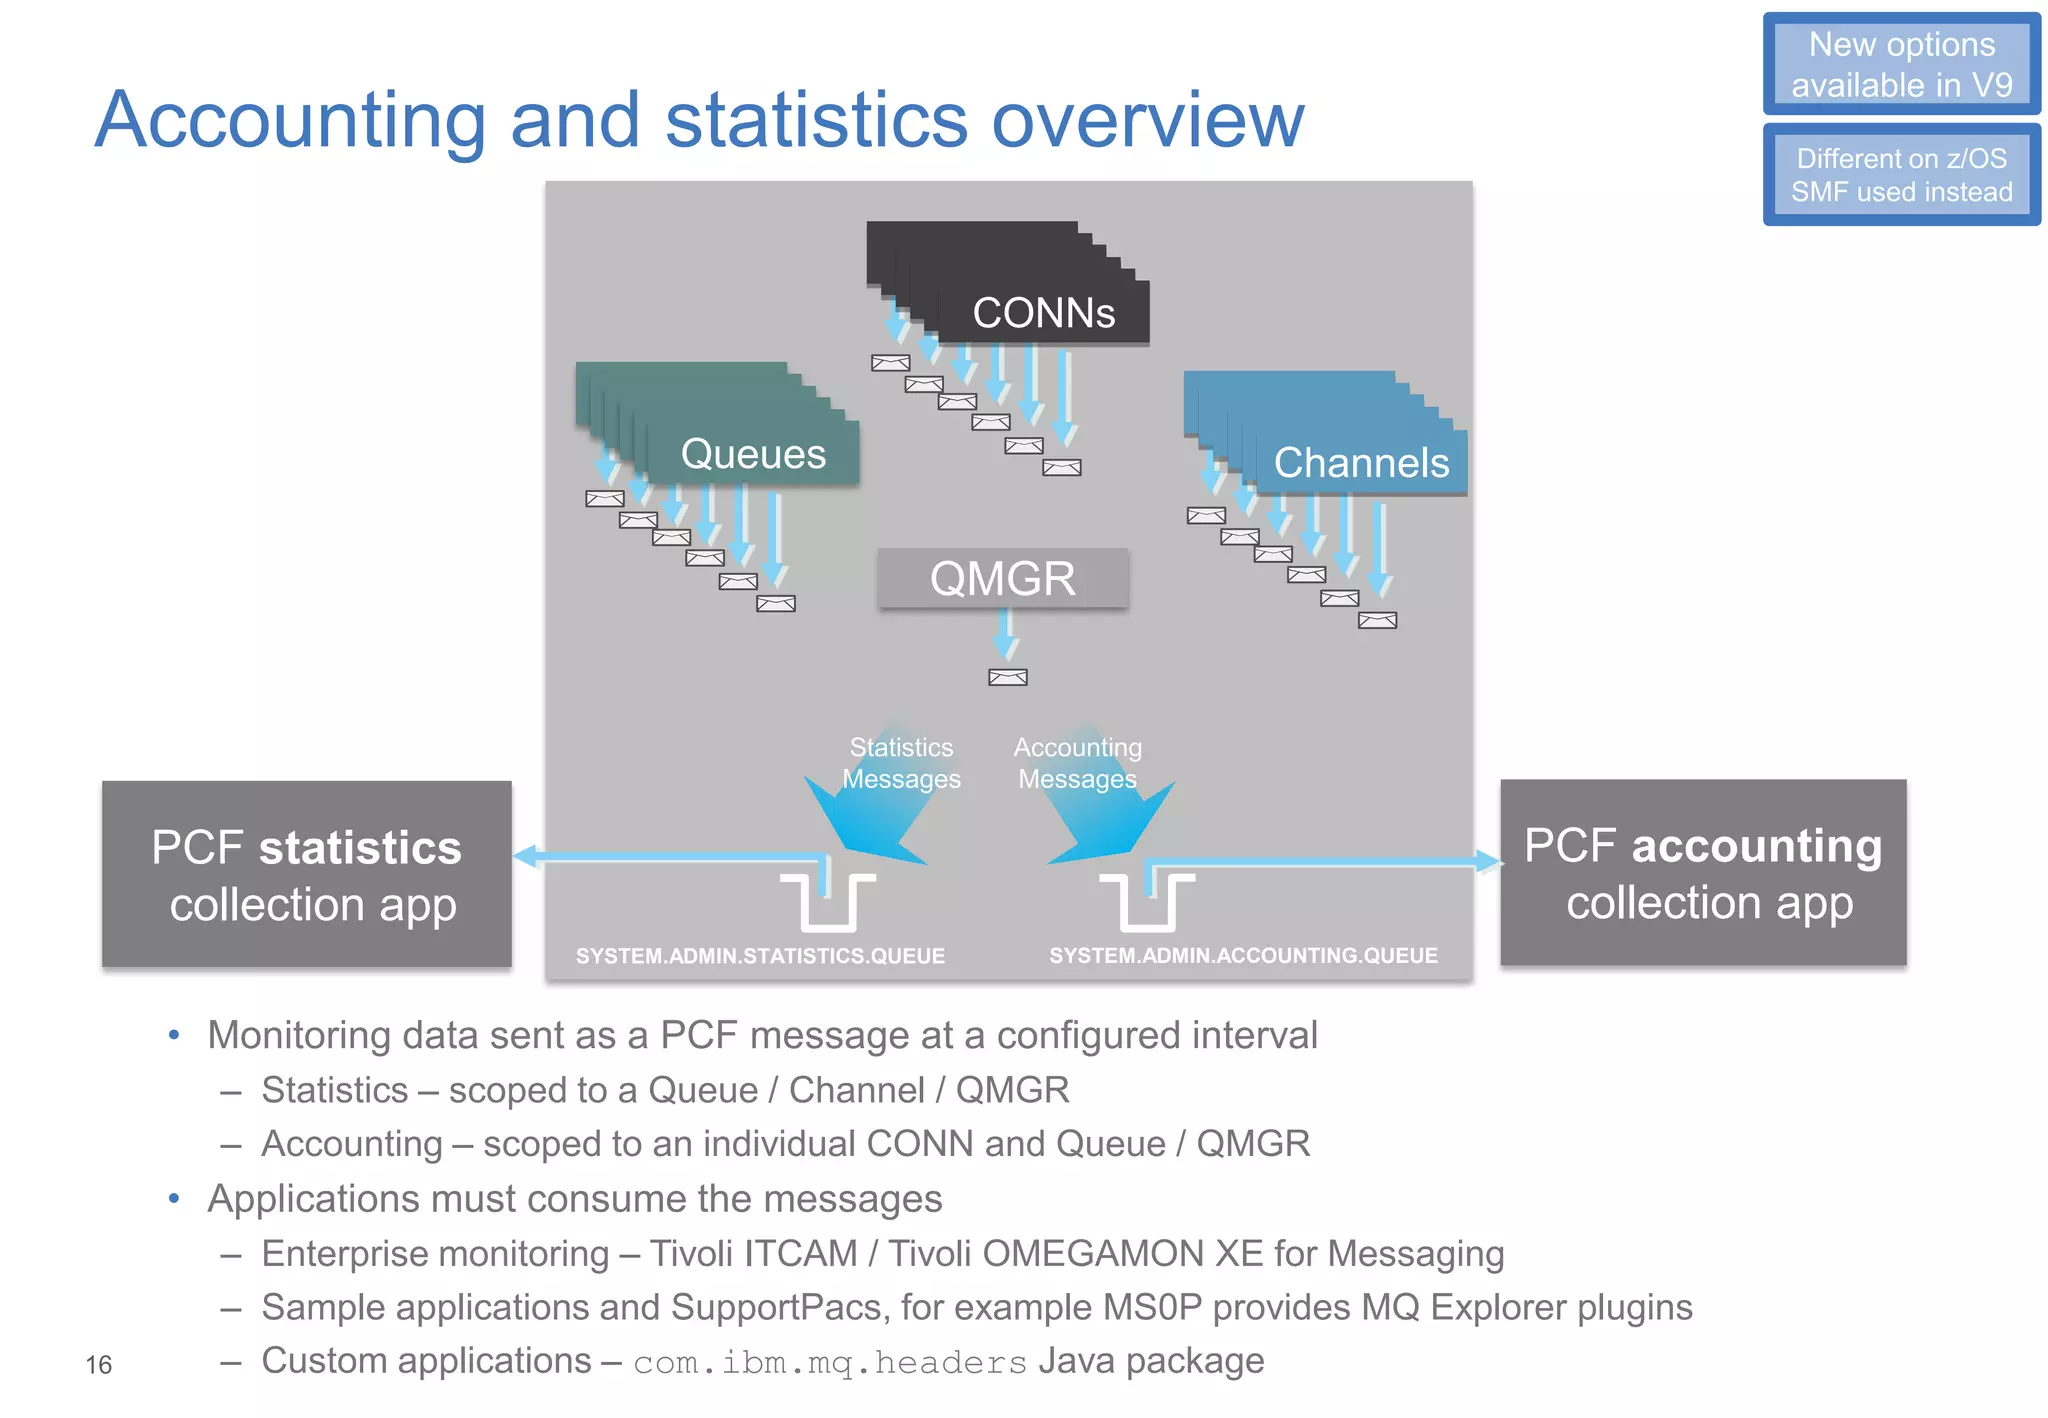
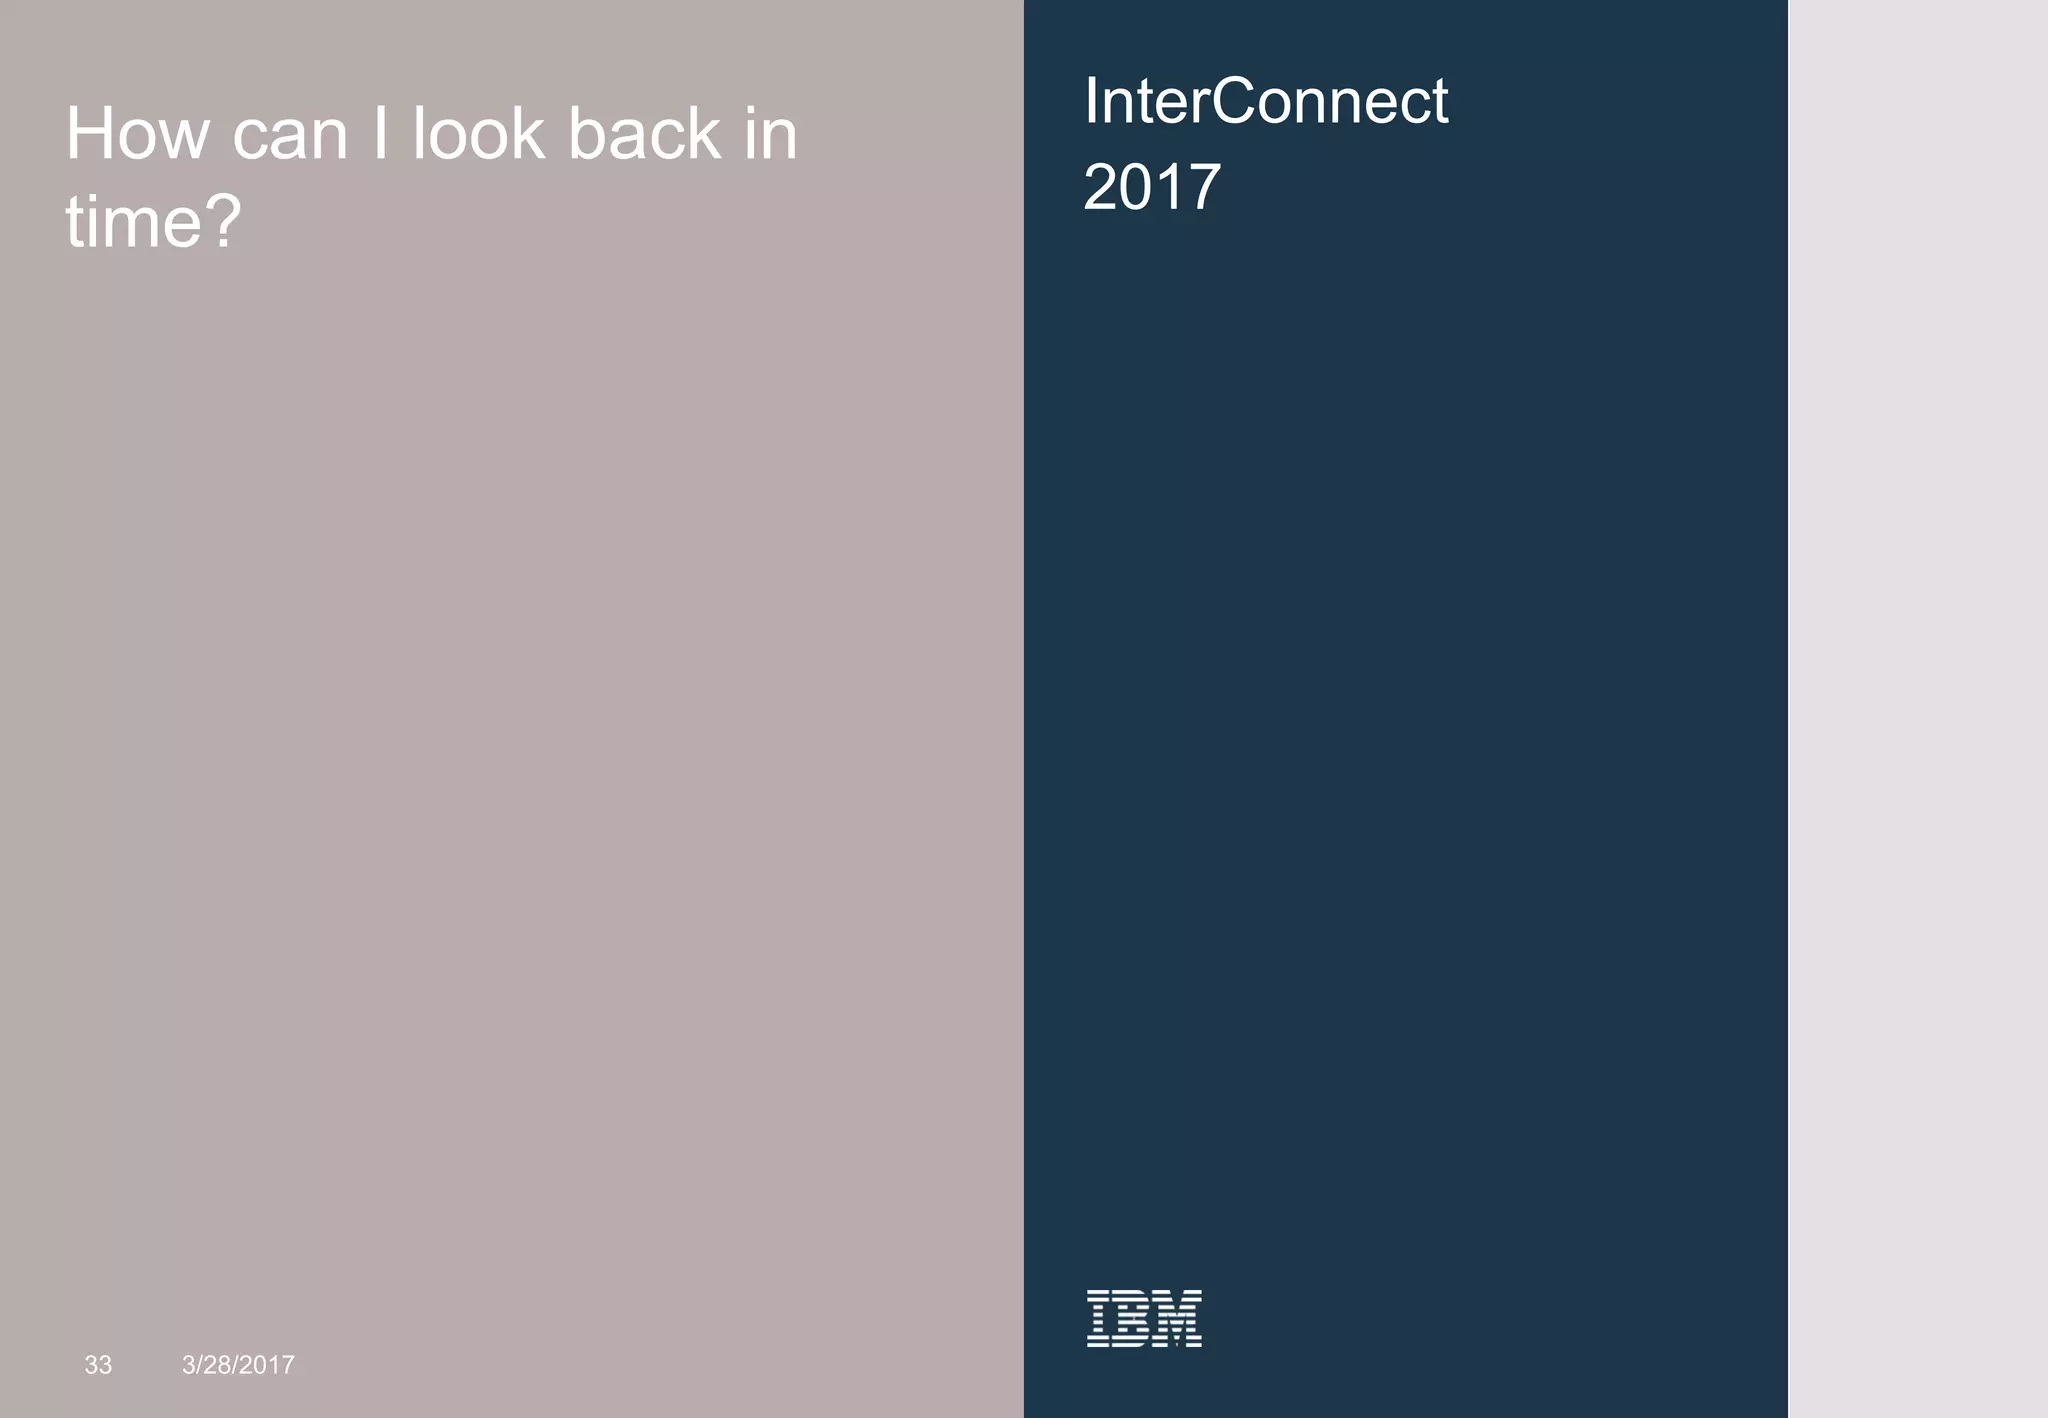
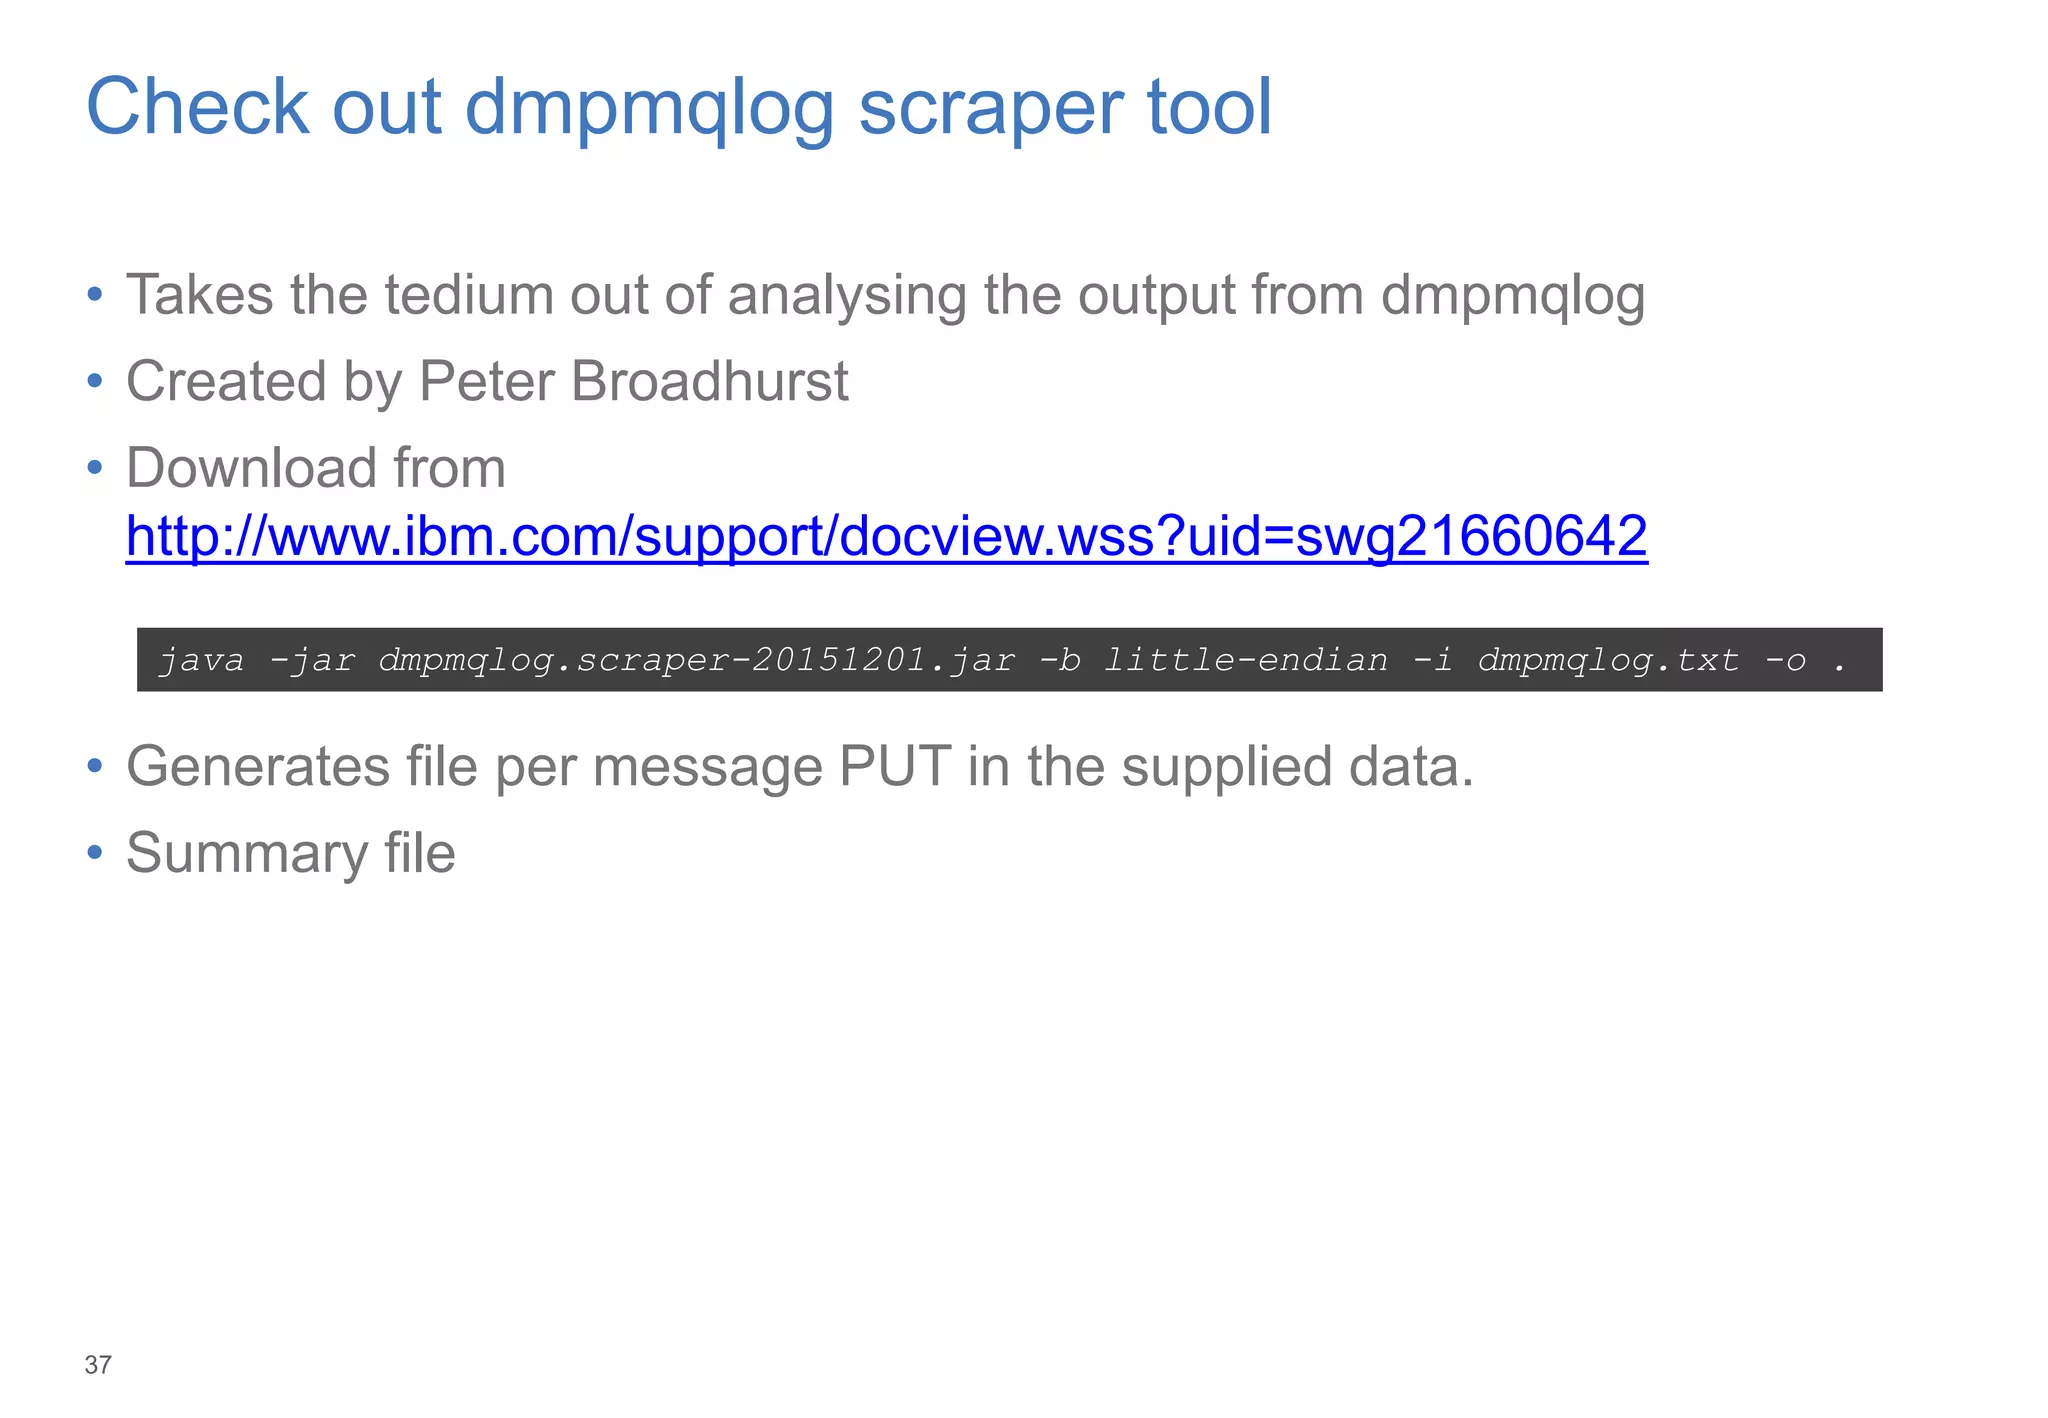
dmpmqlog output is readable, but analysis is tedious
• Wouldn't it be easier to let
the computer do the
tedious bit?
LOG RECORD - LSN <0:0:954:44817>
**********
HLG Header: lrecsize 873, version 1, rmid 0, eyecatcher HLRH
LogRecdType . . : AQM Put Message (257)
Eyecatcher . . : ALRH Version . . . . : 1
LogRecdLen . . : 853 LogRecdOwnr . . : 256 (AQM)
XTranid . . . . : TranType: XA
XID: formatID 1463898948, gtrid_length 36, bqual_length 54
gtrid [000001430B3C84EF000000010000002734721FAD52A950DDA913D08C5C13719A34E164F2]
bqual
[000001430B3C84EF000000010000002734721FAD52A950DDA913D08C5C13719A34E164F20000000100000000000
00000000000000001]
QueueName . . . : Not known
Qid . . . . . . : {Hash 2147211283, Counter: 5}
ThisLSN . . . . : <0:0:0:0>
PrevLSN . . . . : <0:0:954:43944>
Version . . . . : 4
MapIndex . . . : 199
PrevLink.Locn . : 102408 PrevLink.Length : 8
PrevDataLink . : {High 0, Low 103424}
Data.Locn . . . : 103424 Data.Length . . : 613
Data . . . . . :
00000: 41 51 52 48 04 00 00 00 FF FF FF FF FF FF FF FF AQRH....ÿÿÿÿÿÿÿÿ
00016: 00 00 00 00 00 00 00 00 C7 00 00 00 02 00 C0 01 ........Ç.......
00032: 00 00 00 00 04 00 01 00 A5 00 00 00 00 00 00 00 ........¥.......
00048: 63 00 00 00 41 4D 51 20 49 49 42 30 31 5F 51 4D c...AMQ IIB01_QM
00064: 20 20 20 20 D9 26 B0 52 20 08 53 F5 30 30 30 30 .&.R .Sõ0000
00080: 30 30 39 39 00 00 00 00 00 00 00 00 00 00 00 00 0099............
00096: 00 00 00 00 00 00 00 00 00 00 00 00 00 00 00 00 ................
00112: 00 00 00 00 00 00 00 00 00 00 00 00 01 00 00 00 ................
00128: 00 00 00 00 FF FF FF FF 00 00 00 00 04 00 00 09 ....ÿÿÿÿ........
00144: 00 00 00 00 E3 ED 04 80 10 FD 67 E4 FF FF FF FF ....ãí.€.ýgäÿÿÿÿ
00160: 4D 44 20 20 01 00 00 00 00 00 00 00 08 00 00 00 MD ............
00176: 00 00 00 00 11 01 00 00 B8 04 00 00 4D 51 48 52 ........¸...MQHR
00192: 46 32 20 20 04 00 00 00 01 00 00 00 20 20 20 20 F2 ........
00208: 20 20 20 20 20 20 20 20 20 20 20 20 20 20 20 20
00224: 20 20 20 20 20 20 20 20 20 20 20 20 20 20 20 20
00240: 20 20 20 20 20 20 20 20 20 20 20 20 49 49 42 30 IIB0
00256: 31 5F 51 4D 20 20 20 20 20 20 20 20 20 20 20 20 1_QM
00272: 20 20 20 20 20 20 20 20 20 20 20 20 20 20 20 20
00288: 20 20 20 20 20 20 20 20 20 20 20 20 4D 55 53 52 MUSR
00304: 5F 4D 51 41 44 4D 49 4E 16 01 05 15 00 00 00 64 _MQADMIN.......d
00320: 20 3E AC 57 48 B3 09 B8 71 B0 4C F2 03 00 00 00 >¬WH..¸q.Lò....
00336: 00 00 00 00 00 00 00 0B 20 20 20 20 20 20 20 20 ........
00352: 20 20 20 20 20 20 20 20 20 20 20 20 20 20 20 20
00368: 20 20 20 20 20 20 20 20 1C 00 00 00 57 65 62 53 ....WebS
00384: 70 68 65 72 65 20 4D 51 20 43 6C 69 65 6E 74 20 phere MQ Client
00400: 66 6F 72 20 4A 61 76 61 32 30 31 33 31 32 31 39 for Java20131219
00416: 31 34 32 32 33 32 32 32 20 20 20 20 00 00 00 00 14223222 ....
00432: A4 00 00 00 00 00 00 00 00 00 00 00 00 00 00 00 ¤...............
00448: 52 46 48 20 00 00 00 02 00 00 00 A4 00 00 01 11 RFH .......¤....
00464: 00 00 04 B8 4D 51 53 54 52 20 20 20 00 00 00 00 ...¸MQSTR ....
00480: 00 00 04 B8 00 00 00 20 3C 6D 63 64 3E 3C 4D 73 ...¸... <mcd><Ms
00496: 64 3E 6A 6D 73 5F 74 65 78 74 3C 2F 4D 73 64 3E d>jms_text</Msd>
00512: 3C 2F 6D 63 64 3E 20 20 00 00 00 58 3C 6A 6D 73 </mcd> ...X<jms
00528: 3E 3C 44 73 74 3E 71 75 65 75 65 3A 2F 2F 2F 51 ><Dst>queue:///Q
00544: 31 3C 2F 44 73 74 3E 3C 54 6D 73 3E 31 33 38 37 1</Dst><Tms>1387
00560: 34 36 32 39 35 32 32 32 36 3C 2F 54 6D 73 3E 3C 462952226</Tms><
00576: 43 69 64 3E 30 30 30 30 30 30 39 39 3C 2F 43 69 Cid>00000099</Ci
00592: 64 3E 3C 44 6C 76 3E 32 3C 2F 44 6C 76 3E 3C 2F d><Dlv>2</Dlv></
Ordered unique IDs for each record (LSN)
A set of documented record types
Transaction information with XIDs, or re-used
MQ transaction IDs
MQMD header data at discoverable offsets
in the hex of a message Put
The message payload itself
3
Different on z/OS
use CSQ1LOGP](https://image.slidesharecdn.com/6889-170329191828/75/Where-is-My-Message-34-2048.jpg)


The document discusses tools and techniques for monitoring IBM MQ applications, specifically focusing on connection status, message routing, and application activity. It introduces the use of the Cluster Queue Monitoring sample program (amqsclm) for managing message distribution in a cluster environment and provides insights on real-time queue and channel monitoring. The content is aimed at enhancing the understanding of message flows and system performance across various applications using IBM MQ.


