When hospital D became part of Western Healthcare system that ha.docx
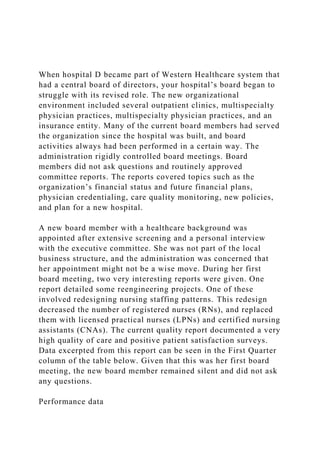
When hospital D became part of Western Healthcare system that had a central board of directors, your hospital’s board began to struggle with its revised role. The new organizational environment included several outpatient clinics, multispecialty physician practices, multispecialty physician practices, and an insurance entity. Many of the current board members had served the organization since the hospital was built, and board activities always had been performed in a certain way. The administration rigidly controlled board meetings. Board members did not ask questions and routinely approved committee reports. The reports covered topics such as the organization’s financial status and future financial plans, physician credentialing, care quality monitoring, new policies, and plan for a new hospital. A new board member with a healthcare background was appointed after extensive screening and a personal interview with the executive committee. She was not part of the local business structure, and the administration was concerned that her appointment might not be a wise move. During her first board meeting, two very interesting reports were given. One report detailed some reengineering projects. One of these involved redesigning nursing staffing patterns. This redesign decreased the number of registered nurses (RNs), and replaced them with licensed practical nurses (LPNs) and certified nursing assistants (CNAs). The current quality report documented a very high quality of care and positive patient satisfaction surveys. Data excerpted from this report can be seen in the First Quarter column of the table below. Given that this was her first board meeting, the new board member remained silent and did not ask any questions. Performance data Quality Performance Measure 1st Quarter 2nd Quarter Medication errors 3.2% 10.42% Patient falls 4.21% 8.56% Cesarean sections 14.21% 17.87% Rate of vaginal birth after C-sections 18.27% 15.72% Healthcare associated infections 1.78% 4.85% Surgical errors 0.15% 0.21% Patient Satisfaction Measure 1st Quarter 2nd Quarter Overall service 40.52% 20.74% Overall clinical 86.72% 70.82% Overall quality of service 45.40% 22.34% Food 30.56% 32.54% Overall cleanliness 85.89% 83.26% Within four months, the new nursing staffing patterns had been launched. Data excerpted from the quality indicators report presented to the board can be seen in the “2nd Quarter” column of the table. After reviewing the data presented by the nurse administrator, the new board member was very concerned and decided to ask if the values in the quality report, which show a negative trend, were for the nursing units with the new staffing patterns. The administrator reported that there was a direct correlation. This answer initiated discussion among other board members who were accustomed to using quality indicators in their businesses. This was the first substantive board-level discussion that the new board memb.

Recommended
Recommended
More Related Content
Similar to When hospital D became part of Western Healthcare system that ha.docx
Similar to When hospital D became part of Western Healthcare system that ha.docx (20)
More from eubanksnefen
More from eubanksnefen (20)
Recently uploaded
Recently uploaded (20)
When hospital D became part of Western Healthcare system that ha.docx
- 1. When hospital D became part of Western Healthcare system that had a central board of directors, your hospital’s board began to struggle with its revised role. The new organizational environment included several outpatient clinics, multispecialty physician practices, multispecialty physician practices, and an insurance entity. Many of the current board members had served the organization since the hospital was built, and board activities always had been performed in a certain way. The administration rigidly controlled board meetings. Board members did not ask questions and routinely approved committee reports. The reports covered topics such as the organization’s financial status and future financial plans, physician credentialing, care quality monitoring, new policies, and plan for a new hospital. A new board member with a healthcare background was appointed after extensive screening and a personal interview with the executive committee. She was not part of the local business structure, and the administration was concerned that her appointment might not be a wise move. During her first board meeting, two very interesting reports were given. One report detailed some reengineering projects. One of these involved redesigning nursing staffing patterns. This redesign decreased the number of registered nurses (RNs), and replaced them with licensed practical nurses (LPNs) and certified nursing assistants (CNAs). The current quality report documented a very high quality of care and positive patient satisfaction surveys. Data excerpted from this report can be seen in the First Quarter column of the table below. Given that this was her first board meeting, the new board member remained silent and did not ask any questions. Performance data
- 2. Quality Performance Measure 1st Quarter 2nd Quarter Medication errors 3.2% 10.42% Patient falls 4.21% 8.56% Cesarean sections 14.21% 17.87% Rate of vaginal birth after C-sections 18.27% 15.72% Healthcare associated infections
- 3. 1.78% 4.85% Surgical errors 0.15% 0.21% Patient Satisfaction Measure 1st Quarter 2nd Quarter Overall service 40.52% 20.74% Overall clinical 86.72% 70.82% Overall quality of service 45.40%
- 4. 22.34% Food 30.56% 32.54% Overall cleanliness 85.89% 83.26% Within four months, the new nursing staffing patterns had been launched. Data excerpted from the quality indicators report presented to the board can be seen in the “2nd Quarter” column of the table. After reviewing the data presented by the nurse administrator, the new board member was very concerned and decided to ask if the values in the quality report, which show a negative trend, were for the nursing units with the new staffing patterns. The administrator reported that there was a direct correlation. This answer initiated discussion among other board members who were accustomed to using quality indicators in their businesses. This was the first substantive board-level discussion that the new board member had seen. One board member wanted to know whether any data had been gathered from patient focus groups. Another board member asked whether the average length-of-stay data had increased, and someone else asked a about a cost-benefit analysis of the new staffing patterns. Following the usual process, the chair called for approval of the report and presentation of the next item on the agenda. Questions:
- 5. What changes or patterns do you see in the data? What remedies might be suggested for any problems? (20 points) Has the CEO carried out his or her responsibility for educating the board? Why or why not? (10 points) Depending on the answer to question 2, what strategies would you recommend at this point? (10 points) What quality data should be reported and utilized by this board of directors? (20 points) Given this administration’s style and leadership approach, how do you think the minutes of the board meeting reflect actual board meeting discussions? (10 points)