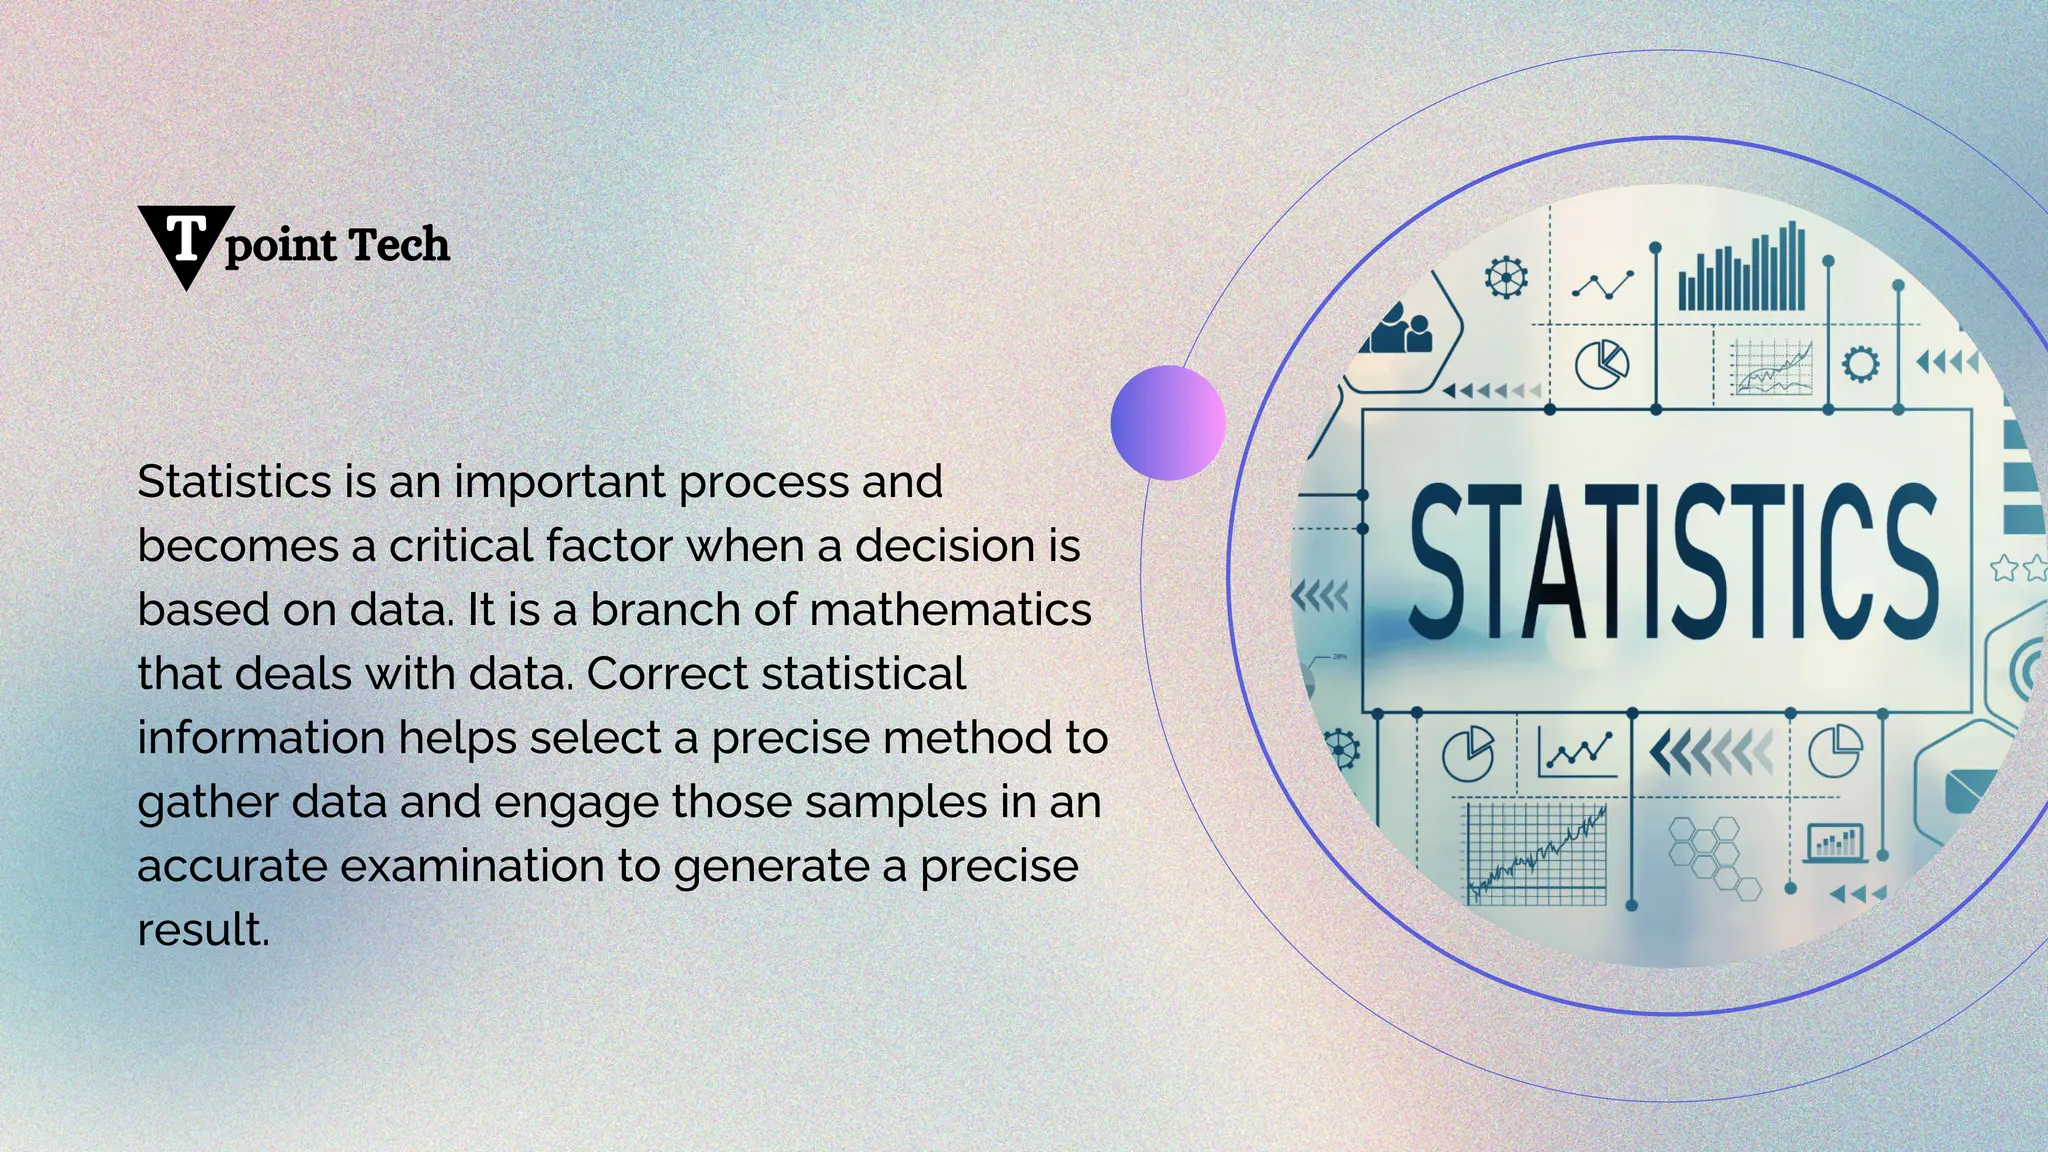
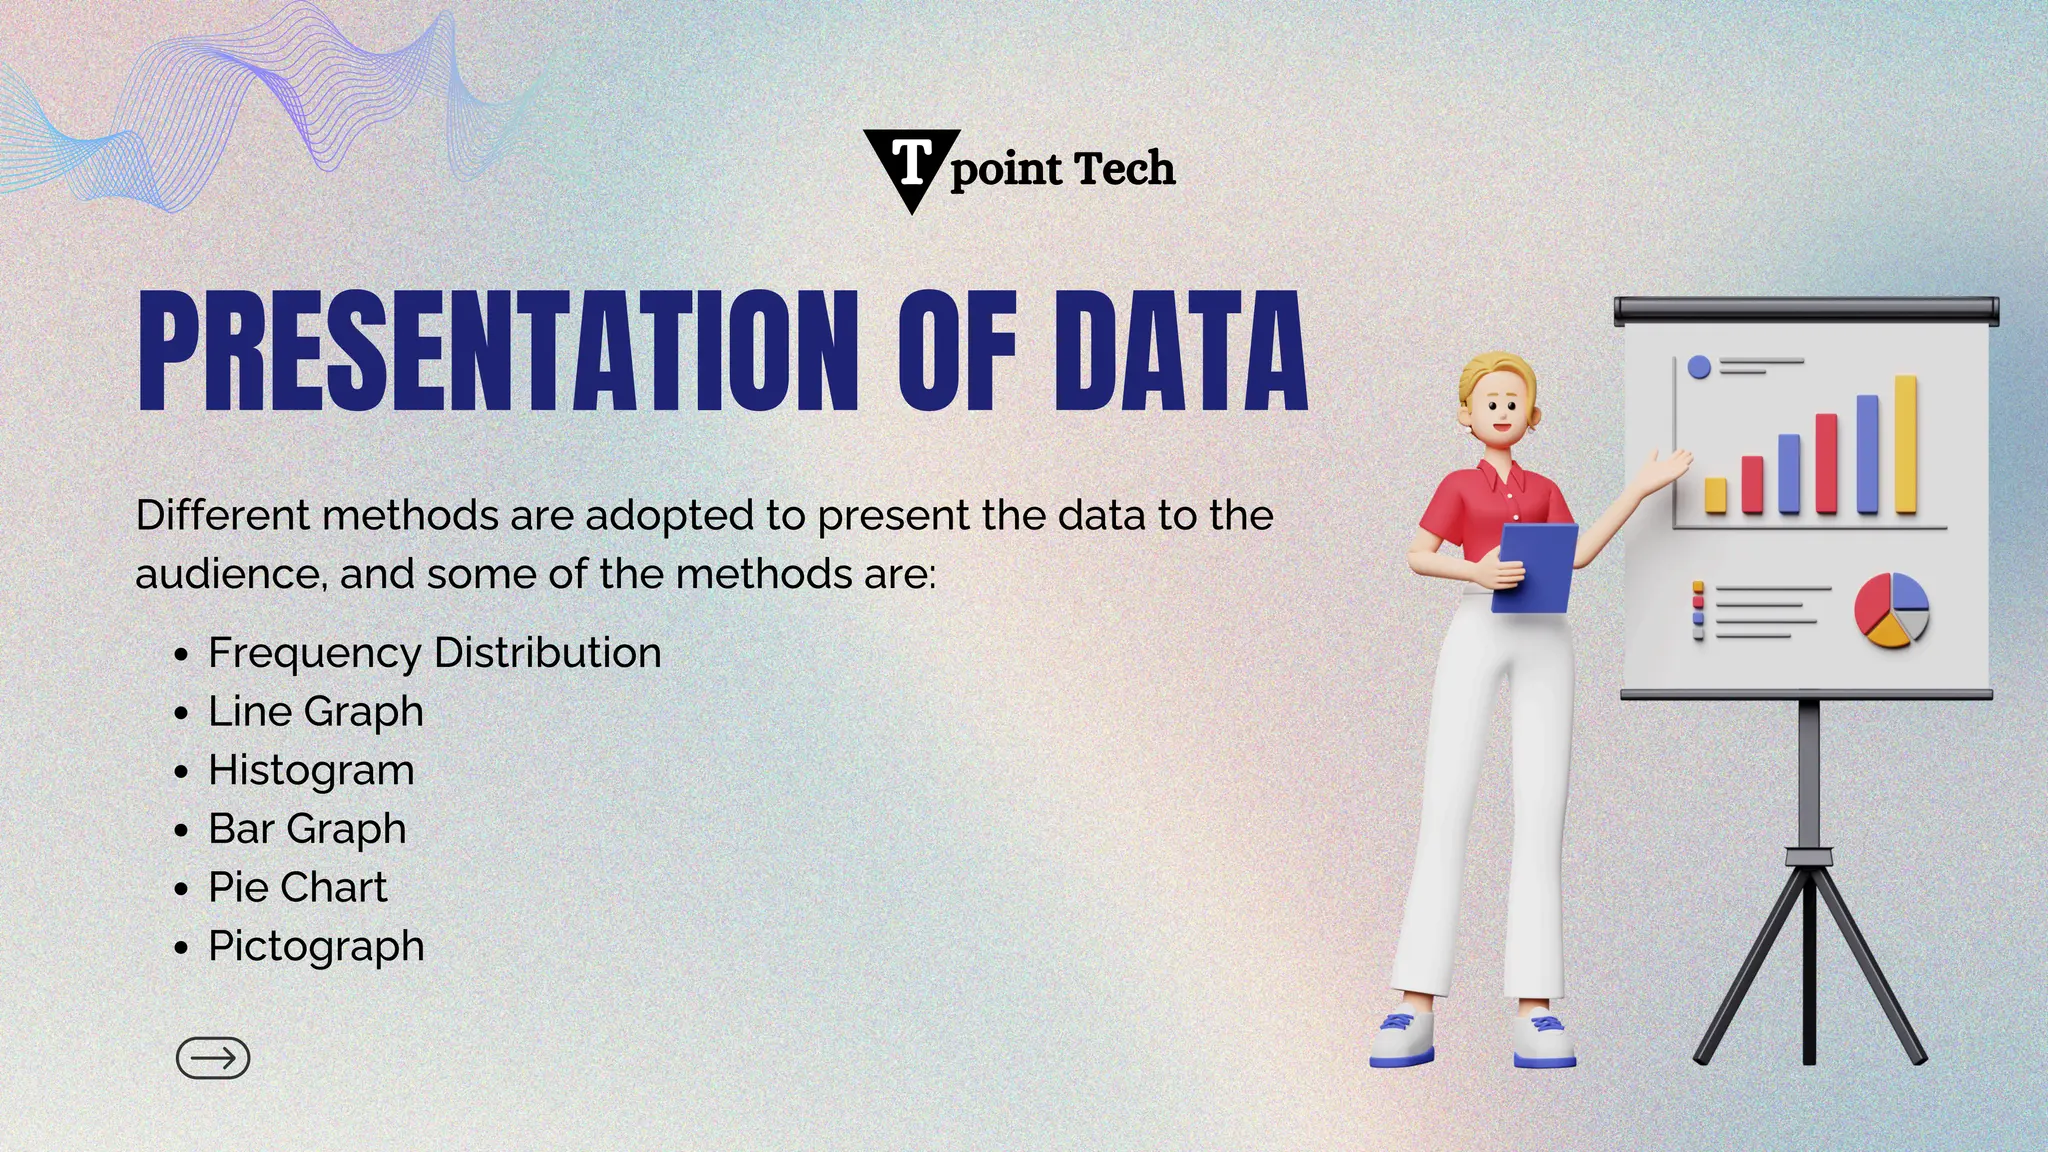
point Tech
T
STATISTICS
www.javatpoint.com
DEFINITION
point Tech
T
Statistics is an important process and
becomes a critical factor when a decision is
based on data. It is a branch of mathematics
that deals with data. Correct statistical
information helps select a precise method to
gather data and engage those samples in an
accurate examination to generate a precise
result.
STATISTICS IN MATHEMATICS
Statistics involves gathering, presenting, analyzing, and
interpreting data. Its main goal is to strategize data for surveys
and experiments. It is also considered a mathematical science
dealing with numerical data.
point Tech
T
point Tech
T
EXAMPLE OF
STATISTICS
Determination number of students in the
Class
Calculation of poor and Rich people in the
Class
Number of malls in the city
TYPES OF
STATISTICS
Statistics has only two branches:
Descriptive Statistics
Inferential Statistics
point Tech
T
1. Descriptive Statistics
Descriptive statistics use tables,
graphs, and numerical calculations
to present data, such as the
number of students in a class.
point Tech
T
2. Inferential Statistics
It relies on a data sample
collected from the population
and is used to make inferences
and predictions.
Both types are recruited in statistical analysis.
point Tech
T
FEATURES OF STATISTICS
The critical features of the statistics are:
It should be numerically presented.
It involves an aggregate of facts.
It should be gathered systematically.
It should be comparative.
It is gathered for the definite objective.
IMPORTANCE OF STATISTICS
It helps in collecting quantitative data
Presents complex data in tables, graphs, and diagrams for
better visualization
Enhances understanding and comprehensive elaboration
Ensures reliability and valid inferences
Aids in understanding variability patterns through
quantitative observations
point Tech
T
STATISTICAL LEVEL OF MEASUREMENT
The nominal level of measurement deals with names, labels, or categories. It does not include
numbers or numerical values. It is used to classify things without considering any quantity or
order.
1. NOMINAL LEVEL OF MEASUREMENT
All data have equal importance and are arranged in a specific order. The values cannot be
subtracted from each other because their position matters. This data type is called
nonparametric statistics and is compared with the whole group of variables.
2. ORDINAL LEVEL MEASUREMENT
For example, The name of the Prime Minister elected in 2019 was Robert jr.
For example, Indian Ashwin Kumar was the fastest man in the Rio Olympics in the 50-meter sprint.
point Tech
T
Differences between the data set contain meaning, and the outcomes are arranged in
order. Comparison is often based on two different data points.
3. INTERVAL LEVEL MEASUREMENTNT
Differences between the data values have meaning, and outcomes are arranged in order.
Now it can contain zero value and the starting point. Data ratio also contains some
meaning.
4. RATIO LEVEL MEASUREMENT
For example, The price Rise hit 9.6% in April 2002, and the last time the price rise was high
was in January 1980.
For example, The highest temperature recorded by the meteorological department was 51
degrees Celsius in Nashik.
point Tech
T
SCOPE OF STATISTICS
Statistics are employed in numerous sectors, including
probability, weather, forecasting, and geology. The
objective of the statistics is to achieve understanding
from the available data. It stresses the applications;
therefore, it is also called a mathematical science.
TECHNIQUES IN MATHEMATICS
Three techniques play an important role,
and they are:
Data Collection
Statistical Analysis
Data Summarisation
point Tech
T
point Tech
T
PRESENTATION OF DATA
Different methods are adopted to present the data to the
audience, and some of the methods are:
Frequency Distribution
Line Graph
Histogram
Bar Graph
Pie Chart
Pictograph
CENTRAL TENDENCY MEASUREMENT
Statistics in mathematics are employed to present the central tendencies of the
ungrouped and grouped data. The three measures of the Central tendencies are:
Mean
Median
Mode
Central tendency is employed to figure out the available data's central value.
point Tech
T
MEASURES OF DISPERSION
The dispersion measures in the statistics help in understanding the data variability.
There are two types of dispersion measures, categorized as Relative and Absolute
point Tech
T
Mean and Mean Deviation
Range
Variance
Quartiles and Quartile deviation
Standard Deviation
point Tech
T
RELATIVE MEASURES
OF DISPERSION
Co-efficient of Mean Deviation
Co-efficient of Range
Co-efficient of Quartile Deviation
Co-efficient of Variation
Co-efficient of Standard Deviation
SKEWNESS IN STATISTICS
Skewness, meaning in Statistics, is a computation of the asymmetry in
the probability distribution. It computes the deviation of the curve of
the normal distribution of the given data.
point Tech
T
The outcome of the skewed could be negative or positive.
point Tech
T
Question: What is the objective of the Statistics?
Ans: It helps to learn to use limited samples to make accurate
determinations. Using graphs, diagrams, or tables plays a significant
role in presenting the information meaningfully.
Question: What is the significance of Statistics in actual life?
Ans: It motivates you to use useful ideas to collect information and use
it in the right direction to present outcomes. Measurement is an
important cycle behind how we disclose in science and settle on
choices dependent on information and forecasts.
FREQUENTLY ASKED QUESTION
THANK
YOU!
www.javatpoint.com
hr@javatpoint.com
Thank you for joining us on this
journey through the
computers. For further
inquiries or collaborations,
please feel free to contact us.

What is Statistics Definition PPT - TpointTech

  • 1.
  • 2.
    point Tech T Statistics isan important process and becomes a critical factor when a decision is based on data. It is a branch of mathematics that deals with data. Correct statistical information helps select a precise method to gather data and engage those samples in an accurate examination to generate a precise result.
  • 3.
    STATISTICS IN MATHEMATICS Statisticsinvolves gathering, presenting, analyzing, and interpreting data. Its main goal is to strategize data for surveys and experiments. It is also considered a mathematical science dealing with numerical data. point Tech T
  • 4.
    point Tech T EXAMPLE OF STATISTICS Determinationnumber of students in the Class Calculation of poor and Rich people in the Class Number of malls in the city
  • 5.
    TYPES OF STATISTICS Statistics hasonly two branches: Descriptive Statistics Inferential Statistics point Tech T
  • 6.
    1. Descriptive Statistics Descriptivestatistics use tables, graphs, and numerical calculations to present data, such as the number of students in a class. point Tech T 2. Inferential Statistics It relies on a data sample collected from the population and is used to make inferences and predictions. Both types are recruited in statistical analysis.
  • 7.
    point Tech T FEATURES OFSTATISTICS The critical features of the statistics are: It should be numerically presented. It involves an aggregate of facts. It should be gathered systematically. It should be comparative. It is gathered for the definite objective.
  • 8.
    IMPORTANCE OF STATISTICS Ithelps in collecting quantitative data Presents complex data in tables, graphs, and diagrams for better visualization Enhances understanding and comprehensive elaboration Ensures reliability and valid inferences Aids in understanding variability patterns through quantitative observations point Tech T
  • 9.
    STATISTICAL LEVEL OFMEASUREMENT The nominal level of measurement deals with names, labels, or categories. It does not include numbers or numerical values. It is used to classify things without considering any quantity or order. 1. NOMINAL LEVEL OF MEASUREMENT All data have equal importance and are arranged in a specific order. The values cannot be subtracted from each other because their position matters. This data type is called nonparametric statistics and is compared with the whole group of variables. 2. ORDINAL LEVEL MEASUREMENT For example, The name of the Prime Minister elected in 2019 was Robert jr. For example, Indian Ashwin Kumar was the fastest man in the Rio Olympics in the 50-meter sprint. point Tech T
  • 10.
    Differences between thedata set contain meaning, and the outcomes are arranged in order. Comparison is often based on two different data points. 3. INTERVAL LEVEL MEASUREMENTNT Differences between the data values have meaning, and outcomes are arranged in order. Now it can contain zero value and the starting point. Data ratio also contains some meaning. 4. RATIO LEVEL MEASUREMENT For example, The price Rise hit 9.6% in April 2002, and the last time the price rise was high was in January 1980. For example, The highest temperature recorded by the meteorological department was 51 degrees Celsius in Nashik.
  • 11.
    point Tech T SCOPE OFSTATISTICS Statistics are employed in numerous sectors, including probability, weather, forecasting, and geology. The objective of the statistics is to achieve understanding from the available data. It stresses the applications; therefore, it is also called a mathematical science.
  • 12.
    TECHNIQUES IN MATHEMATICS Threetechniques play an important role, and they are: Data Collection Statistical Analysis Data Summarisation point Tech T
  • 13.
    point Tech T PRESENTATION OFDATA Different methods are adopted to present the data to the audience, and some of the methods are: Frequency Distribution Line Graph Histogram Bar Graph Pie Chart Pictograph
  • 14.
    CENTRAL TENDENCY MEASUREMENT Statisticsin mathematics are employed to present the central tendencies of the ungrouped and grouped data. The three measures of the Central tendencies are: Mean Median Mode Central tendency is employed to figure out the available data's central value. point Tech T
  • 15.
    MEASURES OF DISPERSION Thedispersion measures in the statistics help in understanding the data variability. There are two types of dispersion measures, categorized as Relative and Absolute point Tech T Mean and Mean Deviation Range Variance Quartiles and Quartile deviation Standard Deviation
  • 16.
    point Tech T RELATIVE MEASURES OFDISPERSION Co-efficient of Mean Deviation Co-efficient of Range Co-efficient of Quartile Deviation Co-efficient of Variation Co-efficient of Standard Deviation
  • 17.
    SKEWNESS IN STATISTICS Skewness,meaning in Statistics, is a computation of the asymmetry in the probability distribution. It computes the deviation of the curve of the normal distribution of the given data. point Tech T The outcome of the skewed could be negative or positive.
  • 18.
    point Tech T Question: Whatis the objective of the Statistics? Ans: It helps to learn to use limited samples to make accurate determinations. Using graphs, diagrams, or tables plays a significant role in presenting the information meaningfully. Question: What is the significance of Statistics in actual life? Ans: It motivates you to use useful ideas to collect information and use it in the right direction to present outcomes. Measurement is an important cycle behind how we disclose in science and settle on choices dependent on information and forecasts. FREQUENTLY ASKED QUESTION
  • 19.
    THANK YOU! www.javatpoint.com hr@javatpoint.com Thank you forjoining us on this journey through the computers. For further inquiries or collaborations, please feel free to contact us.