Download to read offline


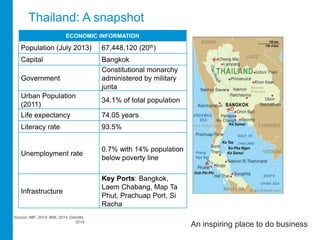
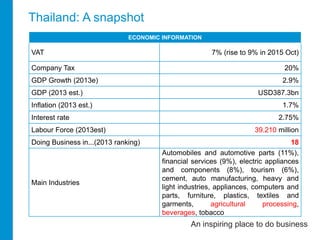
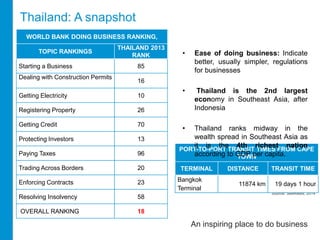
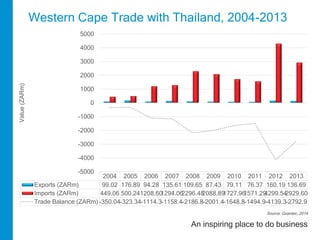
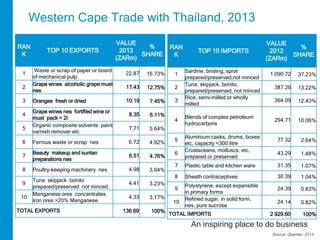
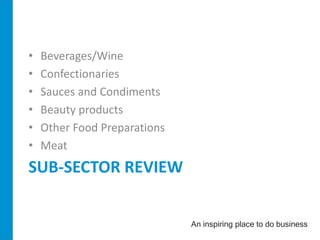
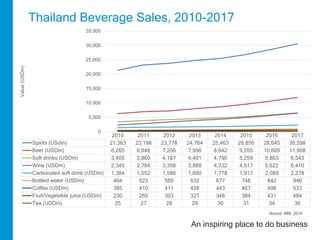
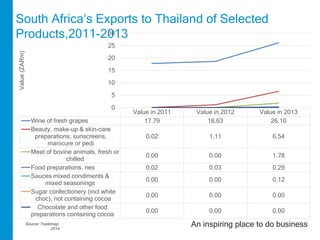
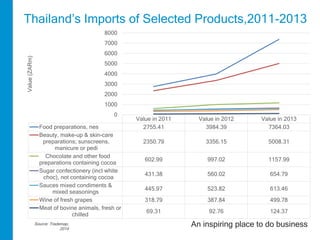
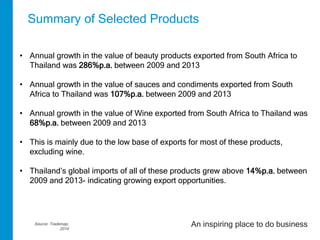


The document provides an overview of opportunities for trade between South Africa and Thailand. It summarizes Thailand's economic and trade statistics, top exports and imports with South Africa, and highlights several promising sub-sectors for increased trade, including wine, beauty products, sauces and condiments. Exports of wine, beauty products and sauces from South Africa to Thailand have grown significantly in recent years, from a low base, indicating opportunities for further export growth. Thailand's imports of these same products have also increased over 14% annually, suggesting growing demand.