This document is a business plan for a wine trading company seeking to import and sell Argentinean and Italian wines in Asian markets, starting with Hong Kong. It provides an overview of the company's proposed structure, products, target markets, competitors, and financial projections. Key points include:
- The plan aims to take advantage of growing wine consumption in Asia, especially Hong Kong and China.
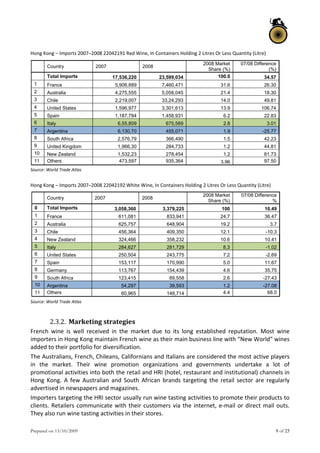
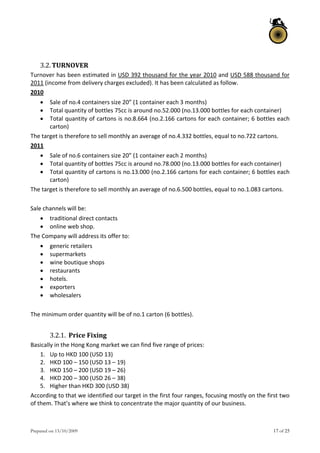
- Hong Kong represents an attractive market due to its large population, doubling wine import volumes in recent years.
- Major competitors include French, Australian, Chilean, US, and Spanish wine producers.
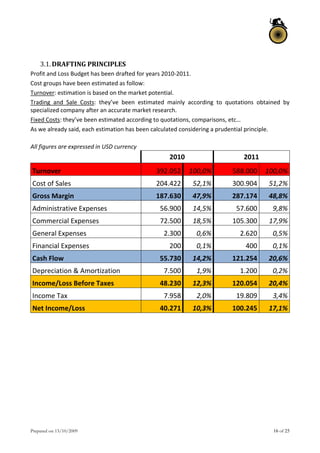
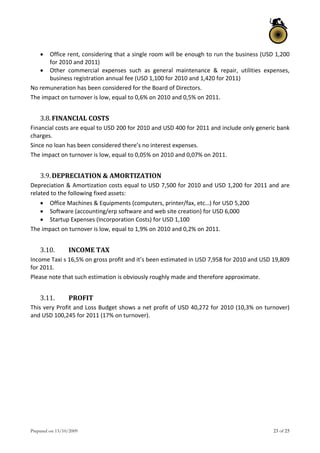
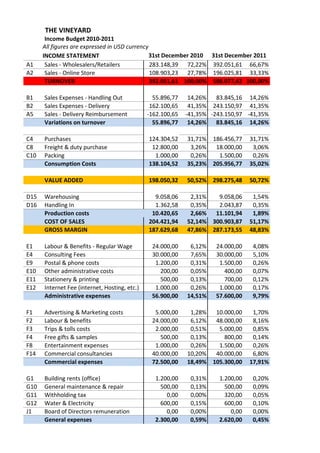
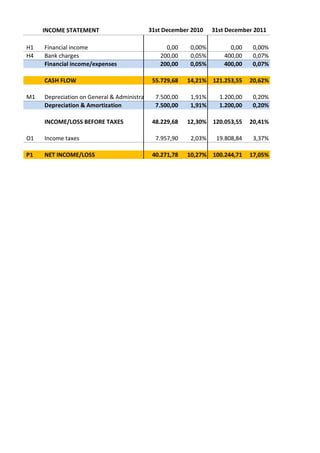
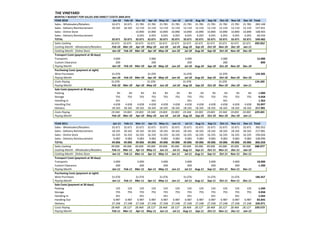
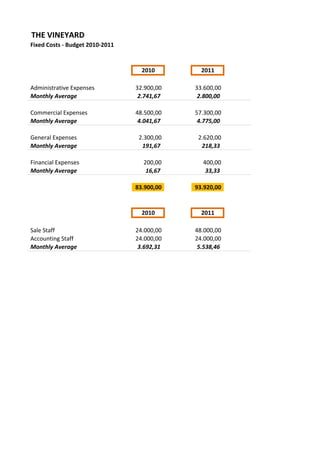
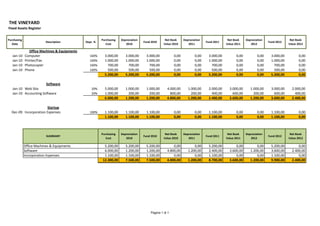
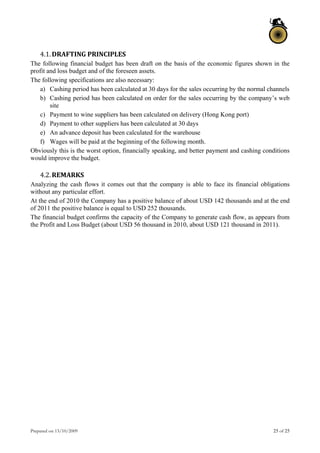
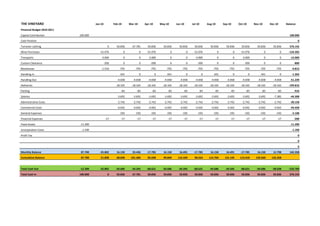
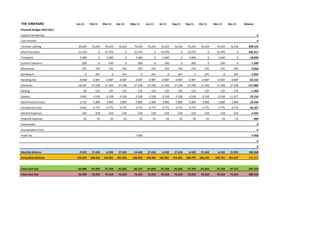
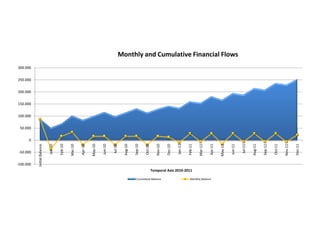
- Financial projections estimate revenues, costs, profits, and required funding over the next two years.