Download to read offline

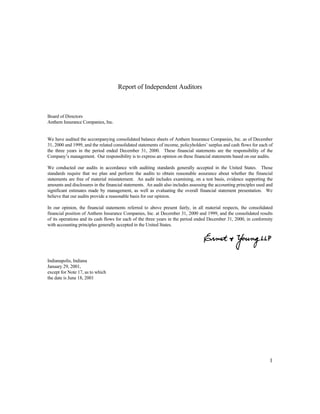
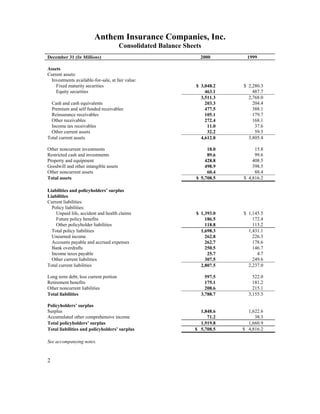
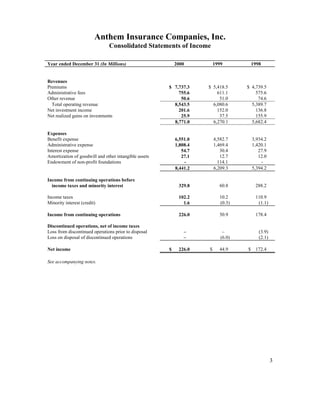
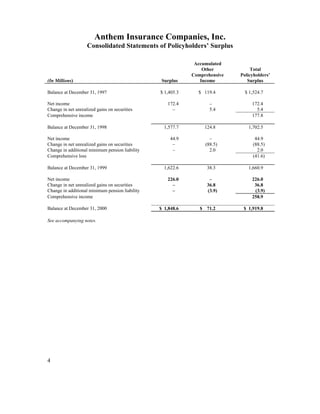
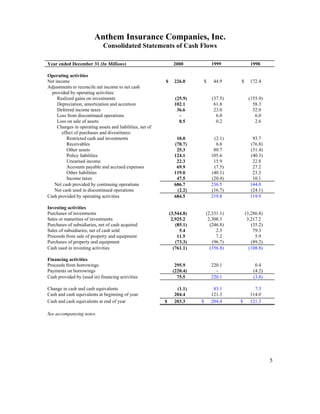
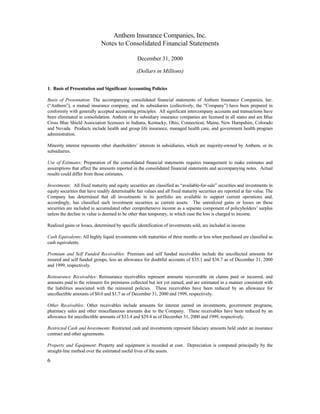
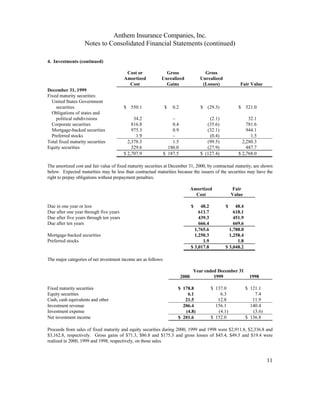
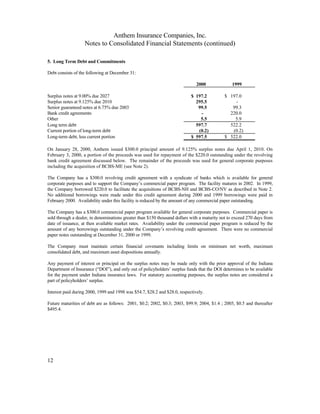
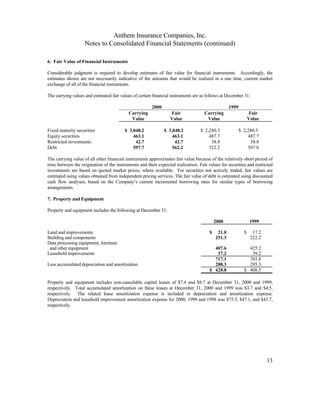
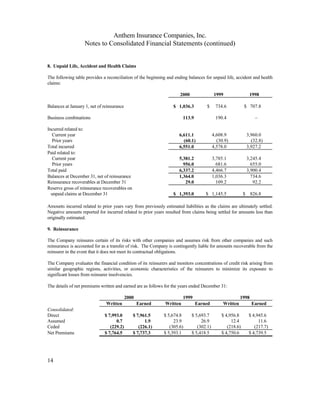
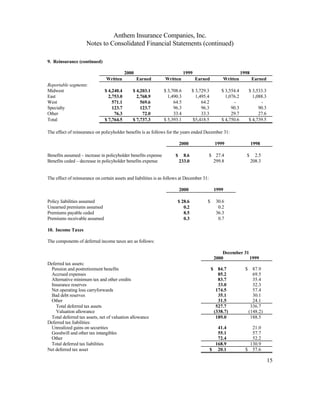
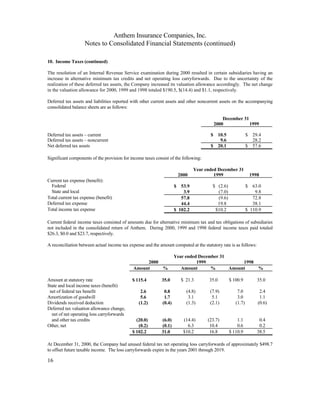
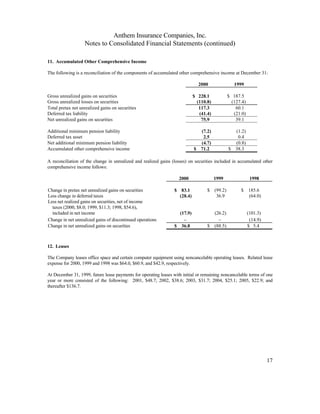
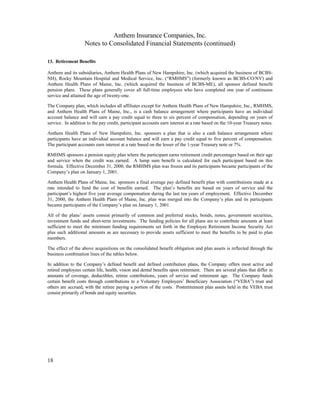
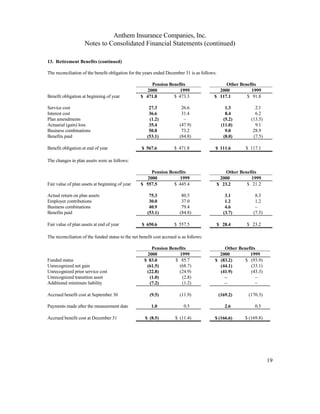
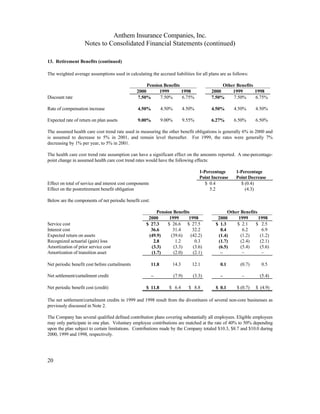
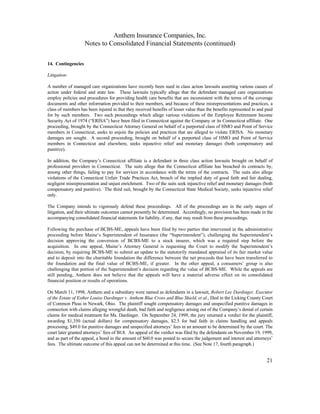
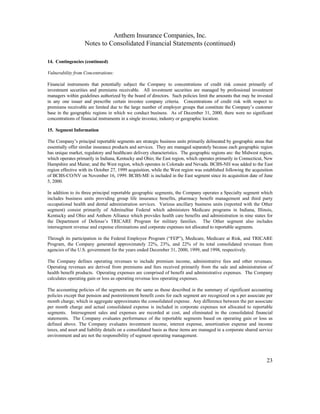
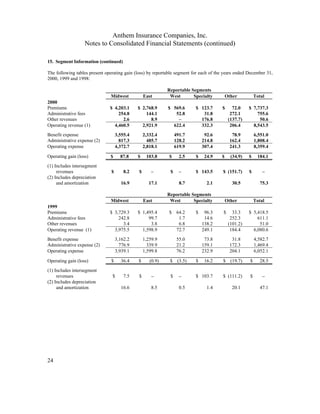
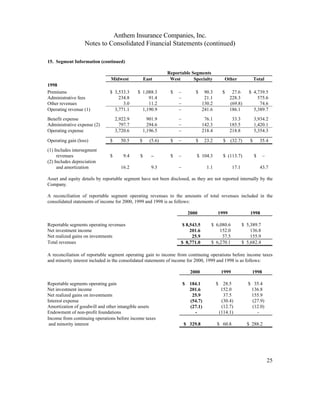
This document provides the consolidated financial statements of Anthem Insurance Companies, Inc. for the years ended December 31, 2000, 1999 and 1998, as filed with the SEC. It includes the independent auditor's report, consolidated balance sheets, statements of income, policyholders' surplus, and cash flows, as well as notes to the financial statements. The independent auditor issued an unqualified opinion stating the financial statements fairly presented the financial position and results of Anthem in accordance with accounting principles generally accepted in the United States.


