SlideShare a Scribd company logo
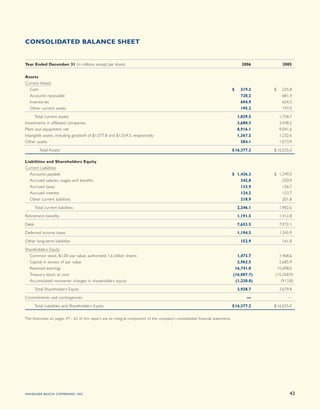
CONSOLIDATED BALANCE SHEET


Year Ended December 31 (in millions, except per share)                                                                               2006         2005


Assets
Current Assets
  Cash                                                                                                                         $    219.2    $    225.8
  Accounts receivable                                                                                                               720.2         681.4
  Inventories                                                                                                                       694.9         654.5
  Other current assets                                                                                                              195.2         197.0

      Total current assets                                                                                                         1,829.5       1,758.7
Investments in affiliated companies                                                                                                3,680.3       3,448.2
Plant and equipment, net                                                                                                           8,916.1       9,041.6
Intangible assets, including goodwill of $1,077.8 and $1,034.5, respectively                                                       1,367.2       1,232.6
Other assets                                                                                                                         584.1       1,073.9

          Total Assets                                                                                                         $ 16,377.2    $ 16,555.0

Liabilities and Shareholders Equity
Current Liabilities
  Accounts payable                                                                                                             $ 1,426.3     $ 1,249.5
  Accrued salaries, wages and benefits                                                                                             342.8         250.9
  Accrued taxes                                                                                                                    133.9         156.7
  Accrued interest                                                                                                                 124.2         123.7
  Other current liabilities                                                                                                        218.9         201.8

       Total current liabilities                                                                                                   2,246.1       1,982.6

Retirement benefits                                                                                                                1,191.5       1,412.8

Debt                                                                                                                               7,653.5       7,972.1

Deferred income taxes                                                                                                              1,194.5       1,345.9

Other long-term liabilities                                                                                                         152.9         161.8

Shareholders Equity
  Common stock, $1.00 par value, authorized 1.6 billion shares                                                                   1,473.7       1,468.6
  Capital in excess of par value                                                                                                 2,962.5       2,685.9
  Retained earnings                                                                                                             16,741.0      15,698.0
  Treasury stock, at cost                                                                                                      (16,007.7)    (15,258.9)
  Accumulated nonowner changes in shareholders equity                                                                           (1,230.8)       (913.8)

       Total Shareholders Equity                                                                                                   3,938.7       3,679.8

Commitments and contingencies                                                                                                          —             —

       Total Liabilities and Shareholders Equity                                                                               $ 16,377.2    $ 16,555.0


The footnotes on pages 47 - 63 of this repor t are an integral component of the company’s consolidated financial statements.


                                                                                                                                                      43
ANHEUSER-BUSCH COMPANIES, INC.
CONSOLIDATED STATEMENT OF INCOME


Year Ended December 31 (in millions, except per share)                                                     2006                       2005                   2004

Gross sales                                                                                        $ 17,957.8                  $17,253.5              $ 17,160.2
Excise taxes                                                                                         (2,240.7)                  (2,217.8)               (2,226.0)

 Net sales                                                                                              15,717.1                   15,035.7               14,934.2
Cost of sales                                                                                          (10,165.0)                  (9,606.3)              (9,020.0)

  Gross profit                                                                                           5,552.1                    5,429.4                5,914.2
Marketing, distribution and administrative expenses                                                     (2,832.5)                  (2,837.5)              (2,740.5)
Litigation settlement                                                                                         —                      (105.0)                   —

  Operating income                                                                                       2,719.6                    2,486.9                3,173.7
Interest expense                                                                                          (451.3)                    (454.5)                (426.9)
Interest capitalized                                                                                        17.6                       19.9                   21.9
Interest income                                                                                              1.8                        2.4                    4.7
Other income/(expense), net                                                                                (10.8)                       2.7                   38.7

  Income before income taxes                                                                             2,276.9                    2,057.4                2,812.1
Provision for income taxes                                                                                (900.5)                    (811.1)              (1,097.5)
Equity income, net of tax                                                                                  588.8                      498.1                  404.1

 Net income                                                                                        $     1,965.2               $ 1,744.4              $ 2,118.7


Basic earnings per share                                                                           $       2.55                $       2.24           $       2.65

Diluted earnings per share                                                                         $       2.53                $       2.23           $       2.62


The footnotes on pages 47 - 63 of this repor t are an integral component of the company’s consolidated financial statements.


44                                                                                                                                 ANHEUSER-BUSCH COMPANIES, INC.
CONSOLIDATED STATEMENT OF CHANGES IN SHAREHOLDERS EQUITY


Year Ended December 31 (in millions, except per share)                                                   2006                       2005          2004


Common Stock, $1.00 Par Value
Balance, beginning of period                                                                        $ 1,468.6                  $ 1,463.0     $ 1,457.9
Shares issued under stock plans                                                                           5.1                        5.6           5.1

  Balance, end of period                                                                            $ 1,473.7                  $ 1,468.6     $ 1,463.0

Capital in Excess of Par Value
Balance beginning of period                                                                         $ 2,685.9                  $ 2,387.9     $ 1,981.0
Stock compensation related                                                                              138.2                      134.1         187.3
Shares issued under stock plans                                                                         138.4                      163.9         145.6
Grupo Modelo capital transaction                                                                           —                         —            74.0

  Balance, end of period                                                                            $ 2,962.5                  $ 2,685.9     $ 2,387.9

Retained Earnings
Balance, beginning of period                                                                       $ 15,698.0                  $ 14,754.4    $ 13,404.2
Net income                                                                                            1,965.2                     1,744.4       2,118.7
Common dividends paid (per share: 2006, $1.13; 2005, $1.03; 2004, $.93)                                (871.6)                     (800.8)       (742.8)
Deferred income tax adjustment                                                                          (50.6)                        —           (25.9)
Shares issued under stock plans                                                                            —                          —             0.2

  Balance, end of period                                                                           $ 16,741.0                  $ 15,698.0    $ 14,754.4

Treasury Stock
Balance, beginning of period                                                                       $(15,258.9)                 $(14,638.5)   $(12,939.0)
Treasury stock acquired                                                                                (745.9)                     (620.4)     (1,699.5)
Restricted stock cancellations                                                                           (2.9)                        —             —

  Balance, end of period                                                                           $(16,007.7)                 $(15,258.9)   $(14,638.5)

Accumulated Nonowner Changes in Shareholders Equity
Balance, beginning of period                                                                       $    (913.8)                $   (988.9)   $   (890.3)
Foreign currency translation gains/(losses)                                                              (70.2)                     184.5         102.9
Deferred hedging gains/(losses)                                                                            4.5                       (1.1)        (61.1)
Deferred securities valuation gains/(losses)                                                               1.0                      (95.6)        (76.4)
Deferred retirement benefits costs                                                                      (252.3)                     (12.7)        (64.0)

  Total changes, net of deferred income taxes                                                           (317.0)                      75.1         (98.6)

  Balance, end of period                                                                           $ (1,230.8)                 $   (913.8)   $   (988.9)

ESOP Debt Guarantee
Balance, beginning of period                                                                       $        —                  $      —      $    (46.3)
Annual debt service                                                                                         —                         —            46.3

  Balance, end of period                                                                           $        —                  $      —      $      —

  Total Shareholders Equity                                                                        $   3,938.7                 $ 3,679.8     $ 2,977.9

Net Income and Nonowner Changes in Shareholders Equity
Net income                                                                                         $   1,965.2                 $ 1,744.4     $ 2,118.7
Total nonowner changes in shareholders equity, net of deferred income taxes                             (317.0)                     75.1         (98.6)

  Combined Net Income and Nonowner Changes in Shareholders Equity                                  $   1,648.2                 $ 1,819.5     $ 2,020.1


The footnotes on pages 47 - 63 of this repor t are an integral component of the company’s consolidated financial statements.


                                                                                                                                                      45
ANHEUSER-BUSCH COMPANIES, INC.
CONSOLIDATED STATEMENT OF CASH FLOWS


Year Ended December 31 (in millions)                                                                       2006                      2005                   2004


Cash Flow from Operating Activities
Net Income                                                                                          $ 1,965.2                  $ 1,744.4              $ 2,118.7
Adjustments to reconcile net income to cash provided by operating activities:
  Depreciation and amor tization                                                                          988.7                      979.0                  932.7
  Stock compensation expense                                                                              122.9                      134.1                  187.3
  Increase/(Decrease) in deferred income taxes                                                            (45.8)                     (39.1)                 121.4
  Gain on sale of business                                                                                   —                       (15.4)                 (13.4)
  Undistributed earnings of affiliated companies                                                         (341.8)                    (288.0)                (225.1)
  Other, net                                                                                             (168.6)                     136.6                  (25.0)

  Operating cash flow before change in working capital                                                  2,520.6                     2,651.6               3,096.6
  (Increase)/Decrease in working capital                                                                  188.8                        50.3                (181.6)

  Cash provided by operating activities                                                                 2,709.4                     2,701.9               2,915.0

Cash Flow from Investing Activities
  Capital expenditures                                                                                   (812.5)                   (1,136.7)              (1,089.6)
  New business acquisitions                                                                              (101.0)                        —                   (727.9)
  Proceeds from sale of business                                                                             —                         48.3                  302.5

  Cash used for investing activities                                                                     (913.5)                   (1,088.4)              (1,515.0)

Cash Flow from Financing Activities
  Increase in debt                                                                                        334.8                      100.0                 1,443.8
  Decrease in debt                                                                                       (663.3)                    (456.0)                 (510.6)
  Dividends paid to shareholders                                                                         (871.6)                    (800.8)                 (742.8)
  Acquisition of treasury stock                                                                          (745.9)                    (620.4)               (1,699.5)
  Shares issued under stock plans                                                                         143.5                      161.4                   146.1

  Cash used for financing activities                                                                    (1,802.5)                  (1,615.8)              (1,363.0)

Net increase in cash during the year                                                                       (6.6)                      (2.3)                  37.0
Cash, beginning of year                                                                                   225.8                      228.1                  191.1

Cash, end of year                                                                                   $     219.2                $     225.8            $     228.1


The footnotes on pages 47 - 63 of this repor t are an integral component of the company’s consolidated financial statements.


46                                                                                                                                 ANHEUSER-BUSCH COMPANIES, INC.

More Related Content

Viewers also liked

dominion resources GAAP Reconciliations and Footnotes
dominion resources GAAP Reconciliations and Footnotesdominion resources GAAP Reconciliations and Footnotes
dominion resources GAAP Reconciliations and Footnotes
finance17
 
Portfolio Sector Lokale Besturen
Portfolio Sector Lokale BesturenPortfolio Sector Lokale Besturen
Portfolio Sector Lokale Besturenkde73
 
Bangkok M&E[1] Nigel
Bangkok M&E[1] NigelBangkok M&E[1] Nigel
Bangkok M&E[1] Nigel
sakphouseth
 
nike FY2007Q2dec20
 nike FY2007Q2dec20 nike FY2007Q2dec20
nike FY2007Q2dec20
finance16
 
Vehiculos de eficiencia energetica
Vehiculos de eficiencia energeticaVehiculos de eficiencia energetica
Vehiculos de eficiencia energetica
laura_y_alejandra
 
Dick Carey Key
Dick Carey KeyDick Carey Key
Dick Carey Key
Martina Henke
 

Viewers also liked (7)

dominion resources GAAP Reconciliations and Footnotes
dominion resources GAAP Reconciliations and Footnotesdominion resources GAAP Reconciliations and Footnotes
dominion resources GAAP Reconciliations and Footnotes
 
Portfolio Sector Lokale Besturen
Portfolio Sector Lokale BesturenPortfolio Sector Lokale Besturen
Portfolio Sector Lokale Besturen
 
Bangkok M&E[1] Nigel
Bangkok M&E[1] NigelBangkok M&E[1] Nigel
Bangkok M&E[1] Nigel
 
nike FY2007Q2dec20
 nike FY2007Q2dec20 nike FY2007Q2dec20
nike FY2007Q2dec20
 
Vehiculos de eficiencia energetica
Vehiculos de eficiencia energeticaVehiculos de eficiencia energetica
Vehiculos de eficiencia energetica
 
itw_200510K
itw_200510Kitw_200510K
itw_200510K
 
Dick Carey Key
Dick Carey KeyDick Carey Key
Dick Carey Key
 

Similar to anheuser-busch 2006AR_ConsolidatedFinStatements

Progressive 2005review
Progressive 2005reviewProgressive 2005review
Progressive 2005review
finance18
 
Progressive 2006review
 Progressive 2006review Progressive 2006review
Progressive 2006review
finance18
 
Progressive 2004 review
Progressive 2004 reviewProgressive 2004 review
Progressive 2004 review
finance18
 
Progressive_ 2004 review
Progressive_ 2004 reviewProgressive_ 2004 review
Progressive_ 2004 review
finance18
 
Progressive 2003 review
Progressive 2003 reviewProgressive 2003 review
Progressive 2003 review
finance18
 
WellPoint2000 annual report
WellPoint2000 annual reportWellPoint2000 annual report
WellPoint2000 annual report
finance4
 
RYDERFINAL Q407ryderfinancialinformation
RYDERFINAL Q407ryderfinancialinformationRYDERFINAL Q407ryderfinancialinformation
RYDERFINAL Q407ryderfinancialinformation
finance44
 
Q407ryderfinancialinformation
Q407ryderfinancialinformationQ407ryderfinancialinformation
Q407ryderfinancialinformation
finance44
 
RYDERFINAL Q407ryderfinancialinformation
RYDERFINAL Q407ryderfinancialinformationRYDERFINAL Q407ryderfinancialinformation
RYDERFINAL Q407ryderfinancialinformation
finance44
 
micron technollogy 1998_Q1_10Q
micron technollogy 1998_Q1_10Qmicron technollogy 1998_Q1_10Q
micron technollogy 1998_Q1_10Q
finance36
 
micron technollogy 1999_Q1_10Q
micron technollogy 1999_Q1_10Qmicron technollogy 1999_Q1_10Q
micron technollogy 1999_Q1_10Q
finance36
 
Q207tables
Q207tablesQ207tables
Q207tables
finance44
 
Q207tables
Q207tablesQ207tables
Q207tables
finance44
 
RYDERFINAL Q207tables
RYDERFINAL Q207tablesRYDERFINAL Q207tables
RYDERFINAL Q207tables
finance44
 
RYDERFINAL_PR_TABLES_Q308
RYDERFINAL_PR_TABLES_Q308RYDERFINAL_PR_TABLES_Q308
RYDERFINAL_PR_TABLES_Q308
finance44
 
RYDERFINAL_PR_TABLES_Q308
RYDERFINAL_PR_TABLES_Q308RYDERFINAL_PR_TABLES_Q308
RYDERFINAL_PR_TABLES_Q308
finance44
 
RYDERFINAL_PR_TABLES_Q308
RYDERFINAL_PR_TABLES_Q308RYDERFINAL_PR_TABLES_Q308
RYDERFINAL_PR_TABLES_Q308
finance44
 
RYDERFINAL NewnewFINALPRTABLESQ108
RYDERFINAL NewnewFINALPRTABLESQ108RYDERFINAL NewnewFINALPRTABLESQ108
RYDERFINAL NewnewFINALPRTABLESQ108
finance44
 
RYDERFINAL NewnewFINALPRTABLESQ108
RYDERFINAL NewnewFINALPRTABLESQ108RYDERFINAL NewnewFINALPRTABLESQ108
RYDERFINAL NewnewFINALPRTABLESQ108
finance44
 
NewnewFINALPRTABLESQ108
NewnewFINALPRTABLESQ108NewnewFINALPRTABLESQ108
NewnewFINALPRTABLESQ108
finance44
 

Similar to anheuser-busch 2006AR_ConsolidatedFinStatements (20)

Progressive 2005review
Progressive 2005reviewProgressive 2005review
Progressive 2005review
 
Progressive 2006review
 Progressive 2006review Progressive 2006review
Progressive 2006review
 
Progressive 2004 review
Progressive 2004 reviewProgressive 2004 review
Progressive 2004 review
 
Progressive_ 2004 review
Progressive_ 2004 reviewProgressive_ 2004 review
Progressive_ 2004 review
 
Progressive 2003 review
Progressive 2003 reviewProgressive 2003 review
Progressive 2003 review
 
WellPoint2000 annual report
WellPoint2000 annual reportWellPoint2000 annual report
WellPoint2000 annual report
 
RYDERFINAL Q407ryderfinancialinformation
RYDERFINAL Q407ryderfinancialinformationRYDERFINAL Q407ryderfinancialinformation
RYDERFINAL Q407ryderfinancialinformation
 
Q407ryderfinancialinformation
Q407ryderfinancialinformationQ407ryderfinancialinformation
Q407ryderfinancialinformation
 
RYDERFINAL Q407ryderfinancialinformation
RYDERFINAL Q407ryderfinancialinformationRYDERFINAL Q407ryderfinancialinformation
RYDERFINAL Q407ryderfinancialinformation
 
micron technollogy 1998_Q1_10Q
micron technollogy 1998_Q1_10Qmicron technollogy 1998_Q1_10Q
micron technollogy 1998_Q1_10Q
 
micron technollogy 1999_Q1_10Q
micron technollogy 1999_Q1_10Qmicron technollogy 1999_Q1_10Q
micron technollogy 1999_Q1_10Q
 
Q207tables
Q207tablesQ207tables
Q207tables
 
Q207tables
Q207tablesQ207tables
Q207tables
 
RYDERFINAL Q207tables
RYDERFINAL Q207tablesRYDERFINAL Q207tables
RYDERFINAL Q207tables
 
RYDERFINAL_PR_TABLES_Q308
RYDERFINAL_PR_TABLES_Q308RYDERFINAL_PR_TABLES_Q308
RYDERFINAL_PR_TABLES_Q308
 
RYDERFINAL_PR_TABLES_Q308
RYDERFINAL_PR_TABLES_Q308RYDERFINAL_PR_TABLES_Q308
RYDERFINAL_PR_TABLES_Q308
 
RYDERFINAL_PR_TABLES_Q308
RYDERFINAL_PR_TABLES_Q308RYDERFINAL_PR_TABLES_Q308
RYDERFINAL_PR_TABLES_Q308
 
RYDERFINAL NewnewFINALPRTABLESQ108
RYDERFINAL NewnewFINALPRTABLESQ108RYDERFINAL NewnewFINALPRTABLESQ108
RYDERFINAL NewnewFINALPRTABLESQ108
 
RYDERFINAL NewnewFINALPRTABLESQ108
RYDERFINAL NewnewFINALPRTABLESQ108RYDERFINAL NewnewFINALPRTABLESQ108
RYDERFINAL NewnewFINALPRTABLESQ108
 
NewnewFINALPRTABLESQ108
NewnewFINALPRTABLESQ108NewnewFINALPRTABLESQ108
NewnewFINALPRTABLESQ108
 

More from finance15

20040930_google_10Q
20040930_google_10Q20040930_google_10Q
20040930_google_10Q
finance15
 
2004_google_annual_report
2004_google_annual_report2004_google_annual_report
2004_google_annual_reportfinance15
 
20050331_google_10Q
20050331_google_10Q20050331_google_10Q
20050331_google_10Q
finance15
 
20050630_google_10Q
20050630_google_10Q20050630_google_10Q
20050630_google_10Q
finance15
 
20050930_google_10Q
20050930_google_10Q20050930_google_10Q
20050930_google_10Q
finance15
 
2005_google_annual_report
2005_google_annual_report2005_google_annual_report
2005_google_annual_reportfinance15
 
20060331_google_10Q
20060331_google_10Q20060331_google_10Q
20060331_google_10Qfinance15
 
20060630_google_10Q
20060630_google_10Q20060630_google_10Q
20060630_google_10Q
finance15
 
20060930_google_10Q
20060930_google_10Q20060930_google_10Q
20060930_google_10Q
finance15
 
2006Q3_google_earnings_slides
2006Q3_google_earnings_slides2006Q3_google_earnings_slides
2006Q3_google_earnings_slides
finance15
 
2006Q4_google_earnings_slides
2006Q4_google_earnings_slides2006Q4_google_earnings_slides
2006Q4_google_earnings_slides
finance15
 
20070331_google_10Q
20070331_google_10Q20070331_google_10Q
20070331_google_10Qfinance15
 
2007Q1_google_earnings_slides
2007Q1_google_earnings_slides2007Q1_google_earnings_slides
2007Q1_google_earnings_slides
finance15
 
2007Q2_google_earnings_slides
2007Q2_google_earnings_slides2007Q2_google_earnings_slides
2007Q2_google_earnings_slides
finance15
 
20070930_google_10Q
20070930_google_10Q20070930_google_10Q
20070930_google_10Q
finance15
 
2007Q3_google_earnings_slides
2007Q3_google_earnings_slides2007Q3_google_earnings_slides
2007Q3_google_earnings_slides
finance15
 
2007_google_annual_report
2007_google_annual_report2007_google_annual_report
2007_google_annual_reportfinance15
 
2007Q4_google_earnings_slides
2007Q4_google_earnings_slides2007Q4_google_earnings_slides
2007Q4_google_earnings_slides
finance15
 
2008Q1_google_earnings_slides
2008Q1_google_earnings_slides2008Q1_google_earnings_slides
2008Q1_google_earnings_slides
finance15
 
2008Q2_google_earnings_slides
2008Q2_google_earnings_slides2008Q2_google_earnings_slides
2008Q2_google_earnings_slides
finance15
 

More from finance15 (20)

20040930_google_10Q
20040930_google_10Q20040930_google_10Q
20040930_google_10Q
 
2004_google_annual_report
2004_google_annual_report2004_google_annual_report
2004_google_annual_report
 
20050331_google_10Q
20050331_google_10Q20050331_google_10Q
20050331_google_10Q
 
20050630_google_10Q
20050630_google_10Q20050630_google_10Q
20050630_google_10Q
 
20050930_google_10Q
20050930_google_10Q20050930_google_10Q
20050930_google_10Q
 
2005_google_annual_report
2005_google_annual_report2005_google_annual_report
2005_google_annual_report
 
20060331_google_10Q
20060331_google_10Q20060331_google_10Q
20060331_google_10Q
 
20060630_google_10Q
20060630_google_10Q20060630_google_10Q
20060630_google_10Q
 
20060930_google_10Q
20060930_google_10Q20060930_google_10Q
20060930_google_10Q
 
2006Q3_google_earnings_slides
2006Q3_google_earnings_slides2006Q3_google_earnings_slides
2006Q3_google_earnings_slides
 
2006Q4_google_earnings_slides
2006Q4_google_earnings_slides2006Q4_google_earnings_slides
2006Q4_google_earnings_slides
 
20070331_google_10Q
20070331_google_10Q20070331_google_10Q
20070331_google_10Q
 
2007Q1_google_earnings_slides
2007Q1_google_earnings_slides2007Q1_google_earnings_slides
2007Q1_google_earnings_slides
 
2007Q2_google_earnings_slides
2007Q2_google_earnings_slides2007Q2_google_earnings_slides
2007Q2_google_earnings_slides
 
20070930_google_10Q
20070930_google_10Q20070930_google_10Q
20070930_google_10Q
 
2007Q3_google_earnings_slides
2007Q3_google_earnings_slides2007Q3_google_earnings_slides
2007Q3_google_earnings_slides
 
2007_google_annual_report
2007_google_annual_report2007_google_annual_report
2007_google_annual_report
 
2007Q4_google_earnings_slides
2007Q4_google_earnings_slides2007Q4_google_earnings_slides
2007Q4_google_earnings_slides
 
2008Q1_google_earnings_slides
2008Q1_google_earnings_slides2008Q1_google_earnings_slides
2008Q1_google_earnings_slides
 
2008Q2_google_earnings_slides
2008Q2_google_earnings_slides2008Q2_google_earnings_slides
2008Q2_google_earnings_slides
 

Recently uploaded

Earn a passive income with prosocial investing
Earn a passive income with prosocial investingEarn a passive income with prosocial investing
Earn a passive income with prosocial investing
Colin R. Turner
 
FCCS Basic Accounts Outline and Hierarchy.pptx
FCCS Basic Accounts Outline and Hierarchy.pptxFCCS Basic Accounts Outline and Hierarchy.pptx
FCCS Basic Accounts Outline and Hierarchy.pptx
nalamynandan
 
Does teamwork really matter? Looking beyond the job posting to understand lab...
Does teamwork really matter? Looking beyond the job posting to understand lab...Does teamwork really matter? Looking beyond the job posting to understand lab...
Does teamwork really matter? Looking beyond the job posting to understand lab...
Labour Market Information Council | Conseil de l’information sur le marché du travail
 
WhatsPump Thriving in the Whirlwind of Biden’s Crypto Roller Coaster
WhatsPump Thriving in the Whirlwind of Biden’s Crypto Roller CoasterWhatsPump Thriving in the Whirlwind of Biden’s Crypto Roller Coaster
WhatsPump Thriving in the Whirlwind of Biden’s Crypto Roller Coaster
muslimdavidovich670
 
快速制作美国迈阿密大学牛津分校毕业证文凭证书英文原版一模一样
快速制作美国迈阿密大学牛津分校毕业证文凭证书英文原版一模一样快速制作美国迈阿密大学牛津分校毕业证文凭证书英文原版一模一样
快速制作美国迈阿密大学牛津分校毕业证文凭证书英文原版一模一样
rlo9fxi
 
Tdasx: Unveiling the Trillion-Dollar Potential of Bitcoin DeFi
Tdasx: Unveiling the Trillion-Dollar Potential of Bitcoin DeFiTdasx: Unveiling the Trillion-Dollar Potential of Bitcoin DeFi
Tdasx: Unveiling the Trillion-Dollar Potential of Bitcoin DeFi
nimaruinazawa258
 
Abhay Bhutada Leads Poonawalla Fincorp To Record Low NPA And Unprecedented Gr...
Abhay Bhutada Leads Poonawalla Fincorp To Record Low NPA And Unprecedented Gr...Abhay Bhutada Leads Poonawalla Fincorp To Record Low NPA And Unprecedented Gr...
Abhay Bhutada Leads Poonawalla Fincorp To Record Low NPA And Unprecedented Gr...
Vighnesh Shashtri
 
Who Is Abhay Bhutada, MD of Poonawalla Fincorp
Who Is Abhay Bhutada, MD of Poonawalla FincorpWho Is Abhay Bhutada, MD of Poonawalla Fincorp
Who Is Abhay Bhutada, MD of Poonawalla Fincorp
beulahfernandes8
 
2. Elemental Economics - Mineral demand.pdf
2. Elemental Economics - Mineral demand.pdf2. Elemental Economics - Mineral demand.pdf
2. Elemental Economics - Mineral demand.pdf
Neal Brewster
 
1.2 Business Ideas Business Ideas Busine
1.2 Business Ideas Business Ideas Busine1.2 Business Ideas Business Ideas Busine
1.2 Business Ideas Business Ideas Busine
Lawrence101
 
Independent Study - College of Wooster Research (2023-2024) FDI, Culture, Glo...
Independent Study - College of Wooster Research (2023-2024) FDI, Culture, Glo...Independent Study - College of Wooster Research (2023-2024) FDI, Culture, Glo...
Independent Study - College of Wooster Research (2023-2024) FDI, Culture, Glo...
AntoniaOwensDetwiler
 
STREETONOMICS: Exploring the Uncharted Territories of Informal Markets throug...
STREETONOMICS: Exploring the Uncharted Territories of Informal Markets throug...STREETONOMICS: Exploring the Uncharted Territories of Informal Markets throug...
STREETONOMICS: Exploring the Uncharted Territories of Informal Markets throug...
sameer shah
 
^%$Zone1:+971)581248768’][* Legit & Safe #Abortion #Pills #For #Sale In #Duba...
^%$Zone1:+971)581248768’][* Legit & Safe #Abortion #Pills #For #Sale In #Duba...^%$Zone1:+971)581248768’][* Legit & Safe #Abortion #Pills #For #Sale In #Duba...
^%$Zone1:+971)581248768’][* Legit & Safe #Abortion #Pills #For #Sale In #Duba...
mayaclinic18
 
This assessment plan proposal is to outline a structured approach to evaluati...
This assessment plan proposal is to outline a structured approach to evaluati...This assessment plan proposal is to outline a structured approach to evaluati...
This assessment plan proposal is to outline a structured approach to evaluati...
lamluanvan.net Viết thuê luận văn
 
Who Is the Largest Producer of Soybean in India Now.pdf
Who Is the Largest Producer of Soybean in India Now.pdfWho Is the Largest Producer of Soybean in India Now.pdf
Who Is the Largest Producer of Soybean in India Now.pdf
Price Vision
 
Instant Issue Debit Cards - School Designs
Instant Issue Debit Cards - School DesignsInstant Issue Debit Cards - School Designs
Instant Issue Debit Cards - School Designs
egoetzinger
 
Donald Trump Presentation and his life.pptx
Donald Trump Presentation and his life.pptxDonald Trump Presentation and his life.pptx
Donald Trump Presentation and his life.pptx
SerdarHudaykuliyew
 
falcon-invoice-discounting-a-strategic-approach-to-optimize-investments
falcon-invoice-discounting-a-strategic-approach-to-optimize-investmentsfalcon-invoice-discounting-a-strategic-approach-to-optimize-investments
falcon-invoice-discounting-a-strategic-approach-to-optimize-investments
Falcon Invoice Discounting
 
What's a worker’s market? Job quality and labour market tightness
What's a worker’s market? Job quality and labour market tightnessWhat's a worker’s market? Job quality and labour market tightness
What's a worker’s market? Job quality and labour market tightness
Labour Market Information Council | Conseil de l’information sur le marché du travail
 
The Rise of Generative AI in Finance: Reshaping the Industry with Synthetic Data
The Rise of Generative AI in Finance: Reshaping the Industry with Synthetic DataThe Rise of Generative AI in Finance: Reshaping the Industry with Synthetic Data
The Rise of Generative AI in Finance: Reshaping the Industry with Synthetic Data
Champak Jhagmag
 

Recently uploaded (20)

Earn a passive income with prosocial investing
Earn a passive income with prosocial investingEarn a passive income with prosocial investing
Earn a passive income with prosocial investing
 
FCCS Basic Accounts Outline and Hierarchy.pptx
FCCS Basic Accounts Outline and Hierarchy.pptxFCCS Basic Accounts Outline and Hierarchy.pptx
FCCS Basic Accounts Outline and Hierarchy.pptx
 
Does teamwork really matter? Looking beyond the job posting to understand lab...
Does teamwork really matter? Looking beyond the job posting to understand lab...Does teamwork really matter? Looking beyond the job posting to understand lab...
Does teamwork really matter? Looking beyond the job posting to understand lab...
 
WhatsPump Thriving in the Whirlwind of Biden’s Crypto Roller Coaster
WhatsPump Thriving in the Whirlwind of Biden’s Crypto Roller CoasterWhatsPump Thriving in the Whirlwind of Biden’s Crypto Roller Coaster
WhatsPump Thriving in the Whirlwind of Biden’s Crypto Roller Coaster
 
快速制作美国迈阿密大学牛津分校毕业证文凭证书英文原版一模一样
快速制作美国迈阿密大学牛津分校毕业证文凭证书英文原版一模一样快速制作美国迈阿密大学牛津分校毕业证文凭证书英文原版一模一样
快速制作美国迈阿密大学牛津分校毕业证文凭证书英文原版一模一样
 
Tdasx: Unveiling the Trillion-Dollar Potential of Bitcoin DeFi
Tdasx: Unveiling the Trillion-Dollar Potential of Bitcoin DeFiTdasx: Unveiling the Trillion-Dollar Potential of Bitcoin DeFi
Tdasx: Unveiling the Trillion-Dollar Potential of Bitcoin DeFi
 
Abhay Bhutada Leads Poonawalla Fincorp To Record Low NPA And Unprecedented Gr...
Abhay Bhutada Leads Poonawalla Fincorp To Record Low NPA And Unprecedented Gr...Abhay Bhutada Leads Poonawalla Fincorp To Record Low NPA And Unprecedented Gr...
Abhay Bhutada Leads Poonawalla Fincorp To Record Low NPA And Unprecedented Gr...
 
Who Is Abhay Bhutada, MD of Poonawalla Fincorp
Who Is Abhay Bhutada, MD of Poonawalla FincorpWho Is Abhay Bhutada, MD of Poonawalla Fincorp
Who Is Abhay Bhutada, MD of Poonawalla Fincorp
 
2. Elemental Economics - Mineral demand.pdf
2. Elemental Economics - Mineral demand.pdf2. Elemental Economics - Mineral demand.pdf
2. Elemental Economics - Mineral demand.pdf
 
1.2 Business Ideas Business Ideas Busine
1.2 Business Ideas Business Ideas Busine1.2 Business Ideas Business Ideas Busine
1.2 Business Ideas Business Ideas Busine
 
Independent Study - College of Wooster Research (2023-2024) FDI, Culture, Glo...
Independent Study - College of Wooster Research (2023-2024) FDI, Culture, Glo...Independent Study - College of Wooster Research (2023-2024) FDI, Culture, Glo...
Independent Study - College of Wooster Research (2023-2024) FDI, Culture, Glo...
 
STREETONOMICS: Exploring the Uncharted Territories of Informal Markets throug...
STREETONOMICS: Exploring the Uncharted Territories of Informal Markets throug...STREETONOMICS: Exploring the Uncharted Territories of Informal Markets throug...
STREETONOMICS: Exploring the Uncharted Territories of Informal Markets throug...
 
^%$Zone1:+971)581248768’][* Legit & Safe #Abortion #Pills #For #Sale In #Duba...
^%$Zone1:+971)581248768’][* Legit & Safe #Abortion #Pills #For #Sale In #Duba...^%$Zone1:+971)581248768’][* Legit & Safe #Abortion #Pills #For #Sale In #Duba...
^%$Zone1:+971)581248768’][* Legit & Safe #Abortion #Pills #For #Sale In #Duba...
 
This assessment plan proposal is to outline a structured approach to evaluati...
This assessment plan proposal is to outline a structured approach to evaluati...This assessment plan proposal is to outline a structured approach to evaluati...
This assessment plan proposal is to outline a structured approach to evaluati...
 
Who Is the Largest Producer of Soybean in India Now.pdf
Who Is the Largest Producer of Soybean in India Now.pdfWho Is the Largest Producer of Soybean in India Now.pdf
Who Is the Largest Producer of Soybean in India Now.pdf
 
Instant Issue Debit Cards - School Designs
Instant Issue Debit Cards - School DesignsInstant Issue Debit Cards - School Designs
Instant Issue Debit Cards - School Designs
 
Donald Trump Presentation and his life.pptx
Donald Trump Presentation and his life.pptxDonald Trump Presentation and his life.pptx
Donald Trump Presentation and his life.pptx
 
falcon-invoice-discounting-a-strategic-approach-to-optimize-investments
falcon-invoice-discounting-a-strategic-approach-to-optimize-investmentsfalcon-invoice-discounting-a-strategic-approach-to-optimize-investments
falcon-invoice-discounting-a-strategic-approach-to-optimize-investments
 
What's a worker’s market? Job quality and labour market tightness
What's a worker’s market? Job quality and labour market tightnessWhat's a worker’s market? Job quality and labour market tightness
What's a worker’s market? Job quality and labour market tightness
 
The Rise of Generative AI in Finance: Reshaping the Industry with Synthetic Data
The Rise of Generative AI in Finance: Reshaping the Industry with Synthetic DataThe Rise of Generative AI in Finance: Reshaping the Industry with Synthetic Data
The Rise of Generative AI in Finance: Reshaping the Industry with Synthetic Data
 

anheuser-busch 2006AR_ConsolidatedFinStatements

  • 1. CONSOLIDATED BALANCE SHEET Year Ended December 31 (in millions, except per share) 2006 2005 Assets Current Assets Cash $ 219.2 $ 225.8 Accounts receivable 720.2 681.4 Inventories 694.9 654.5 Other current assets 195.2 197.0 Total current assets 1,829.5 1,758.7 Investments in affiliated companies 3,680.3 3,448.2 Plant and equipment, net 8,916.1 9,041.6 Intangible assets, including goodwill of $1,077.8 and $1,034.5, respectively 1,367.2 1,232.6 Other assets 584.1 1,073.9 Total Assets $ 16,377.2 $ 16,555.0 Liabilities and Shareholders Equity Current Liabilities Accounts payable $ 1,426.3 $ 1,249.5 Accrued salaries, wages and benefits 342.8 250.9 Accrued taxes 133.9 156.7 Accrued interest 124.2 123.7 Other current liabilities 218.9 201.8 Total current liabilities 2,246.1 1,982.6 Retirement benefits 1,191.5 1,412.8 Debt 7,653.5 7,972.1 Deferred income taxes 1,194.5 1,345.9 Other long-term liabilities 152.9 161.8 Shareholders Equity Common stock, $1.00 par value, authorized 1.6 billion shares 1,473.7 1,468.6 Capital in excess of par value 2,962.5 2,685.9 Retained earnings 16,741.0 15,698.0 Treasury stock, at cost (16,007.7) (15,258.9) Accumulated nonowner changes in shareholders equity (1,230.8) (913.8) Total Shareholders Equity 3,938.7 3,679.8 Commitments and contingencies — — Total Liabilities and Shareholders Equity $ 16,377.2 $ 16,555.0 The footnotes on pages 47 - 63 of this repor t are an integral component of the company’s consolidated financial statements. 43 ANHEUSER-BUSCH COMPANIES, INC.
  • 2. CONSOLIDATED STATEMENT OF INCOME Year Ended December 31 (in millions, except per share) 2006 2005 2004 Gross sales $ 17,957.8 $17,253.5 $ 17,160.2 Excise taxes (2,240.7) (2,217.8) (2,226.0) Net sales 15,717.1 15,035.7 14,934.2 Cost of sales (10,165.0) (9,606.3) (9,020.0) Gross profit 5,552.1 5,429.4 5,914.2 Marketing, distribution and administrative expenses (2,832.5) (2,837.5) (2,740.5) Litigation settlement — (105.0) — Operating income 2,719.6 2,486.9 3,173.7 Interest expense (451.3) (454.5) (426.9) Interest capitalized 17.6 19.9 21.9 Interest income 1.8 2.4 4.7 Other income/(expense), net (10.8) 2.7 38.7 Income before income taxes 2,276.9 2,057.4 2,812.1 Provision for income taxes (900.5) (811.1) (1,097.5) Equity income, net of tax 588.8 498.1 404.1 Net income $ 1,965.2 $ 1,744.4 $ 2,118.7 Basic earnings per share $ 2.55 $ 2.24 $ 2.65 Diluted earnings per share $ 2.53 $ 2.23 $ 2.62 The footnotes on pages 47 - 63 of this repor t are an integral component of the company’s consolidated financial statements. 44 ANHEUSER-BUSCH COMPANIES, INC.
  • 3. CONSOLIDATED STATEMENT OF CHANGES IN SHAREHOLDERS EQUITY Year Ended December 31 (in millions, except per share) 2006 2005 2004 Common Stock, $1.00 Par Value Balance, beginning of period $ 1,468.6 $ 1,463.0 $ 1,457.9 Shares issued under stock plans 5.1 5.6 5.1 Balance, end of period $ 1,473.7 $ 1,468.6 $ 1,463.0 Capital in Excess of Par Value Balance beginning of period $ 2,685.9 $ 2,387.9 $ 1,981.0 Stock compensation related 138.2 134.1 187.3 Shares issued under stock plans 138.4 163.9 145.6 Grupo Modelo capital transaction — — 74.0 Balance, end of period $ 2,962.5 $ 2,685.9 $ 2,387.9 Retained Earnings Balance, beginning of period $ 15,698.0 $ 14,754.4 $ 13,404.2 Net income 1,965.2 1,744.4 2,118.7 Common dividends paid (per share: 2006, $1.13; 2005, $1.03; 2004, $.93) (871.6) (800.8) (742.8) Deferred income tax adjustment (50.6) — (25.9) Shares issued under stock plans — — 0.2 Balance, end of period $ 16,741.0 $ 15,698.0 $ 14,754.4 Treasury Stock Balance, beginning of period $(15,258.9) $(14,638.5) $(12,939.0) Treasury stock acquired (745.9) (620.4) (1,699.5) Restricted stock cancellations (2.9) — — Balance, end of period $(16,007.7) $(15,258.9) $(14,638.5) Accumulated Nonowner Changes in Shareholders Equity Balance, beginning of period $ (913.8) $ (988.9) $ (890.3) Foreign currency translation gains/(losses) (70.2) 184.5 102.9 Deferred hedging gains/(losses) 4.5 (1.1) (61.1) Deferred securities valuation gains/(losses) 1.0 (95.6) (76.4) Deferred retirement benefits costs (252.3) (12.7) (64.0) Total changes, net of deferred income taxes (317.0) 75.1 (98.6) Balance, end of period $ (1,230.8) $ (913.8) $ (988.9) ESOP Debt Guarantee Balance, beginning of period $ — $ — $ (46.3) Annual debt service — — 46.3 Balance, end of period $ — $ — $ — Total Shareholders Equity $ 3,938.7 $ 3,679.8 $ 2,977.9 Net Income and Nonowner Changes in Shareholders Equity Net income $ 1,965.2 $ 1,744.4 $ 2,118.7 Total nonowner changes in shareholders equity, net of deferred income taxes (317.0) 75.1 (98.6) Combined Net Income and Nonowner Changes in Shareholders Equity $ 1,648.2 $ 1,819.5 $ 2,020.1 The footnotes on pages 47 - 63 of this repor t are an integral component of the company’s consolidated financial statements. 45 ANHEUSER-BUSCH COMPANIES, INC.
  • 4. CONSOLIDATED STATEMENT OF CASH FLOWS Year Ended December 31 (in millions) 2006 2005 2004 Cash Flow from Operating Activities Net Income $ 1,965.2 $ 1,744.4 $ 2,118.7 Adjustments to reconcile net income to cash provided by operating activities: Depreciation and amor tization 988.7 979.0 932.7 Stock compensation expense 122.9 134.1 187.3 Increase/(Decrease) in deferred income taxes (45.8) (39.1) 121.4 Gain on sale of business — (15.4) (13.4) Undistributed earnings of affiliated companies (341.8) (288.0) (225.1) Other, net (168.6) 136.6 (25.0) Operating cash flow before change in working capital 2,520.6 2,651.6 3,096.6 (Increase)/Decrease in working capital 188.8 50.3 (181.6) Cash provided by operating activities 2,709.4 2,701.9 2,915.0 Cash Flow from Investing Activities Capital expenditures (812.5) (1,136.7) (1,089.6) New business acquisitions (101.0) — (727.9) Proceeds from sale of business — 48.3 302.5 Cash used for investing activities (913.5) (1,088.4) (1,515.0) Cash Flow from Financing Activities Increase in debt 334.8 100.0 1,443.8 Decrease in debt (663.3) (456.0) (510.6) Dividends paid to shareholders (871.6) (800.8) (742.8) Acquisition of treasury stock (745.9) (620.4) (1,699.5) Shares issued under stock plans 143.5 161.4 146.1 Cash used for financing activities (1,802.5) (1,615.8) (1,363.0) Net increase in cash during the year (6.6) (2.3) 37.0 Cash, beginning of year 225.8 228.1 191.1 Cash, end of year $ 219.2 $ 225.8 $ 228.1 The footnotes on pages 47 - 63 of this repor t are an integral component of the company’s consolidated financial statements. 46 ANHEUSER-BUSCH COMPANIES, INC.