Download to read offline

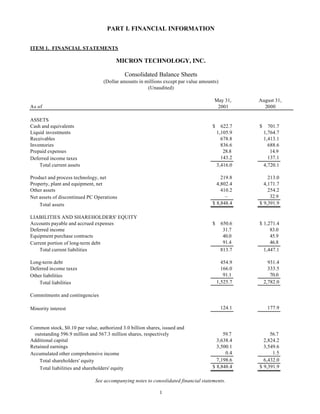
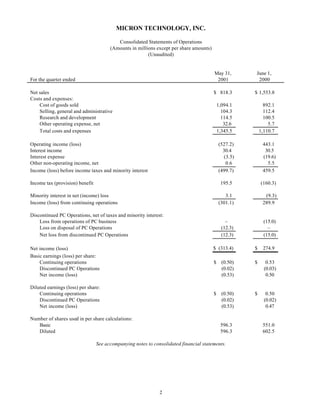
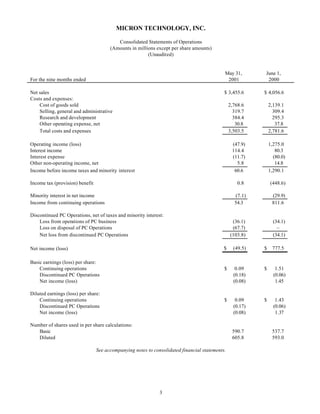
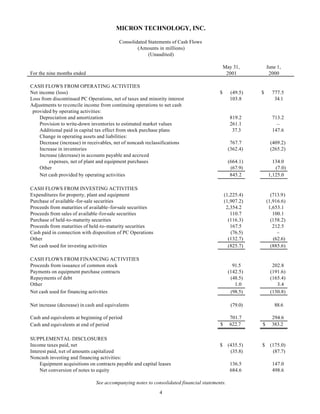
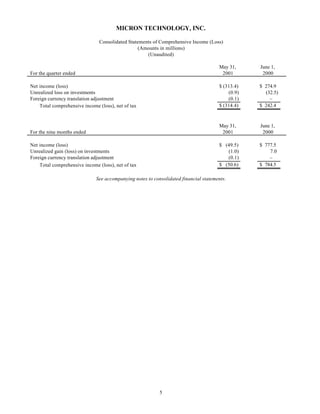
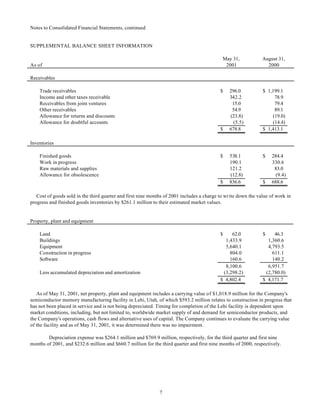
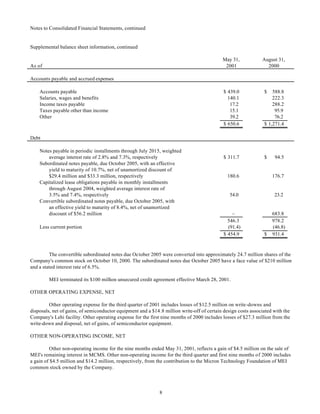
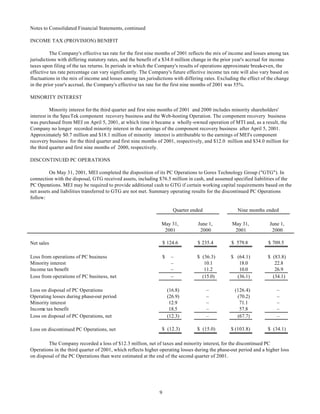
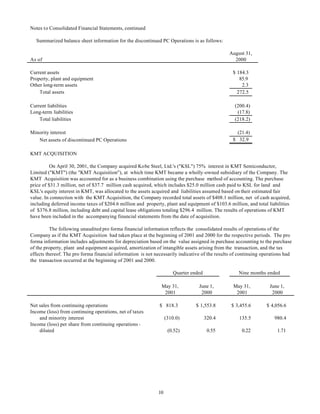
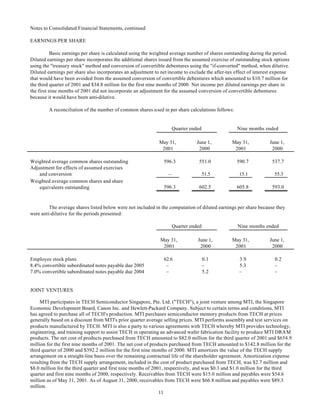
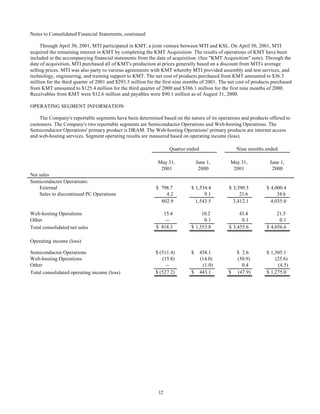
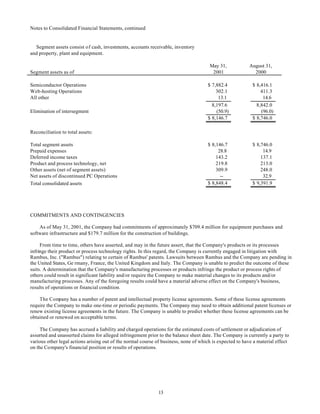
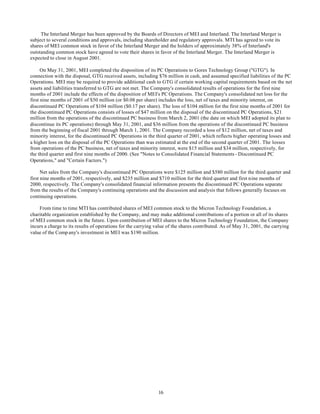
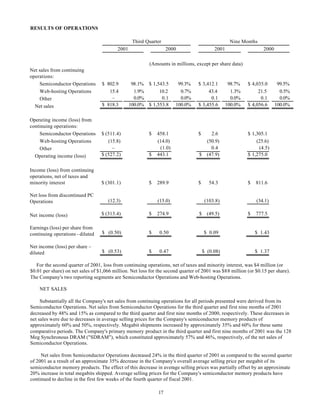
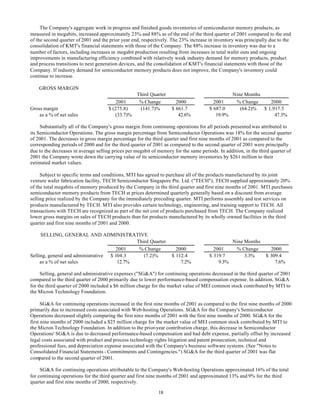
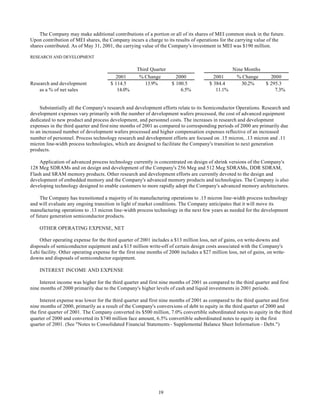
This document is Micron Technology's Form 10-Q filing for the quarterly period ended May 31, 2001. It includes their consolidated balance sheet and statements of operations for that quarter. The key details are: - As of May 31, 2001 Micron had total assets of $8.8 billion including $622.7 million of cash and $1.1 billion of liquid investments. Their total liabilities were $1.5 billion resulting in total shareholders' equity of $7.2 billion. - For the quarter ended May 31, 2001 Micron reported a net loss of $313.4 million or $0.53 per share. This included an operating loss of $


