QNBFS Daily Market Report October 28, 2021
•
0 likes•89 views

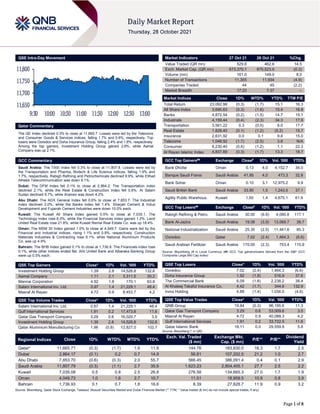
The QE Index declined 0.3% to close at 11,665.7. Losses were led by the Telecoms and Consumer Goods & Services indices, falling 1.7% and 0.6%, respectively.

Recommended
Recommended
More Related Content
What's hot
What's hot (20)
Similar to QNBFS Daily Market Report October 28, 2021
Similar to QNBFS Daily Market Report October 28, 2021 (20)
More from QNB Group
More from QNB Group (20)
Recently uploaded
Recently uploaded (20)
QNBFS Daily Market Report October 28, 2021
- 1. Page 1 of 8 QSE Intra-Day Movement Qatar Commentary The QE Index declined 0.3% to close at 11,665.7. Losses were led by the Telecoms and Consumer Goods & Services indices, falling 1.7% and 0.6%, respectively. Top losers were Ooredoo and Doha Insurance Group, falling 2.4% and 1.8%, respectively. Among the top gainers, Investment Holding Group gained 2.8%, while Aamal Company was up 2.1%. GCC Commentary Saudi Arabia: The TASI Index fell 0.3% to close at 11,807.8. Losses were led by the Transportation and Pharma, Biotech & Life Science indices, falling 1.9% and 1.7%, respectively. Rabigh Refining and Petrochemicals declined 9.9%, while Etihad Atheeb Telecommunication was down 9.1%. Dubai: The DFM Index fell 0.1% to close at 2,864.2. The Transportation index declined 2.1%, while the Real Estate & Construction index fell 0.8%. Al Salam Sudan declined 9.7%, while Aramex was down 4.2%. Abu Dhabi: The ADX General Index fell 0.6% to close at 7,853.7. The Industrial index declined 2.0%, while the Banks index fell 1.4%. Sharjah Cement & Indus Development and Fujairah Cement Industries were down 10.0% each. Kuwait: The Kuwait All Share Index gained 0.5% to close at 7,035.1. The Technology index rose 6.0%, while the Financial Services index gained 1.2%. Land United Real Estate rose 21.8%, while Kuwait Remal Real Estate Co. was up 18.4%. Oman: The MSM 30 Index gained 1.0% to close at 4,049.7. Gains were led by the Financial and Industrial indices, rising 1.1% and 0.8%, respectively. Construction Materials Industries & Contracting rose 6.1%, while National Aluminium Products Co. was up 4.9%. Bahrain: The BHB Index gained 0.1% to close at 1,736.9. The Financials index rose 0.1%, while other indices ended flat. Ahli United Bank and Albaraka Banking Group were up 0.5% each. QSE Top Gainers Close* 1D% Vol. ‘000 YTD% Investment Holding Group 1.39 2.8 14,526.8 132.6 Aamal Company 1.11 2.1 3,311.5 30.2 Mannai Corporation 4.92 1.8 170.1 63.8 Salam International Inv. Ltd. 0.97 1.4 21,229.1 48.4 Masraf Al Rayan 4.72 0.9 8,453.7 4.2 QSE Top Volume Trades Close* 1D% Vol. ‘000 YTD% Salam International Inv. Ltd. 0.97 1.4 21,229.1 48.4 Gulf International Services 1.91 0.2 17,473.8 11.6 Qatar Gas Transport Company 3.29 0.6 16,020.7 3.5 Investment Holding Group 1.39 2.8 14,526.8 132.6 Qatar Aluminium Manufacturing Co 1.96 (0.8) 12,827.0 102.7 Market Indicators 27 Oct 21 26 Oct 21 %Chg. Value Traded (QR mn) 529.8 462.6 14.5 Exch. Market Cap. (QR mn) 673,370.1 675,523.0 (0.3) Volume (mn) 161.0 149.0 8.0 Number of Transactions 11,355 11,934 (4.9) Companies Traded 44 45 (2.2) Market Breadth 17:23 7:37 – Market Indices Close 1D% WTD% YTD% TTM P/E Total Return 23,092.98 (0.3) (1.7) 15.1 16.3 All Share Index 3,690.63 (0.3) (1.6) 15.4 16.8 Banks 4,872.54 (0.2) (1.5) 14.7 15.1 Industrials 4,159.44 (0.4) (2.3) 34.3 17.8 Transportation 3,561.22 0.3 (0.5) 8.0 17.7 Real Estate 1,828.40 (0.1) (1.2) (5.2) 15.7 Insurance 2,631.92 0.0 0.1 9.8 15.0 Telecoms 1,048.92 (1.7) (2.5) 3.8 N/A Consumer 8,230.40 (0.6) (1.2) 1.1 22.3 Al Rayan Islamic Index 4,837.69 (0.3) (1.7) 13.3 18.7 GCC Top Gainers## Exchange Close# 1D% Vol. ‘000 YTD% Bank Dhofar Oman 0.13 4.0 4,152.7 34.0 Banque Saudi Fransi Saudi Arabia 41.95 4.0 473.3 32.8 Bank Sohar Oman 0.10 3.1 12,975.2 9.9 Saudi British Bank Saudi Arabia 33.90 1.5 1,243.5 37.1 Agility Public Warehous. Kuwait 1.00 1.4 4,675.1 61.9 GCC Top Losers## Exchange Close# 1D% Vol. ‘000 YTD% Rabigh Refining & Petro. Saudi Arabia 30.00 (9.9) 4,080.8 117.1 Bank Al-Jazira Saudi Arabia 19.08 (3.9) 13,069.7 39.7 National Industrialization Saudi Arabia 25.35 (2.5) 11,441.6 85.3 Ooredoo Qatar 7.02 (2.4) 1,464.3 (6.6) Saudi Arabian Fertilizer Saudi Arabia 170.00 (2.3) 753.4 110.9 Source: Bloomberg (# in Local Currency) (## GCC Top gainers/losers derived from the S&P GCC Composite Large Mid Cap Index) QSE Top Losers Close* 1D% Vol. ‘000 YTD% Ooredoo 7.02 (2.4) 1,464.3 (6.6) Doha Insurance Group 1.92 (1.8) 516.9 37.6 The Commercial Bank 6.09 (1.8) 2,238.2 38.4 Al Khaleej Takaful Insurance Co. 4.42 (1.7) 344.6 132.9 Inma Holding 4.88 (1.4) 1,034.0 (4.6) QSE Top Value Trades Close* 1D% Val. ‘000 YTD% QNB Group 19.84 (0.3) 96,195.6 11.3 Qatar Gas Transport Company 3.29 0.6 53,009.6 3.5 Masraf Al Rayan 4.72 0.9 40,088.3 4.2 Gulf International Services 1.91 0.2 33,722.5 11.6 Qatar Islamic Bank 18.11 0.0 29,559.9 5.8 Source: Bloomberg (* in QR) Regional Indices Close 1D% WTD% MTD% YTD% Exch. Val. Traded ($ mn) Exchange Mkt. Cap. ($ mn) P/E** P/B** Dividend Yield Qatar* 11,665.71 (0.3) (1.7) 1.6 11.8 144.76 183,830.0 16.3 1.7 2.5 Dubai 2,864.17 (0.1) 0.2 0.7 14.9 56.81 107,202.5 21.2 1.0 2.7 Abu Dhabi 7,853.70 (0.6) (0.3) 2.0 55.7 566.45 386,091.4 0.4 0.1 2.9 Saudi Arabia 11,807.79 (0.3) (1.1) 2.7 35.9 1,623.23 2,804,405.1 27.7 2.5 2.2 Kuwait 7,035.08 0.5 0.8 2.5 26.8 276.58 134,665.3 27.0 1.7 1.9 Oman 4,049.73 1.0 1.6 2.7 10.7 11.51 18,959.5 10.9 0.8 3.9 Bahrain 1,736.93 0.1 0.7 1.8 16.6 8.39 27,828.7 11.9 0.9 3.2 Source: Bloomberg, Qatar Stock Exchange, Tadawul, Muscat Securities Market and Dubai Financial Market (** TTM; * Value traded ($ mn) do not include special trades, if any) 11,650 11,700 11,750 11,800 9:30 10:00 10:30 11:00 11:30 12:00 12:30 13:00
- 2. Page 2 of 8 Qatar Market Commentary The QE Index declined 0.3% to close at 11,665.7. The Telecoms and Consumer Goods & Services indices led the losses. The index fell on the back of selling pressure from Qatari shareholders despite buying support from GCC, Arab and foreign shareholders. Ooredoo and Doha Insurance Group were the top losers, falling 2.4% and 1.8%, respectively. Among the top gainers, Investment Holding Group gained 2.8%, while Aamal Company was up 2.1%. Volume of shares traded on Wednesday rose by 8.0% to 161mn from 149.0mn on Tuesday. However, as compared to the 30-day moving average of 199.1mn, volume for the day was 19.1% lower. Salam International Inv. Ltd. and Gulf International Services were the most active stocks, contributing 13.2% and 10.9% to the total volume, respectively. Source: Qatar Stock Exchange (*as a % of traded value) Earnings Releases, Global Economic Data and Earnings Calendar Earnings Releases Company Market Currency Revenue (mn) 3Q2021 % Change YoY Operating Profit (mn) 3Q2021 % Change YoY Net Profit (mn) 3Q2021 % Change YoY Saudi Advanced Industries Co. Saudi Arabia SR 35.9 274.1% 33.8 334.8% 31.7 322.3% Methanol Chemicals Co. Saudi Arabia SR 249.6 88.7% 83.7 N/A 74.1 N/A Savola Group Saudi Arabia SR 6,048.5 31.9% 301.8 -31.3% 122.4 -56.9% United Electronics Co. Saudi Arabia SR 1,373.1 12.1% 101.9 56.8% 89.0 66.5% Saudi Automotive Services Co. Saudi Arabia SR 1,140.8 94.4% 22.9 -20.4% 11.4 -34.7% Bawan Co. Saudi Arabia SR 727.4 32.6% 48.8 33.9% 40.9 38.4% SABIC Agri-Nutrients Co. Saudi Arabia SR 2,206.8 144.6% 1,369.2 252.9% 1,206.5 203.5% Umm Al-Qura Cement Co. Saudi Arabia SR 57.0 -35.0% 19.1 -50.4% 12.5 -60.9% Middle East Paper Co. Saudi Arabia SR 279.5 66.9% 70.1 1441.8% 65.0 16882.8% Ooredoo Abu Dhabi QR 7,608.5 4.3% – – 196.6 -69.7% Source: Company data, DFM, ADX, MSM, TASI, BHB. Global Economic Data Date Market Source Indicator Period Actual Consensus Previous 10-27 US Mortgage Bankers Association MBA Mortgage Applications 22-Oct 0.30% -- -6.30% 10-27 EU European Central Bank M3 Money Supply YoY Sep 7.40% 7.40% 7.90% 10-27 Germany German Federal Statistical Office Import Price Index MoM Sep 1.30% 1.50% 1.40% 10-27 Germany German Federal Statistical Office Import Price Index YoY Sep 17.70% 17.90% 16.50% 10-27 Germany GfK AG GfK Consumer Confidence Nov 0.9 -0.5 0.4 10-27 France INSEE National Statistics Office Consumer Confidence Oct 99 101 101 10-27 France INSEE National Statistics Office PPI MoM Sep 1.70% -- 1.00% 10-27 France INSEE National Statistics Office PPI YoY Sep 11.60% -- 10.00% Source: Bloomberg (s.a. = seasonally adjusted; n.s.a. = non-seasonally adjusted; w.d.a. = working day adjusted) Earnings Calendar Tickers Company Name Date of reporting 3Q2021 results No. of days remaining Status QGRI Qatar General Insurance & Reinsurance Company 28-Oct-21 0 Due GISS Gulf International Services 28-Oct-21 0 Due BLDN Baladna 28-Oct-21 0 Due ZHCD Zad Holding Company 28-Oct-21 0 Due Source: QSE Overall Activity Buy %* Sell %* Net (QR) Qatari Individuals 37.63% 33.05% 24,262,880.0 Qatari Institutions 20.05% 32.01% (63,368,181.7) Qatari 57.68% 65.06% (39,105,301.7) GCC Individuals 0.63% 0.73% (561,021.2) GCC Institutions 7.13% 1.28% 30,969,885.2 GCC 7.75% 2.01% 30,408,864.0 Arab Individuals 8.67% 8.32% 1,830,985.5 Arab Institutions 0.00% 0.00% – Arab 8.67% 8.32% 1,830,985.5 Foreigners Individuals 2.53% 2.89% (1,954,928.8) Foreigners Institutions 23.38% 21.72% 8,791,651.0 Foreigners 25.90% 24.61% 6,836,722.2
- 3. Page 3 of 8 News Qatar ORDS' bottom line declines 69.7% YoY in 3Q2021 – Ooredoo (ORDS) reported net profit of QR196.6mn in 3Q2021 as compared to net profit of QR649.8mn (-69.7% YoY) in 3Q2020 and net loss of QR1,149.4mn in 2Q2021. The company's revenue came in at QR7,608.5mn in 3Q2021, which represents an increase of 4.3% YoY (+4.1% QoQ). EPS amounted to QR0.06 in 3Q2021 as compared to QR0.20 in 3Q2020 and loss per share of QR0.36 in 2Q2021. ORDS reported a QR22.1bn revenue in the first nine months of 2021, a 3% jump over the same period last year, mainly driven by growth in Qatar, Indonesia, and Tunisia. Excluding foreign exchange (FX) impact, revenue increased by 6%. Group EBITDA (earnings before interest, taxes, depreciation, and amortization) for the nine-month period stood at QR9.9bn with a corresponding EBITDA margin of 45%, driven by growth in Indonesia, Kuwait, and Algeria. The EBITDA growth rate stood at 7% and at 10%, excluding FX impact. Consolidated customer base increased by 2% to exceed 120mn due to strong performances in Indonesia, Oman, Algeria, and Iraq. Group net profit was negative mainly due to FX losses and the impairments in Myanmar. The negative impact was partly offset by profit from the sale and leaseback of Indosat Ooredoo’s tower assets (QR1bn) and reversals of Covid-19 FX provision. Excluding these one-offs and FX impact, net profit increased by 41%. Ooredoo Managing Director Aziz Aluthman Fakhroo said, “We are pleased to report the ongoing positive trend in the business as market activity improves in some of our core markets. This trend is even stronger excluding the FX impact with revenue growth of 6% and EBITDA growth of 10%. “Our net profit was impacted mainly due to FX losses and the impairment of our operations in Myanmar, due to the continued political unrest. The negative impact was partially offset by the gain realized on Indonesian tower sale and leaseback transaction. Excluding these one-offs and the FX impact, the net profit increased by 41%. Ooredoo Qatar continues to deliver strong results with growth in revenue of 3% and a strong EBITDA margin of 54%. Cost control measures resulted in an improved EBITDA for Ooredoo Kuwait and Ooredoo Algeria. Ooredoo Tunisia recorded an 8% increase in revenue for the nine-month period. Ooredoo Oman’s customer base increased by 6% and Asiacell recorded 7% more customers, he said. Fakhroo said Indosat Ooredoo continues to deliver a strong set of results across the board, contributing significantly towards group growth, with a 14% increase in revenue and an improved EBITDA margin of 50%. “We expect to see significant growth following the proposed merger of Indosat Ooredoo and CK Hutchison, which was announced in September. The merger will lead to the creation of a stronger number two telco operator in the Indonesian market and a new world-class digital telecoms and internet company for Indonesia. (QSE, QNB FS Research, Gulf-Times.com) QFBQ's bottom line rises 2.8% QoQ in 3Q2021 – Qatar First Bank (QFBQ) reported net profit of QR21.0mn in 3Q2021 as compared to net loss of QR20.2mn in 3Q2020 and net profit of QR20.4mn (+2.8% QoQ) in 2Q2021. Total Income increased 281.1% YoY and 104.5% QoQ in 3Q2021 to QR60.8mn. The bank's total assets stood at QR2.7bn at the end of September 30, 2021, down 6.3% YoY (-6.0% QoQ). Financing assets were QR0.4bn, registering a fall of 14.5% YoY (-8.4% QoQ) at the end of September 30, 2021. Financing liabilities rose 129.1% YoY and 3.3% QoQ to reach QR0.5bn at the end of September 30, 2021. EPS amounted to QR0.030 in 3Q2021 as compared to QR0.029 in 2Q2021. QFBQ announced its strong financial results for the nine months period ending 30 September 2021. Net profit attributable to shareholders for the nine months period amounted to QR62mn compared to a loss of 227.9mn in the same period of previous year 2020. It is QFBQ’s highest nine months accumulated profit in any year since 2016. The total income stood at QR168mn compared to the negative total income of QR82mn in the previous year 2020. The Bank achieved a significant increase of 322% in dividend income year on year, from 2.4mn to 10mn driven from real estate investments and Sukuk funds. In the nine months period ended 30 September 2021, QFBQ recorded an increase of 255% in other income sources including rental income, from 3.87mn to 13.74mn, leading to a stable income source. QFBQ continued to reduce it expenses despite the improvement in key financial indicators, with total expenses reducing by 24%. Total real estate assets under management (AUM) grew by 140% from QR1.6bn to QR3.9bn, following the acquisition of Fourteen555, a 2020 award-winning multi-tenant office building serving as headquarters for Occidental Chemical Corporation in Dallas, Texas. QFBQ got the approval of its shareholder in its Extraordinary General Assembly Meeting for a capital increase to strengthen its equity base for improved performance, long- term growth, and a stronger balance sheet. (QSE, QNB FS Research, Gulf-Times.com) MCCS posts 13.2% QoQ decline in net profit in 3Q2021 – Mannai Corporation's (MCCS) net profit rose 2,014.1% YoY (but declined 13.2% on QoQ basis) to QR72.7mn in 3Q2021. The company's revenue came in at QR3,330.4mn in 3Q2021, which represents an increase of 4.5% YoY. However, on QoQ basis revenue fell 9.6%. The earnings per share amounted to QR0.42 in 9M2021 as compared to loss per share of QR0.44 in 9M2020. MCCS has reported revenues of QR10.6bn for the nine months that ended on September 30, a growth of 24% compared to QR8.5bn for the same period in 2020, driven by growth across all major business divisions. EBITDA increased to QR918mn for the nine months that ended in September, an improvement of 79% compared to the EBITDA of QR512mn for the same period in 2020. Net profit for the nine months that ended on September 30 increased to QR190mn, an improvement of QR390mn compared to the QR200mn loss in the same period in 2020 due to the Covid-19 related disruptions. Mannai Corporation Director, Keith Higley said, “We are pleased to report robust growth in 2021 and a net profit of QR190mn for the nine months that ended in September 2021, with all of our major business lines continuing to rebound and showing strong growth following the challenging year of 2020.” (QSE, QNB FS Research, Gulf- Times.com) MPHC posts 0.3% QoQ fall in net profit in 3Q2021 – Mesaieed Petrochemical Holding Company's (MPHC) net profit rose 170.7% YoY (but fell 0.3% on QoQ basis) to QR528.9mn in 3Q2021. The company's share of profit from joint ventures came in at QR523.0mn in 3Q2021, which represents an increase of 172.2% YoY. However, on QoQ basis share of profit from joint ventures fell 0.7%. EPS amounted to QR0.11 in 9M2021 as compared to QR0.03 in 9M2020. MPHC announced a net profit of QR1.4bn for the nine-month period ended September 30 2021, representing an increase of 335% compared to the same period last year. The Group's revenue improved by 88% to reach QR3bn, compared to QR1.6bn for 9M2020. While earnings per share (EPS) grew to QR0.114 from QR0.026. Constructive macroeconomic drivers carried forward from the latter part of last year, on the back of satisfactory vaccination drive linking to easing out of lockdowns in major markets, led to a sequential recovery in demand for petrochemicals and chlor- alkali products, and positively reflected on the commodity prices. Industry-wide supply constraints marked by extreme weather calamities and global logistical bottlenecks also played a part in
- 4. Page 4 of 8 keeping the product prices favorable. Although, petrochemical prices have softened specifically in the later part of 2Q2021 following improved supply, but overall year-to-date price trajectory remained buoyant. MPHC’s operations continue to remain robust and resilient with total production for the period reaching 891000 MTs, up by 22% versus 9M2020, mainly due to improved plant operating rates during 9M2021. During the period, blended product prices on an average increased by 56% compared to 9M2020, translating into an increase of QR1.1bn in MPHC’s bottom line earnings, compared to the same period last year. Renewed product demand supplemented by supply constraints resulted in improved commodity prices. Sales volumes increased by 20% versus 9M2020, driven by improved plant operating rates. The overall growth in sales volumes translated into an increase of QR307mn in MPHC’s bottom line earnings. Compared to 2Q2021, MPHC revenue improved by 5%, while net profit remained flat. However, selling prices declined by 3% during 3Q2021 compared to 2Q2021, mainly on account of supply side ease outs particularly for the petrochemical products. Liquidity remained robust with cash and cash equivalents reaching QR3.2bn as at September 30, 2021. Total assets amounted to QR17.0bn and total equity stood at QR16.7bn. (QSE, QNB FS Research, Peninsula Qatar) DOHI posts 11.6% YoY increase but 13.5% QoQ decline in net profit in 3Q2021 – Doha Insurance Group's (DOHI) net profit rose 11.6% YoY (but declined 13.5% on QoQ basis) to QR14.3mn in 3Q2021. EPS amounted to QR0.11 in 9M2021 as compared to QR0.09 in 9M2020. (QSE, QNB FS Research) SIIS' bottom line declines 75.3% QoQ in 3Q2021 – Salam International Investment Limited (SIIS) reported net profit of QR5.2mn in 3Q2021 as compared to net loss of QR11.2mn in 3Q2020 and net profit of QR20.9mn in 2Q2021 (-75.3%). The earnings per share amounted to QR0.033 in 9M2021 as compared to loss per share of QR0.085 in 9M2020. (QSE, QNB FS Research) QCFS' net profit declines 61.9% YoY and 8.6% QoQ in 3Q2021 – Qatar Cinema and Film Distribution Company's (QCFS) net profit declined 61.9% YoY (-8.6% QoQ) to QR0.4mn in 3Q2021. EPS amounted to QR0.03 in 9M2021 as compared to QR0.06 in 9M2020. (QSE, QNB FS Research) QOIS reports net loss of QR0.5mn in 3Q2021 – Qatar Oman Investment Company (QOIS) reported net loss of QR0.5mn in 3Q2021 as compared to net profit of QR3.8mn in 3Q2020 and net profit of QR1.1mn in 2Q2021. The company's net investment and interest income came in at QR0.8mn in 3Q2021, which represents a decrease of 83.8% YoY (-63.4% QoQ). EPS amounted to QR0.020 in 9M2021 as compared to QR0.023 in 9M2020. (QSE, QNB FS Research) QIMD posts 2.6% QoQ decline in net profit in 3Q2021 – Qatar Industrial Manufacturing Company's (QIMD) net profit rose 94.7% YoY (but declined 2.6% on QoQ basis) to QR33.4mn in 3Q2021. The company's sales came in at QR118.1mn in 3Q2021, which represents an increase of 18.8% YoY. However, on QoQ basis sales fell 1.0%. EPS amounted to QR0.20 in 9M2021 as compared to QR0.13 in 9M2020. (QSE, QNB FS Research) Al Faleh Educational Holding board of directors to meet on November 10 – The Al Faleh Educational Holding has announced that its board of directors will be holding a meeting on November 10, 2021 to discuss the annual financial statements for the period ended August 31, 2021 and approve it. (QSE) QE Index ETF discloses its condensed financial statements – QE Index ETF disclosed its condensed financial statement for the nine-month period ended September 30, 2021. The statements show that the net asset value as of September 30, 2021 amounted to QR456,669,524 representing QR11.231 per unit. (QSE) QNB Group, GORD sign agreement to promote green products – QNB Group, the largest financial institution in the Middle East and Africa, signed a memorandum of understanding (MoU) with Gulf Organization for Research and Development (GORD) to promote sustainable building practices with the use of the Global Sustainability Assessment System (GSAS). As part of the agreement, QNB Group will provide green mortgage promotions to real estate projects seeking green building certifications under the GSAS framework. QNB Group is the first in the region to apply GSAS metrics as part of its efforts towards sustainable development, and dedication to its customers to always offer innovative solutions through its products and services. This collaboration with GORD will lead to introducing further attractive promotional interest rates for green properties and assets. This MOU enhances the Group’s efforts in mitigating climate change impacts with its unique products and services that encourage a change in consumer behavior towards more sustainable practices. (Qatar Tribune) GTA launches direct payment service in co-operation with QIBK – The General Tax Authority (GTA), in cooperation with Qatar Islamic Bank (QIBK), announced the launch of a direct payment service from the taxpayer’s account to the authority’s account, in order to facilitate tax paying obligations for the bank’s customers, as part of the GTA’s keenness to strengthen its system of electronic services, with a focus on e-services. The new service affirms its commitment to providing e-solutions that would contribute to the success and facilitation of the payment of tax obligations for QIBK’s customers, GTA said in a statement. The GTA stressed that it attaches great importance to the corporate sector, seeks to provide smart solutions, and is always keen to develop its services and business to keep pace with the latest developments in line with what is appropriate for taxpayers, to enable them to obtain tax services commensurate with the type and nature of their commercial activity. It also contributes to supporting their businesses in an easier and secure way through new electronic channels and modern technology, it added. (Gulf-Times.com) Major gas supplier Qatar Energy plans 'green' bonds – Qatar Energy, one of the world's top liquefied natural gas (LNG) suppliers, is working on a plan to reinvent itself as environmentally responsible for investors via a framework that will pave the way for it to sell "green" bonds in a deal likely to be worth several billion dollars, three sources with knowledge of the matter said. Qatar Energy is working on establishing an Environmental, Social and Governance (ESG) framework that would allow it to issue green bonds - debt earmarked for environmentally friendly uses, the sources said. If completed, it would be the first sale of green bonds by a national oil company in the hydrocarbon-rich Gulf. A consultancy is working on the framework and Qatar Energy sent a request for proposals to banks about two weeks ago, one of the sources said, without naming the consulting firm. Once the ESG framework is established, Qatar Energy plans to structure a green bond deal, though the debt sale is unlikely to happen this year, the source said. Qatar Energy did not immediately respond to an emailed request for comment. It was not immediately clear what proceeds from the expected sale of green bonds would be used for. There is a lack of clear definitions or standards for what constitutes a green bond globally, with some regions and countries setting out their own guidelines, including the European Commission announcing a European Green Bond Standard in July. (Bloomberg)
- 5. Page 5 of 8 Qatar September trade surplus widens to QR19.257bn – Qatar's trade surplus widened to QR19.257bn in September from +QR19.198bn in August, according to The Qatar Ministry of Development Planning and Statistics. (Bloomberg) Qatar posts QR19.26bn trade surplus in on robust exports to Asian markets – A robust expansion, especially in gas and non-crude shipments, led Qatar's trade surplus to almost triple YoY to QR19.26bn in September, according to the official estimates. The rebound in the country's merchandise trade surplus has been enabled by robust expansion in the shipments to the Asian countries during the period in review, said the figures released by the Planning and Statistics Authority. Qatar's trade surplus was up 0.3% MoM in the review period, as imports grew faster than exports. The total exports of goods (including exports of goods of domestic origin and re-exports) amounted to QR28.05bn, showing a stupendous 108.9% growth YoY and 2.8% MoM in the review period. In September this year, Qatar's shipments to China amounted to QR4.24bn or 15.1% of the total exports of the country, followed by India QR3.58bn (12.8%), South Korea QR3.46bn (12.3%), Japan QR2.61bn (9.3%) and Singapore QR2.09bn (7.4%). On a yearly basis, Qatar's exports to Singapore almost tripled and those to South Korea and China more than doubled. In the case of Japan and India, shipments from Doha witnessed 50% and 47.93% surge respectively in the review period. On a monthly basis, Qatar's exports to Singapore and South Korea were seen growing 38.37% and 9.84% respectively; while those to Japan, China and India fell 25.64%, 8.62% and 3.5% in September 2021. The exports of petroleum gases and other gaseous hydrocarbons shot up 111.2% YoY to QR17.34bn, non-crude by 217.4% to QR2.68bn, crude by 88.9% to QR3.55bn and other commodities by 79.7% to QR3.62bn in the review period. On a monthly basis, the exports of petroleum gases and other gaseous hydrocarbons were up 3.7%, non-crude by 6.4% and other commodities by 14.4%; while those of crude were seen declining 12.1%. Petroleum gases constituted 63.8% of the exports of domestic products in September 2021 compared to 63.4% a year ago period, crude 13.06% (14.52%), non-crude 9.86% (6.56%) and other commodities 13.32% (15.52%). Qatar's total imports (valued at cost insurance and freight) amounted to QR8.79bn, which showed 25.7% and 8.5% increase YoY and MoM in September 2021. (Gulf-Times.com) NW EUROPE LNG TRACKER: Qatari Cargoes Headed for UK – At least three LNG cargoes are headed for Britain from Qatar, according to ship-tracking data compiled by Bloomberg. Among latest tankers en route, Al Samriya flagged destination as Milford Haven for November 12. (Bloomberg) Qatar Credit Bureau, QFC sign MoU – Qatar Credit Bureau (CB) announced on Wednesday that it has signed a Memorandum of Understanding (MoU) with the Qatar Financial Centre (QFC). Under the MoU, Qatar Financial Centre will provide Qatar Credit Bureau with the data of the companies registered with it automatically. This memorandum aims at facilitating and accelerating the query process and companies’ access to services and credit facilities provided by banks operating in the State. This will help in increasing credit and reducing risks, thus contributing to economic growth and development. (Gulf-Times.com) International US business spending on equipment strong; auto shortages sink exports – New orders for US-made capital goods increased to a record high in September and shipments surged, pointing to strong business spending on equipment, though stretched supply chains likely hampered overall economic growth in the third quarter. Slower growth expectations were reinforced by other data from the Commerce Department on Wednesday showing the goods trade deficit widening sharply last month, with exports slumping. While wholesale inventories increased, stocks at retailers fell as supply at auto dealerships continued to decrease rapidly amid a global semiconductor shortage. The reports, which came ahead of the government’s snapshot of third-quarter gross domestic product on Thursday, had some economists ratcheting down their growth estimates. The economy is believed to have expanded at the slowest pace since the second quarter of 2020, when it suffered a historic contraction in the wake of stringent mandatory measures to contain the first wave of COVID-19 infections. Orders for non-defense capital goods excluding aircraft, a closely watched proxy for business spending plans, rose 0.8% last month to an all-time high. These so-called core capital goods orders advanced 0.5% in August. Economists polled by Reuters had forecast core capital goods orders gaining 0.5%. (Reuters) NRF: US holiday sales could hit record levels of over $800bn – US holiday sales could rise over 10% this year, a trade body said on Wednesday, as major consumer goods makers and retailers work to prevent supply chain disruptions from leaving shelves empty of in-demand toys and games. The National Retail Federation (NRF) forecast sales to increase between 8.5% and 10.5%, to between $843.4bn and $859bn, during November and December, compared with a previous high of $777.3bn last year. The numbers exclude automobile dealers, gasoline stations and restaurants. Rising income and stronger-than-ever household savings would help people pay more for goods when companies are raising prices to counter inflation, NRF said. It added there is exceptional demand for holiday products, although a survey last week highlighted customers' worry about availability. Several retailers had also begun their holiday selling as early as September, warning of longer delivery times and low product availability. Amazon.com Inc has secured more shipping storage, while Levi Strauss & Co has redirected its goods to come in through East Coast ports, away from the congested West Coast. Trade association ICSC also forecast an 8.9% increase in November-December sales, expecting total sales to reach $923bn. It also expects food and beverage establishments to grow 35.4%. (Reuters) US trade deficit widens in September; inventories mixed – The US trade deficit in goods surged in September as exports tumbled, suggesting trade probably weighed on economic growth again in the third quarter. The goods trade deficit increased 9.2% to $96.3 billion, the Commerce Department said on Wednesday. Goods exports dropped 4.7%, while imports gained 0.5%. The report, which was published ahead of Thursday’s advance third-quarter gross domestic product data, also showed wholesale inventories increased 1.1% last month. Retail inventories fell 0.2%, pulled down by a 2.4% plunge in stocks at auto dealerships, which reflected a global chip shortage which is undercutting motor vehicle production. Retail inventories, excluding autos, which go into the calculation of GDP, rose 0.6%. According to a Reuters survey of economists, the economy likely grew at a 2.7% annualized rate in the third quarter. That would be a step-down from the 6.7% rate notched in the second quarter. Inventories were depleted in the first half of the year. Economists believe the pace of decline lessened in the third quarter, accounting for the bulk of expected GDP growth. Trade has been a drag on GDP growth for a year, while inventories have subtracted from output for two straight quarters. (Reuters) UK economy forecast to return to pre-COVID level by year end, grow 6.5% GDP in 2021 – Britain’s economy is forecast to grow 6.5% in 2021, finance minister Rishi Sunak said, citing the latest projections from the Office for Budget Responsibility
- 6. Page 6 of 8 (OBR). He said the forecasts showed the economy would return to its pre-COVID level at the turn of the year – earlier than had been forecast in March. Wednesday’s 2021 forecast was also stronger than those produced in March, when the OBR had forecast 4.0% growth for 2021. Looking further ahead, the OBR forecast gross domestic product would grow 6% in 2022, 2.1% in 2023 and 1.3% in 2024. That compares with the OBR’s March forecasts of 7.3%, 1.7% and 1.6%. (Reuters) Sunak promises more spending as UK emerges from pandemic – Finance minister Rishi Sunak used a stronger forecast for Britain's post-lockdown economic recovery to promise higher public spending and he vowed to protect households from the sharp rise in inflation that could approach 5% next year. The new projections showed the world's fifth- biggest economy was expected to grow by 6.5% in 2021, up from a forecast of 4.0% made in March, when Britain was still in a coronavirus lockdown. Sunak announced multi-billion-pound investments in infrastructure, education and other areas to help Prime Minister Boris Johnson meet his "levelling up" promises to voters. In a speech to parliament on Wednesday, he also moved to ease a cost-of-living squeeze for low-earners. But the plan came with a cost: Britain's budget forecasters said the state's tax take was set to be its biggest since the 1950s, afterbig tax hikes announced by Sunak in March and September, while public spending was set for its largest sustained share of economic output since the late 1970s. Sunak said he wanted to return to his Conservative Party's traditional policy of cutting taxes before the next election, due by 2024. The higher growth forecast for 2021 meant the economy was expected to regain its pre-pandemic size at the turn of this year, not in the second quarter of 2022 as predicted in March although it was still later than in other countries. Long-term damage to the economy would also be lower, with 2% of output lost permanently, compared with 3% estimated before. (Reuters) Germany cuts 2021 growth outlook as supply problems, energy prices bite – The German government on Wednesday cut its growth forecast for this year to 2.6% but raised its estimate for next year to 4.1% as supply bottlenecks for semiconductors and rising energy costs delay the recovery in Europe’s largest economy. Confirming an earlier Reuters report, Economy Minister Peter Altmaier said the economy remained robust despite the COVID-19 pandemic, but supply chain woes in manufacturing and a surge in energy prices were complicating the recovery. “In view of the current supply bottlenecks and high energy prices worldwide, the hoped-for final spurt will not happen this year,” Altmaier said. “In 2022, the economy will gain momentum significantly.” The delayed recovery means that the German economy won’t reach its pre- crisis level this year, but likely at the beginning of 2022. The revised government forecast for gross domestic product growth compares with an April prediction for the economy to grow by 3.5% in 2021 and by 3.6% in 2022. Altmaier said automobile manufacturers are currently not able to build hundreds of thousands of cars due to a lack of semiconductors and other electronic components. (Reuters) Japan's September retail sales decline for a second month – Japan’s retail sales fell for a second month in September as consumers limited spending amid concerns over the coronavirus pandemic, reinforcing expectations the world’s third-largest economy stalled in the third quarter. Given the pandemic’s longer-than-expected impact on Japanese manufacturers and consumers, the Bank of Japan will likely lower its economic growth forecast for the current fiscal year in its quarterly report due later on Thursday. Retail sales in September slipped 0.6% from the same month a year earlier, government data showed on Thursday, better than economists’ median forecast for a 2.3% decline in a Reuters poll. It followed a 3.2% dip in August that marked the first year-on-year decline in six months. Compared with the previous month, retail sales increased a seasonally adjusted 2.7%. (Reuters) Russia says tougher monetary policy needed to slow inflation – Russia needs to toughen monetary policy to slow inflation and lower inflation expectations, Central Bank Deputy Governor Alexei Zabotkin said, days after the bank sharply raised the key rate to curb growing prices. Last Friday, the central bank, which targets inflation at 4%, raised rates for the sixth time this year to 7.5% - a level last seen in mid-2019. Inflationary expectations among Russian householders rose to 13.6% in October, the highest in nearly a year, while inflation climbed to 7.97% as of Oct. 25, driven mostly by food prices. The central bank sees inflation next year at 4-4.5%. (Reuters) Regional UAE, Qatar, Saudi lead MENA debt market activity totaling $90bn – Debt Capital Markets (DCM) in the MENA region totaled $90.9bn during the first nine months of 2021, down 8% compared to the same period last year, according to Refinitiv. The UAE was the top nation in DCM activity, with $25.8bn in related proceeds. Qatar came in second, with $20.1bn in related proceeds followed, by Saudi Arabia, Egypt and Oman. Investment-grade corporate debt recorded a total of $62.3bn, equivalent to 68% of total DCM proceeds and the highest year- to-date total since records began in 1980, the global data provider said. (Zawya) RIBL posts 19.1% YoY rise in net profit to SR1,543mn in 3Q2021 – Riyad Bank (RIBL) recorded net profit of SR1,543mn in 3Q2021, an increase of 19.1% YoY. Total operating profit fell 0.1% YoY to SR2,817mn in 3Q2021. Total income for special commissions/Financing &investments fell 8.5% YoY to SR2,175mn in 3Q2021. Total assets stood at SR318.7bn at the end of September 30, 2021 as compared to SR308.6bn at the end of September 30, 2020. Loans and advances stood at SR210.5bn (+10.3% YoY), while Clients' deposits stood at SR204.0bn (+1.3% YoY) at the end of September 30, 2021. EPS came in at SR1.47 in 3Q2021 as compared to SR1.28 in 3Q2020. (Tadawul) BJAZ posts 12.6% YoY rise in net profit to SR204.5mn in 3Q2021 – Bank AlJazira (BJAZ) recorded net profit of SR204.5mn in 3Q2021, an increase of 12.6% YoY. Total operating profit rose 8.2% YoY to SR878.3mn in 3Q2021. Total income for special commissions/Financing &investments rose 0.3% YoY to SR757.6mn in 3Q2021. Total assets stood at SR98.6bn at the end of September 30, 2021 as compared to SR91.9bn at the end of September 30, 2020. Loans and advances stood at SR58.4bn (+7.9% YoY), while Clients' deposits stood at SR74.3bn (+17.9% YoY) at the end of September 30, 2021. EPS came in at SR0.92 in 3Q2021 as compared to SR0.65 in 3Q2020. (Tadawul) Saudi investment minister says FDI up 60% this year, excluding Aramco pipeline deal – Saudi Arabia's investment minister said on Wednesday foreign direct investment (FDI) had seen a big jump this year, even without Aramco's oil pipeline sale. Minister Khalid al-Falih told an investment conference: "FDI has been fantastic this year ... 60% jump excluding Aramco oil pipeline." Saudi oil producer Aramco has agreed in April a $12.4bn deal to sell a 49% stake in its pipelines to a consortium led by US-based EIG Global Energy Partners. (Reuters) Saudi tourism fund, Ennismore to consider $400mn investment fund – Saudi Arabia’s Tourism Development Fund and Ennismore sign MoU to explore setting up a $400mn fund that would bring Ennismore’s lifestyle brands to at least 12 destinations in the kingdom. Saudi fund would identify locations
- 7. Page 7 of 8 and provide financing options for projects. Ennismore would lead on design and operations of the destinations. (Bloomberg) Saudi Industrial in binding pact to acquire petrochemical – SIIG enters binding agreement to acquire all shares in National Petrochemical that are not owned by SIIG in exchange for issuance of new shares in SIIG to Petrochem’s shareholders. (Bloomberg) Saudi state miner will spend ‘huge amount’ on battery metals – Saudi Arabia’s state miner said it would start to invest heavily in battery metals, as prices soar with the uptake of electric vehicles and the growth of wind and solar power. “In the next 10 to 20 years we are going to spend huge amount of money looking for those metals in Saudi Arabia,” Abdulaziz Al Harbi, chief executive officer of Maaden, said to Bloomberg Television in Riyadh, when asked about nickel and lithium. (Bloomberg) Euroclear to give foreign investors access to Saudi riyal debt – Brussels-based securities settlement platform Euroclear said on Wednesday it had signed an agreement with Saudi Arabia’s Securities Depository Center Company (Edaa) to launch a “Euroclearable” link that will give international investors access to local currency-denominated sukuk and bond markets. The agreement was signed at Saudi Arabia’s flagship investment conference FII and the link is expected to launch in March next year. The link will give foreign investors “legal certainty” when investing in Saudi riyal-denominated debt, Euroclear CEO Lieve Mostrey told Reuters on the sidelines of FII. (Reuters) ACWA reports financial close of $7.2bn in debt for Jazan plant – Acwa Power says financial close for $7.2bn senior debt facilities for Jazan Integrated Gasification Combined Cycle project completed. Non-recourse project financing is from a consortium of lenders involving ADCB, Alinma Bank, Al Rajhi Bank, APICORP, Bank Aljazira, Bank Albilad, Bank of China, Banque Saudi Fransi, DZ Bank, First Abu Dhabi Bank, Intesa, JPMorgan, Korea Development Bank, Mizuho Bank, MUFG, Natixis, Riyad Bank, SABB, Samsung Life, Samsung Securities, Saudi National Bank, Saudi Industrial Development Fund, SMBC and Standard Chartered Bank. The project is a JV between Aramco, ACWA Power, Air Products and Air Products Qudra. It involves the acquisition of the $12bn IGCC plant from Aramco. (Bloomberg) GIP says will not bid for Saudi Aramco's gas pipelines – Private equity firm Global Infrastructure Partners (GIP) will not bid for Saudi Aramco's gas pipeline assets but is looking at other assets in the region, GIP founding partner Matthew Harris said on Wednesday. There are other candidates for such opportunities in the region, including Qatar, Kuwait and Oman, Harris told Reuters on the sidelines of the Future Investment Initiative conference in Riyadh. Investment opportunities exist in oil infrastructure, gas and LNG assets, he said. Saudi Aramco is looking to raise at least $17bn from the sale of a significant minority stake in its gas pipelines. (Reuters) Saudi's Red Sea developer says signs contracts with 9 hotel brands – St Regis and Fairmont are among nine international hotel brands that will manage hotels in Saudi Arabia's Red Sea area, The Red Sea Development Co said on Wednesday. Management contracts were signed with Marriott International, Accor, Hyatt Hotels, IHG Hotels & Resorts and Dubai-owned Jumeirah Hotels & Resorts, it said in a statement. (Zawya) UAE's agtech startup Pure Harvest raises $64.5mn – UAE- based agriculture technology start-up Pure Harvest Smart Farms has secured another $64.5mn in additional funding, bringing its total invested capital to nearly $300mn. Pure Harvest, which produces fruits and vegetables in greenhouses in the UAE, intends to use the proceeds to expand in the Middle East, North Africa and South Asia (MENASA) region. (Zawya) GlobalFoundries, Mubadala raise $2.6bn in US IPO – GlobalFoundries Inc. and major shareholder Mubadala Investment Co. raised almost $2.6bn in an initial public offering, pricing the chipmaker’s shares at the top of a marketed range. The company and Mubadala sold 55mn shares Wednesday for $47 each after marketing them for $42 to $47, according to a statement confirming an earlier report by Bloomberg News. At $47 a share, GlobalFoundries has a market value of more than $25bn based on the outstanding shares listed in its filings with the US Securities and Exchange Commission. (Bloomberg) DIB posts 19.9% YoY rise in net profit to AED1,205.2mn in 3Q2021 – Dubai Islamic Bank (DIB) recorded net profit of AED1,205.2mn in 3Q2021, an increase of 19.9% YoY. Net income rose 14% YoY to AED2,520.9mn in 3Q2021. Total assets stood at AED289.4bn at the end of September 30, 2021 as compared to AED289.6bn at the end of September 30, 2020. Islamic financing and investing assets (net) stood at AED192.8bn (-2.0% YTD), while customers’ deposits stood at AED214.1bn (+4% YTD) at the end of September 30, 2021. EPS came in at AED0.15 in 3Q2021 as compared to AED0.11 in 3Q2020. (DFM) CBD posts 31.4% YoY rise in net profit to AED375mn in 3Q2021 – Commercial Bank of Dubai (CBD) recorded net profit of AED375mn in 3Q2021, an increase of 31.4% YoY. Net interest income and net income from Islamic financing rose 25.8% YoY to AED557.8mn in 3Q2021. Total operating income rose 17.5% YoY to AED815.9mn in 3Q2021. Total assets stood at AED107.8bn at the end of September 30, 2021 as compared to AED97.4bn at the end of September 30, 2020. Loans and advances and Islamic financing (net) stood at AED74.9bn (+14.7% YTD), while customers’ deposits and Islamic customer deposits stood at AED75.8bn (+8.7% YTD) at the end of September 30, 2021. Basic and diluted earnings per share came in at AED0.13 in 3Q2021 as compared to AED0.10 in 3Q2020. (DFM) Abu Dhabi affirmed at AA by Fitch; outlook remains stable – Abu Dhabi’s long-term issuer default rating was affirmed by Fitch at AA. Rating reflects Abu Dhabi’s “strong fiscal and external metrics and high GDP per capita,” Fitch says, adding: “Balanced by high dependence on hydrocarbons, a relatively weak, but improving, economic policy framework and low governance indicators compared with peers”. (Bloomberg) Bahrain wants tourism to account for 11.4% of GDP by 2026, minister says – Bahrain's government wants the tourism industry to contribute 11.4% of gross domestic product by the end of 2026, the Gulf state's tourism minister said in Riyadh on Wednesday. Tourism in the small Gulf state accounted for 6.8% of GDP in 2019, the government's media office said this week. Bahrain would target growth in the meetings, incentives, conference and exhibitions tourism segment, Minister Zayed bin Rashid Al Zayani said at an investment conference. (Zawya) Ahli United Bank 3Q profit $152.1mn vs. $115.9mn YoY – Ahli United Bank reported profit for the third quarter of $152.1mn vs. $115.9mn YoY. Profit at $152.1mn, +31% YoY. Net operating income at $256.9mn, +21% YoY. Net interest income at $222.5mn, +15% YoY and Impairments at $17.1mn, -51% YoY. (Bloomberg)
- 8. Contacts QNB Financial Services Co. W.L.L. Contact Center: (+974) 4476 6666 info@qnbfs.com.qa Doha, Qatar Saugata Sarkar, CFA, CAIA Shahan Keushgerian Head of Research Senior Research Analyst saugata.sarkar@qnbfs.com.qa shahan.keushgerian@qnbfs.com.qa Disclaimer and Copyright Notice: This publication has been prepared by QNB Financial Services Co. W.L.L. (“QNBFS”) a wholly-owned subsidiary of Qatar National Bank (Q.P.S.C.). QNBFS is regulated by the Qatar Financial Markets Authority and the Qatar Exchange. Qatar National Bank (Q.P.S.C.) is regulated by the Qatar Central Bank. This publication expresses the views and opinions of QNBFS at a given time only. It is not an offer, promotion or recommendation to buy or sell securities or other investments, nor is it intended to constitute legal, tax, accounting, or financial advice. QNBFS accepts no liability whatsoever for any direct or indirect losses arising from use of this report. Any investment decision should depend on the individual circumstances of the investor and be based on specifically engaged investment advice. We therefore strongly advise potential investors to seek independent professional advice before making any investment decision. Although the information in this report has been obtained from sources that QNBFS believes to be reliable, we have not independently verified such information and it may not be accurate or complete. QNBFS does not make any representations or warranties as to the accuracy and completeness of the information it may contain, and declines any liability in that respect. For reports dealing with Technical Analysis, expressed opinions and/or recommendations may be different or contrary to the opinions/recommendations of QNBFS Fundamental Research as a result of depending solely on the historical technical data (price and volume). QNBFS reserves the right to amend the views and opinions expressed in this publication at any time. It may also express viewpoints or make investment decisions that differ significantly from, or even contradict, the views and opinions included in this report. This report may not be reproduced in whole or in part without permission from QNBFS. COPYRIGHT: No part of this document may be reproduced without the explicit written permission of QNBFS. Page 8 of 8 Rebased Performance Daily Index Performance Source: Bloomberg Source: Bloomberg Source: Bloomberg Source: Bloomberg (*$ adjusted returns) 60.0 80.0 100.0 120.0 140.0 160.0 Sep-17 Sep-18 Sep-19 Sep-20 Sep-21 QSE Index S&P Pan Arab S&P GCC (0.3%) (0.3%) 0.5% 0.1% 1.0% (0.6%) (0.1%) (1.0%) (0.5%) 0.0% 0.5% 1.0% 1.5% Saudi Arabia Qatar Kuwait Bahrain Oman Abu Dhabi Dubai Asset/Currency Performance Close ($) 1D% WTD% YTD% Global Indices Performance Close 1D%* WTD%* YTD%* Gold/Ounce 1,796.81 0.2 0.2 (5.3) MSCI World Index 3,152.05 (0.5) 0.0 17.2 Silver/Ounce 24.06 (0.4) (1.1) (8.9) DJ Industrial 35,490.69 (0.7) (0.5) 16.0 Crude Oil (Brent)/Barrel (FM Future) 84.58 (2.1) (1.1) 63.3 S&P 500 4,551.68 (0.5) 0.1 21.2 Crude Oil (WTI)/Barrel (FM Future) 82.66 (2.4) (1.3) 70.4 NASDAQ 100 15,235.84 0.0 1.0 18.2 Natural Gas (Henry Hub)/MMBtu 5.86 4.8 15.4 145.2 STOXX 600 474.04 (0.2) 0.3 12.8 LPG Propane (Arab Gulf)/Ton 136.25 (2.5) (3.2) 81.1 DAX 15,705.81 (0.1) 0.8 8.1 LPG Butane (Arab Gulf)/Ton 166.38 0.4 1.9 139.4 FTSE 100 7,253.27 (0.4) 0.6 13.1 Euro 1.16 0.1 (0.3) (5.0) CAC 40 6,753.52 (0.0) 0.1 15.5 Yen 113.83 (0.3) 0.3 10.2 Nikkei 29,098.24 0.4 0.8 (3.7) GBP 1.37 (0.2) (0.1) 0.5 MSCI EM 1,282.89 (1.0) (0.8) (0.6) CHF 1.09 0.2 (0.2) (3.6) SHANGHAI SE Composite 3,562.31 (1.1) (0.7) 4.7 AUD 0.75 0.2 0.7 (2.3) HANG SENG 25,628.74 (1.6) (2.0) (6.2) USD Index 93.80 (0.2) 0.2 4.3 BSE SENSEX 61,143.33 (0.3) 0.6 24.8 RUB 70.63 1.5 0.4 (5.1) Bovespa 106,363.10 0.2 2.4 (17.2) BRL 0.18 0.4 2.0 (6.2) RTS 1,891.28 (1.3) 0.7 36.3 155.1 145.4 132.6