
Recommended
More Related Content
What's hot
What's hot (18)
Similar to Weekly Market Notes for June 19, 2017
Similar to Weekly Market Notes for June 19, 2017 (20)
Recently uploaded
Recently uploaded (20)
Weekly Market Notes for June 19, 2017
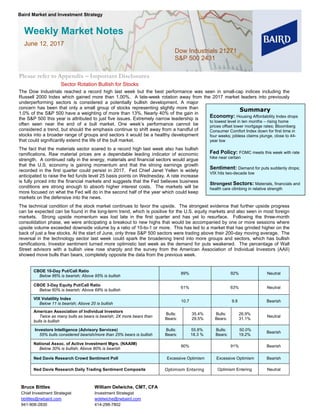
- 1. Bruce Bittles Chief Investment Strategist bbittles@rwbaird.com 941-906-2830 William Delwiche, CMT, CFA Investment Strategist wdelwiche@rwbaird.com 414-298-7802 Please refer to Appendix – Important Disclosures Sector Rotation Bullish for Stocks The Dow Industrials reached a record high last week but the best performance was seen in small-cap indices including the Russell 2000 Index which gained more than 1.00%. A late-week rotation away from the 2017 market leaders into previously underperforming sectors is considered a potentially bullish development. A major concern has been that only a small group of stocks representing slightly more than 1.0% of the S&P 500 have a weighting of more than 13%. Nearly 40% of the gain in the S&P 500 this year is attributed to just five issues. Extremely narrow leadership is often seen near the end of a bull market. One week’s performance cannot be considered a trend, but should the emphasis continue to shift away from a handful of stocks into a broader range of groups and sectors it would be a healthy development that could significantly extend the life of the bull market. The fact that the materials sector soared to a record high last week also has bullish ramifications. Raw material prices are a dependable leading indicator of economic strength. A continued rally in the energy, materials and financial sectors would argue that the U.S. economy is gaining momentum and that the strong earnings growth recorded in the first quarter could persist in 2017. Fed Chief Janet Yellen is widely anticipated to raise the fed funds level 25 basis points on Wednesday. A rate increase is fully priced into the financial markets and suggests that the Fed believes business conditions are strong enough to absorb higher interest costs. The markets will be more focused on what the Fed will do in the second half of the year which could keep markets on the defensive into the news. The technical condition of the stock market continues to favor the upside. The strongest evidence that further upside progress can be expected can be found in the long-term trend, which is positive for the U.S. equity markets and also seen in most foreign markets. Strong upside momentum was lost late in the first quarter and has yet to resurface. Following the three-month consolidation phase, we were anticipating a breakout to new highs that would be accompanied by one or more sessions where upside volume exceeded downside volume by a ratio of 10-to-1 or more. This has led to a market that has grinded higher on the back of just a few stocks. At the start of June, only three S&P 500 sectors were trading above their 200-day moving average. The reversal in the technology sector last week could spark the broadening trend into more groups and sectors, which has bullish ramifications. Investor sentiment turned more optimistic last week as the demand for puts weakened. The percentage of Wall Street advisors with a bullish view rose sharply and the survey from the American Association of Individual Investors (AAII) showed move bulls than bears, completely opposite the data from the previous week. CBOE 10-Day Put/Call Ratio Below 86% is bearish; Above 95% is bullish 89% 92% Neutral CBOE 3-Day Equity Put/Call Ratio Below 60% is bearish; Above 68% is bullish 61% 63% Neutral VIX Volatility Index Below 11 is bearish; Above 20 is bullish 10.7 9.8 Bearish American Association of Individual Investors Twice as many bulls as bears is bearish; 2X more bears than bulls is bullish Bulls: Bears: 35.4% 29.5% Bulls: Bears: 26.9% 31.1% Neutral Investors Intelligence (Advisory Services) 55% bulls considered bearish/more than 25% bears is bullish Bulls: Bears: 55.8% 18.3 % Bulls: Bears: 50.0% 19.2% Bearish National Assoc. of Active Investment Mgrs. (NAAIM) Below 30% is bullish; Above 80% is bearish 90% 91% Bearish Ned Davis Research Crowd Sentiment Poll Excessive Optimism Excessive Optimism Bearish Ned Davis Research Daily Trading Sentiment Composite Optimism Entering Optimism Entering Neutral Weekly Market Notes June 12, 2017 Dow Industrials 21271 S&P 500 2431 Baird Market and Investment Strategy Summary Economy: Housing Affordability Index drops to lowest level in ten months – rising home prices offset lower mortgage rates; Bloomberg Consumer Comfort Index down for first time in four weeks; jobless claims plunge, close to 44- year low Fed Policy: FOMC meets this week with rate hike near certain Sentiment: Demand for puts suddenly drops; VIX hits two-decade low Strongest Sectors: Materials, financials and health care climbing in relative strength
- 2. Weekly Market Notes Robert W. Baird & Co. Page 2 of 4 Source: Ned Davis Research RS Ranking RS Current Previous Trend Leaders: Internet Software & Services; Data Processing & Outsourced Services; Application Software; Systems Software; Home Entertainment Software; Electronic Components; Electronic Manufacturing Services; Semiconductor Equipment; Semiconductors Laggards: Leaders: Airlines Laggards: Construction & Engineering; Trading Companies & Distributors; Research & Consulting Services Leaders: Laggards: Leaders: Auto Parts & Equipment; Casinos & Gaming; Hotels, Resorts & Cruise Lines; Restaurants; Specialized Consumer Services; Internet Retail; Computer & Electronics Retail Laggards: Motorcycle Manufacturers; Department Stores; General Merchandise Stores; Apparel Retail; Automotive Retail; Homefurnishing Retail Leaders: Laggards: Commodity Chemicals Leaders: Laggards: Retail REIT's Leaders: Managed Health Care; Health Care Technology; Life Science Tools & Services Laggards: Health Care Services Leaders: Laggards: Brewers; Agricultural Products Leaders: Laggards: Integrated Telecom Services Leaders: Laggards: Oil & Gas Drilling; Oil & Gas Equipment & Services; Integrated Oil & Gas; Oil & Gas Exploration & Production; Oil & Gas Storage & Transportation ** Denotes Current Relative Strength‐Based Overweight Sectors Energy 10 10 Health Care 7 8 Financials 6 5 Consumer Staples 8 6 Telecom Services 9 9 Consumer Discretionary 4 ** 3 Materials 5 7 Industrials 2 ** 4 Utilities 3 ** 2 Information Technology 1 ** 1 Sub‐Industry Detail
- 3. Weekly Market Notes Robert W. Baird & Co. Page 3 of 4 Appendix – Important Disclosures and Analyst Certification This is not a complete analysis of every material fact regarding any company, industry or security. The opinions expressed here reflect our judgment at this date and are subject to change. The information has been obtained from sources we consider to be reliable, but we cannot guarantee the accuracy. ADDITIONAL INFORMATION ON COMPANIES MENTIONED HEREIN IS AVAILABLE UPON REQUEST The Dow Jones Industrial Average, S&P 500, S&P 400 and Russell 2000 are unmanaged common stock indices used to measure and report performance of various sectors of the stock market; direct investment in indices is not available. Baird is exempt from the requirement to hold an Australian financial services license. Baird is regulated by the United States Securities and Exchange Commission, FINRA, and various other self-regulatory organizations and those laws and regulations may differ from Australian laws. This report has been prepared in accordance with the laws and regulations governing United States broker-dealers and not Australian laws. Copyright 2017 Robert W. Baird & Co. Incorporated Other Disclosures United Kingdom (“UK”) disclosure requirements for the purpose of distributing this research into the UK and other countries for which Robert W. Baird Limited (“RWBL”) holds a MiFID passport. This material is distributed in the UK and the European Economic Area (“EEA”) by RWBL, which has an office at Finsbury Circus House, 15 Finsbury Circus, London EC2M 7EB and is authorized and regulated by the Financial Conduct Authority (“FCA”). For the purposes of the FCA requirements, this investment research report is classified as investment research and is objective. The views contained in this report (i) do not necessarily correspond to, and may differ from, the views of Robert W. Baird Limited or any other entity within the Baird Group, in particular Robert W. Baird & Co. Incorporated, and (ii) may differ from the views of another individual of Robert W. Baird Limited. All substantially material sources of the information contained in this report are disclosed. All sources of information in this report are reliable, but where there is any doubt as to reliability of a particular source, this is clearly indicated. Robert W. Baird Group and or one of its affiliates may at any time have a long or short position in the company/companies mentioned in this report. Where the Group holds a long or short position exceeding 0.5% of the total issued share capital of the issuer, this will be disclosed separately by your RWBL representative upon request. This material is only directed at and is only made available to persons in the EEA who would satisfy the criteria of being "Professional" investors under MiFID and to persons in the UK falling within articles 19, 38, 47, and 49 of the Financial Services and Markets Act of 2000 (Financial Promotion) Order 2005 (all such persons being referred to as “relevant persons”). Accordingly, this document is intended only for persons regarded as investment professionals (or equivalent) and is not to be distributed to or passed onto any other person (such as persons who would be classified as Retail clients under MiFID). Robert W. Baird & Co. Incorporated and RWBL have in place organizational and administrative arrangements for the disclosure and avoidance of conflicts of interest with respect to research recommendations. Robert W. Baird Group and or one of its affiliates may be party to an agreement with the issuer that is the subject of this report relating to the provision of services of investment firms. An outline of the general approach taken by Robert W. Baird Limited in relation to conflicts of interest is available from your RWBL representative upon request. Baird’s policies and procedures are designed to identify and effectively manage conflicts of interest related to the preparation and content of research reports and to promote objective and reliable research that reflects the truly held opinions of research analysts. Analysts certify on a quarterly basis that such research reports accurately reflect their personal views. This material is not intended for persons in jurisdictions where the distribution or publication of this research report is not permitted under the applicable laws or regulations of such jurisdiction.
- 4. Weekly Market Notes Robert W. Baird & Co. Page 4 of 4 Investment involves risk. The price of securities may fluctuate and past performance is not indicative of future results. Any recommendation contained in the research report does not have regard to the specific investment objectives, financial situation and the particular needs of any individuals. You are advised to exercise caution in relation to the research report. If you are in any doubt about any of the contents of this document, you should obtain independent professional advice. RWBL is exempt from the requirement to hold an Australian financial services license. RWBL is regulated by the FCA under UK laws, which may differ from Australian laws. As such, this document has not been prepared in accordance with Australian laws.