SlideShare a Scribd company logo
EQUITY OUTLOOK
Global Markets
Global equities continued to trade higher and
exhibited unusually broad momentum,
delivering 12-month highs on several equities
benchmarks up until the middle of the
month. The last two weeks, however, saw
broad deleveraging across equities and global
asset classes. Equities saw a global sell-off in
risky assets amidst a sharp rise in US bond
yields. Investors weighed a rise in bond yields
on worries about potential inflation with oil
prices at a 12-month high and copper prices
near a decade-high. Global growth outlook
has been revised higher with economic
output expected to grow at 5-6% this year,
making it the fastest pace since the mid-80s.
The ongoing bond bear market is unlikely to derail global equities as yet. By the standards of a post-recession expansion
cycle, neither the direction nor the magnitude of yield increase appears odd. The underlying drivers behind the bond
yields' move matter more than their levels. Study of US bond yield cycles depicts stocks-bonds correlation over shorter
and longer timeframes. In fact, in the last decade, whenever bond yields spiked by 50bps or more in a short period of
time, equities performed well. Generally, equity prices and P/E multiples have been positively linked to bond yields.
FOMC officials - Recovery far from central bank’s goals: Minutes from the Federal Reserve's January policy meeting
indicate that the FOMC officials see the economy “far from” the central bank’s goals. The meeting summary indicates it
will likely “take some time for substantial further progress to be achieved”, highlighting that the policy is unlikely to
change soon. Fed Chair Powell adds that the discussion on tapering is “premature”; indicates that “substantial further
progress” towards the FOMC’s goals of labour market recovery and inflation of at least 2% is required for changing the
asset purchase guidance.
Covid & Vaccines: The progress on vaccination is being watched by markets for demand cues. The US seems to be on
track to achieve near herd immunity by mid-year and could be a turning point for global markets. Israel has vaccinated
82% of its population with 33% of its population receiving both doses. However, we don’t yet see a sharp improvement
in Google mobility for retail and recreation in Israel which is even weaker than India’s.
Outperformance in Covid containment leading to marginal hospitalization rate and death rate has probably lowered risk
perception on the street in India and hence driving retail participation. Daily new Covid-19 confirmed cases averaged
~12.5k in Feb vs. ~15k in Jan and ~25k in Dec. Although daily tests at 709k/day in Feb were lower vs. Jan (774k/day), the
positive rate increased marginally to 2.0% in end-Feb vs. 1.9% in end-Jan.
India has administered only 14mn vaccines until 26 Feb. The current rate is way below the intended pace of vaccination
expected. The second phase starting 01 Mar will cover bulk of the 300mn targeted to be vaccinated by Jul-Aug-21. In a
bid to expand the Covid-19 vaccination drive amid fears of a second wave in some states, the Union Cabinet will allow
anyone above the age of 60 or above 45 and with comorbidities to sign up to receive the Covid vaccines at government
as well as private hospitals from 1 Mar’21.
March 2021
Source: Bloomberg
6 6 6 5 5 5 4 4 4 3 3 3 2 2 2
1 0 0 0
-3
-6
-9
-6
-3
-
3
6
9
South
Africa
Taiwan
Spain
Italy
France
India
Indonesia
Euro
Stoxx
Russia
UK
Japan
US
Developed
Markets
World
Germany
Emerging
Markets
Malaysia
South
Korea
China
Switzerland
Brazil
1M Return (%)
Domestic Markets
After lagging behind significantly in Jan, MSCI India (USD) rose 5.1% in Feb and significantly outperformed peers MSCI
AC Asia Pacific ex Japan (+3.8%) and MSCI EM (+4.4%) on post-budget euphoria. Mid-caps and small-caps outperformed
large caps by ~4%/5%, respectively, in Feb.
Source: Bloomberg
Capital Flows: FPIs recorded net inflows of USD4.1bn into Indian equities in Feb and remained net sellers in the debt
markets with net outflows of USD868mn. DIIs remained net equity sellers at USD2.2bn in Feb, while insurance funds
bought USD206mn of equities in Feb.
FPI net flows (USD bn) DII net flows (USD bn)
Bond Markets and Currency: Benchmark 10-year treasury yields averaged at 6.09% in Feb (19bps higher vs. Jan avg.).
On month end values, the 10Y yield was up 33bps to end the month at 6.23%. US 10Y yield is at 1.40% (+34bps MoM,
+26bps YoY).
INR lost 0.7% and ended the month at 73.47 per USD in Feb. In the last 12 months, INR (-1.8%) has outperformed the
broader EM FX (-2.6%). DXY gained +0.3% in Feb (vs. +0.7% in Jan) and ended the month at 90.88 (-7.4% in the last 12
months).
India’s FX reserves are close to their all-time peak at USD584bn as of 19 Feb. FX reserves have decreased by USD1.5bn
in the last 4 weeks.
While, fiscal deficit for Apr-Jan was Rs12.3tn or 67% of the budgeted FY21 deficit (Rs.18.5tn). This compares to 106%
reached during the same time frame in FY20.
7 12
28 30
12 16 11
-37
91
4
11 18
39 39
6 15 12
-36
112
12
12
22
44 42
-1
13 9
-42
139
14
-100
-50
-
50
100
150
1M Ret 3M Ret 6M Ret 1Y Ret 3Y Ret 5Y Ret 10Y Ret Till Mar-
20 bottom
Since
Mar-20
bottom
YTD
Return
Nifty 50, Mid Cap and Small Cap Returns (%)
Nifty 50 NIFTY Midcap 100 NIFTY Smallcap 100
Source: Bloomberg
RBI policy: The RBI kept policy rates on hold, reiterated its accommodative stance, indicated a phased withdrawal of
last year’s reserve requirement cut, but simultaneously pledged to keep liquidity conditions accommodative to ensure
the government’s larger-than-expected borrowing program goes through non-disruptively – all of which was expected.
Q3 FY21 Earnings Season
Corporate India’s Q3FY21 performance is noteworthy with more surprises than disappointments. Earnings continue to
beat estimates with almost 3 upgrades for every 1 downgrade in BSE200, highest in several quarters.
Source: Bloomberg
The earnings momentum accelerated further in 3QFY21, aided by pickup in sales growth. Aggregate sales growth of
domestically-oriented companies has turned positive after five consecutive quarters of contraction, and points to a
recovering domestic demand. BSE 200 saw second quarter of upward revision, whereas the mid-cap index has seen 3
consecutive quarters of upward revision in EPS estimates.
Adjusted PAT for the BSE All Cap (~840 stocks)
grew a handsome 33% YoY in 3QFY21 which
is the highest in nearly 4 years, after similar
strength in 2Q. Close to 70% of this was on
account of Materials/Energy – benefitting
from ongoing commodity inflation (including
oil inventory gains). Ex-Metals, growth stands
at 24% YoY.
Metals, Oil, Auto, IT and Pharma sectors are
key contributors to the earnings growth,
while BFSI, Engineering and Media
disappointed. Consensus estimates continue
to be upgraded and are now implying
aggregate PAT growth of ~30-35% YoY in
FY22.
Source: Bloomberg
29%
19%
12%
9%
7% 6% 5% 5% 4% 4% 4% 2% 2% 0% 0%
-4%
-10%
0%
10%
20%
30%
40%
CorpBk
Cmdty
Auto
Cement
BSE200
Energy
NBFCCyc
Stap
IT
RetBk
NBFCStab
Disc
Industrial
Utilities
Pharma
Telecom
Avg EPS Change: current quarter
6.1%
3.0%
-15%
-10%
-5%
0%
5%
10%
Dec-05
Sep-06
Jun-07
Mar-08
Dec-08
Sep-09
Jun-10
Mar-11
Dec-11
Sep-12
Jun-13
Mar-14
Dec-14
Sep-15
Jun-16
Mar-17
Dec-17
Sep-18
Jun-19
Mar-20
Dec-20
BSE200 EPS Revision 2 Yr Fwd
5.4%
7.6%
8.5%
-30%
-20%
-10%
0%
10%
20%
Sep-11
Mar-12
Sep-12
Mar-13
Sep-13
Mar-14
Sep-14
Mar-15
Sep-15
Mar-16
Sep-16
Mar-17
Sep-17
Mar-18
Sep-18
Mar-19
Sep-19
Mar-20
Sep-20
Feb-21
NSE MidCap EPS Revision 2Yr Fwd
Sectoral Impact
Metals, PSU Banks and Industrials outperformed while Healthcare, Staples and IT were notable laggards in Feb.
Sectoral Performance as on February 26, 2021
1M
Ret
3M
Ret
6M
Ret
1Yr
Ret
3Yr
Ret
5Yr
Ret
Till Mar-
20
bottom
Since
Mar-20
Since
Jan-18
Since
Sep-13
USD INR -0.7% 0.8% 0.2% -1.8% -4.3% -1.4% -6.9% 3.7% -15.4% -2.2%
Market Cap Wise
Nifty 50 6.6% 12.0% 27.6% 29.7% 11.5% 15.8% -37.5% 90.9% 39.2% 13.4%
NIFTY Midcap 100 11.3% 18.0% 39.5% 38.6% 5.8% 15.1% -35.7% 111.7% 10.2% 17.6%
NIFTY Smallcap 100 12.2% 22.5% 44.0% 41.8% -1.2% 13.1% -42.2% 138.7% -12.3% 15.7%
Sector Wise
S&P BSE Pvt Banks 11.8% 12.8% 42.5% 19.6% 10.8% 20.0% -48.5% 108.1% 35.7% 20.5%
S&P BSE PSU 22.5% 32.5% 36.3% 19.3% -5.6% 4.9% -41.0% 71.0% -23.4% 3.5%
S&P BSE FMCG -2.1% 2.1% 5.4% 9.1% 4.5% 11.0% -24.0% 38.0% 12.2% 8.2%
S&P BSE Auto 3.7% 14.0% 29.7% 47.3% -2.6% 7.7% -43.0% 117.6% -13.6% 10.4%
S&P BSE Cons
Durables
5.5% 17.4% 39.5% 21.4% 14.5% 23.6% -29.5% 80.1% 39.7% 25.9%
S&P BSE Healthcare 1.1% 2.6% 13.4% 54.7% 14.0% 6.5% -18.0% 89.5% 40.8% 11.6%
S&P BSE Info Tech -1.6% 12.9% 35.3% 63.0% 25.1% 19.1% -27.6% 118.0% 117.8% 16.7%
S&P BSE Telecom 3.7% 20.6% 13.9% 18.2% -0.9% 3.2% -19.8% 56.1% -16.1% 1.6%
S&P BSE Utilities 17.5% 21.7% 30.0% 25.3% -0.7% 8.7% -32.0% 67.9% -10.6% 6.5%
S&P BSE Capital
Goods
10.5% 26.4% 56.6% 39.8% 4.1% 13.9% -41.1% 115.5% 12.0% 14.9%
S&P BSE India Infra 20.7% 35.4% 50.4% 44.5% -2.5% 10.9% -39.9% 109.4% -12.1%
S&P BSE India
Manufacturing
4.4% 11.5% 18.2% 29.6% 5.9% 11.6% -34.5% 78.1% 15.3% 10.9%
S&P BSE Oil & Gas 12.5% 17.3% 18.8% 23.2% 0.1% 13.6% -39.3% 73.8% -4.1% 9.0%
S&P BSE Metal 24.4% 34.3% 55.3% 66.5% -3.3% 15.2% -48.2% 154.1% -7.7% 6.9%
Source: Bloomberg
The Macro Picture
PMI: Composite PMI increased by 0.9pt MoM to 55.8 in Jan after a 1.4pt MoM decline in Dec. Helped by stronger
demand conditions, Services PMI rose to 52.8 in Jan from 52.3 in Dec, while Manufacturing PMI inched up to 57.7 in Jan
from 56.4 in Dec. The forward-looking demand indicators remained constructive with composite new orders remaining
strong at 55.9, increasing 1.0pt MoM.
Inflation: Jan CPI inflation came in at 4.1%, softening further from 4.6% in Dec. Food prices led the downside surprise,
dropping 1% MoM on the back of last month’s 1.5% fall. Vegetable prices continued to mean-revert, plunging 11.5%
MoM in Jan after a 9% fall in Dec. Most other food prices, including pulses, came in soft as expected, except oilseeds,
which reflected rising global prices. As a result, food inflation softened to 2.7% YoY in Jan from 3.9% in Dec. Core prices
(core inflation ex. gasoline and diesel) increased 0.5% MoM in Jan after a 0.3% rise in Dec, likely reflecting a combination
of pent-up demand and input cost pressures.
Import Export: India's exports up 6.16% in Jan; trade deficit narrows USD14.54bn, following healthy growth in pharma
and engineering sectors. Similarly, imports dropped by about 26% to USD300.26bn during April-Jan this fiscal.
GDP at 96% of its 1QFY20 pre-pandemic levels: India's GDP grew 0.4% in Q3 of FY21, underpinned by weak service
sector growth. Few key highlights were (i) trade, hotels, transport, and communication services continued to contract,
much more than some of the formal sector indicators had suggested, indicating continued weakness in the informal
sector; and (ii) government consumption continued to contract, despite a material pickup in central government
spending, suggesting contractions in state government spending offset the central government impulse. Sequential
growth was strong at 25% QoQ, taking GDP to 96% of its 1QFY20 pre-pandemic level.
Economic growth revised upwards: Global forecasting firm Oxford Economics revised India's economic growth
projection for 2021 to 10.2% from the earlier 8.8%, citing receding Covid-19 risks and the shift in the monetary policy
outlook.
GST collections: GST collections in Feb’21 stood at INR 1.13trn (7.4% YoY), crossing the Rs1trn mark for the 5th
consecutive month. The govt. has credited this to economic recovery and the various measures taken by tax
administration to improve compliance.
• The upcoming GST Council meeting in Mar’21 will likely take up rationalizing tax rates and mergers of multiple slabs,
to bring them close to being revenue-neutral and make the indirect tax regime simpler (The 15th Finance Commission
has recommended merging the 12% and 18% tax rates).
• As part of efforts to bring parity in taxation on Agri-inputs, the Department of Chemical and Petrochemicals has
approached the Finance Ministry for reducing GST on pesticides from 18% to 5%.
• Prime Minister Narendra Modi expressed government’s commitment to bring natural gas under the GST regime to
make prices cheaper and uniform across the country. He also informed that the govt. was spending Rs7.5trn over 5
years to build oil and gas infrastructure.
• Renewed interest in bringing petroleum products under the ambit of GST, something that has invited resistance from
states in the past since VAT from these forms ~25-30% of states’ own tax revenue.
IPO, M&A and PE investments: M&A deal activity in 2020 jumps 33% to USD36.9bn. While, PE/VC investments in Jan’21
reported a 35% drop YoY to USD1.6bn from USD2.5bn. The number of deals reported also remained flat at 80, according
to EY-IVCA data. SEBI eased the listing norms for large companies, apparently paving the way for the much-awaited
mega float of Life Insurance Corporation (LIC). The regulator said large companies can now divest a minimum 5% in the
IPO, instead of 10%. Further, they will get five
years, instead of three, to raise the public float
to 25%.
Commodities: The run-up in international
commodity prices is on expectations of
stimulus-led demand coming ahead of supply
normalization. Brent gained a whopping
17.5% MoM in Feb to end the month at
USD64.4/bbl. It made the 1-year peak at
USD67/bbl, as the market looks ahead toward
an accelerated decline in record inventories.
On the supply side, OPEC+ discipline and Saudi
Arabia’s decision to reduce output by 1mbd
through March were further amplified over
18 18
16
9 8 7
-1
-6
-10
-5
-
5
10
15
20
Brent
WTI
Copper
Aluminium
Zinc
Steel
Silver
Gold
Commodities
1M Return (%)
Source: Bloomberg
the last week when US crude production fell 3.2mbd amid an unprecedented polar blast. From the demand perspective,
the winter of 2021 stands out as one of the coldest in decades, upending energy markets and sending prices for
electricity, fuel and vessels to record highs.
Thrust on Atma-Nirbhar Bharat through production-linked incentive (PLI) schemes
PLI scheme for Telecom: The government approved a Rs121.95bn PLI scheme for Telecom gear manufacturing in India,
a move that will position the nation as a global powerhouse for production of such equipment ahead of 5G roll-outs.
There will be a minimum investment threshold of Rs100mn for MSMEs with incentives from 7% to 4% over five years
and Rs1bn for others with incentives from 6% to 4% over five years above base year (FY2020). The government expects
around Rs2.4tn of incremental production (with Rs2tn in exports) and investment of more than Rs30 bn.
PLI scheme for IT hardware: The Union Cabinet approved the PLI scheme for IT hardware (laptops, tablets, all-in-one
PCs and servers) with an outlay of Rs73.5bn. The aim is to enhance the development of the electronics ecosystem in
India. The scheme is likely to benefit five major global players and 10 domestic champions. The scheme shall extend an
incentive of 4% to 2% / 1% on net incremental sales (over FY2020) of goods manufactured in India and covered under
the target segment, to eligible companies, for a period of four years. The government expects domestic value addition
to increase to 20-25% by FY20225 and employment generation potential of over 180,000.
PLI scheme for Pharmaceuticals: The Union Cabinet approved the PLI scheme for pharmaceuticals with an outlay of
Rs150bn. The aim is to increase production and export of (1) biopharmaceuticals; complex generic drugs; patented
drugs or drugs nearing patent expiry; cell based or gene therapy drugs; orphan drugs; special empty capsules; complex
excipients; phytopharmaceuticals, (2) KSMs/DIs/APIs, and (3) repurposed drugs; auto immune drugs, anti-cancer drugs,
anti-diabetic drugs, anti-infective drugs, cardiovascular drugs, psychotropic drugs and anti-retroviral drugs; in vitro
diagnostic devices; other drugs as approved; other drugs not manufactured in India. The scheme will be available for
three categories of companies having global revenue (1) greater than Rs50 bn (incentive of Rs110 bn), (2) between Rs5
bn and Rs50 bn (incentive of Rs22.5 bn), and (3) less than Rs5 bn (incentive of Rs17.5 bn). Between FY2023 and FY2028,
the government expects total incremental sales of Rs2.94tn and total incremental exports of Rs1.96tn along with 20,000
direct jobs and 80,000 indirect jobs.
Other Government policy updates
• Monetization policy: PM Modi has said that about 100 under-utilized or unutilized assets with PSUs will be monetized
to create Rs2.5trn of investment opportunities. India's government has shortlisted four mid-sized state-run banks for
privatization (Bank of Maharashtra, Bank of India, Indian Overseas Bank and the Central Bank of India), under a new
push to sell state assets and shore up government revenues. Two of these banks will be selected for sale in FY22.
• RBI has set up an expert committee on urban co-operative banks (UCBs) to provide a road map for strengthening the
sector and also evaluate the prospects for consolidating the sector.
• Finance Ministry directed departments and ministries to surrender savings anticipated in the Grants for FY21 by 20
Mar’21.
• Ministry of Agriculture has informed that India's food grain production is estimated to rise by 2% in 2020-21 crop year
to an all-time high of 303.3MT due to better output of rice, wheat, pulses and coarse cereals.
Other Key snippets:
• State Budgets: Some state governments have given preference to the agriculture sector in their Budgets for FY22 amid
the ongoing farmers' protest against the Centre's three farm laws- i) Rajasthan: has announced a separate budget on
agriculture from next year onwards, along with provision of interest-free crop loans worth Rs160bn to the farmers, ii)
UP: has proposed Rs1bn for the Aatmanirbhar Krishak Samanvit Vikas Yojana and Rs6bn for the Mukhyamantri Krishak
Durghatna Kalyan Yojana, iii) Bihar: has earmarked Rs5.5bn for the Har Khet Ko Pani scheme.
• The Election Commission has announced the schedule for upcoming Assembly elections- West Bengal will go to polls
in eight phases, Assam will see three-phase voting starting 27 Mar’21. Assembly elections in Tamil Nadu, Kerala and
Puducherry will be held in a single phase on 6 Apr’21. (Source: Indian Express)
• Increase in the fuel prices throughout the country with petrol prices crossing the Rs100 mark in MP and Rajasthan.
Key Sectoral Trends:
• Banking & Finance: Key trends observed in the credit card data put out by the RBI for Dec-20 are: i) net card additions
were much lower, ii) monthly spends/card increased 2% MoM in Dec-20, after the decline in Nov-20, and iii) total
industry spends were 4% lower YoY in Dec-20.
• Capital Goods: Capital Goods companies sailed through last-mile hiccups in productivity and supply chain in 3Q, and
are targeting strong growth in execution for 4QFY21, led by normalcy in operations and acceleration in government &
private spending. Valuation re-rating continues, in line with growing optimism across quality plays.
• Telecom: We look at a few interesting data points from the recently-released Nokia MBiT Index Report - 2021. At
311PB/day in Dec-20, 4G constituted 99% of data traffic across network. Per-capita usage is up, while subscriber adds
have slowed down. Strong rural and class C circle data traffic growth (traditional stronghold of Jio) and Jio’s slowdown
in data traffic growth suggests that Bharti is probably making inroads here.
• Infrastructure: Road contractors reported healthy improvement in revenues and profitability during 3QFY21, as
project execution normalized to pre-Covid19 days. The outlook remains strong, with all companies boasting of good
order books and strong award pipelines.
• Pharma: The sector results were a mixed bag, with one half of the sector beating consensus EBITDA estimates while
other half missing expectations. Although growth recovered for most of the companies in the India formulations market,
the US business listed weakness across the board, owing to lower sales of seasonal products and base-price erosion.
• Agriculture and Chemicals: In the chemical markets, the global recovery continues, with world chemical production
up 1.8% MoM in Dec-2020. India’s chemical exports grew 2.6% YoY in Jan’21, while imports grew 16.0% YoY. Global
crop futures were largely stable last month. In India, corn and soybean prices rose 3-7% MoM.
• FMCG: The FMCG industry in India has recorded a value growth of 7.3% in Oct-Dec’20 quarter helped by consumption-
led recovery during the festive period and increase in sales from traditional as well as organized trade, according to data
analytics firm Nielsen.
• Advertising spends across media platforms in India will grow by 23.5% in 2021 to Rs801.23bn in 2021 after a sharp
21.5% decline in the pandemic-hit 2020.
• The Indian IT industry revenues are set to grow by 2.3% to USD194bn in FY2020-21 and the exports will go up by 1.9%
to USD150bn.
• Non-life insurance companies registered a 6.7% increase in their gross direct premium collection in Jan at Rs184.88bn
Outlook
From Indian equities point of view, the solid Dec quarter earnings was clearly a key highlight. Few, if any, would have
been able to forecast, at the start of the current fiscal in April’20, that Dec ’20 quarter would deliver the highest ever
quarterly profits for the BSE200 set of companies! Globally, however, the worries on inflation and the unsettling moves
on the US 10-year yield gave a glimpse, a “trailer” of reality – valuations could compress; economic growth could get
stunted, if bonds yields sustained and moved ahead.
For the current economic recovery to sustain, containing bond yields, not through “yield curve management” but
through moderating inflation expectation will be a key variable to track for the rest of the year. On this front, last week’s
correction of crude oil and copper may be a sign in the right direction. If the recent surge in commodity prices can be
“managed” then future inflation expectations will get moderated helping bond yields to calm down. Equity investors
may be well advised to add declining bond yields, in their daily prayers!
Disclaimer: MUTUAL FUND INVESTMENTS ARE SUBJECT TO MARKET RISKS, READ ALL SCHEME RELATED DOCUMENTS
CAREFULLY.
The Disclosures of opinions/in house views/strategy incorporated herein is provided solely to enhance the transparency about the
investment strategy / theme of the Scheme and should not be treated as endorsement of the views / opinions or as an investment
advice. This document should not be construed as a research report or a recommendation to buy or sell any security. This document
has been prepared on the basis of information, which is already available in publicly accessible media or developed through analysis
of IDFC Mutual Fund. The information/ views / opinions provided is for informative purpose only and may have ceased to be current
by the time it may reach the recipient, which should be taken into account before interpreting this document. The recipient should
note and understand that the information provided above may not contain all the material aspects relevant for making an investment
decision and the security may or may not continue to form part of the scheme’s portfolio in future. Investors are advised to consult
their own investment advisor before making any investment decision in light of their risk appetite, investment goals and horizon. The
decision of the Investment Manager may not always be profitable; as such decisions are based on the prevailing market conditions
and the understanding of the Investment Manager. Actual market movements may vary from the anticipated trends. This information
is subject to change without any prior notice. The Company reserves the right to make modifications and alterations to this statement
as may be required from time to time. Neither IDFC Mutual Fund / IDFC AMC Trustee Co. Ltd./ IDFC Asset Management Co. Ltd nor
IDFC, its Directors or representatives shall be liable for any damages whether direct or indirect, incidental, punitive special or
consequential including lost revenue or lost profits that may arise from or in connection with the use of the information.

More Related Content

What's hot

Retail Food Group - Analysis Report - Group 5
Retail Food Group - Analysis Report - Group 5Retail Food Group - Analysis Report - Group 5
Retail Food Group - Analysis Report - Group 5
Giang Nguyen
 
The US Market Overview - 2Q14 (FINAL)
The US Market Overview - 2Q14 (FINAL)The US Market Overview - 2Q14 (FINAL)
The US Market Overview - 2Q14 (FINAL)
Greg Meier
 
Oecd interim economic ocde outlook march 2017 embargo (3)
Oecd interim economic ocde outlook march 2017   embargo (3)Oecd interim economic ocde outlook march 2017   embargo (3)
Oecd interim economic ocde outlook march 2017 embargo (3)
Daniel BASTIEN
 
Global Economy (2)
Global Economy (2)Global Economy (2)
Global Economy (2)
iimsritesh
 

What's hot (18)

BSL Fact Sheet June 2017
BSL Fact Sheet June 2017BSL Fact Sheet June 2017
BSL Fact Sheet June 2017
 
#116P
#116P#116P
#116P
 
Retail Food Group - Analysis Report - Group 5
Retail Food Group - Analysis Report - Group 5Retail Food Group - Analysis Report - Group 5
Retail Food Group - Analysis Report - Group 5
 
The US Market Overview - 2Q14 (FINAL)
The US Market Overview - 2Q14 (FINAL)The US Market Overview - 2Q14 (FINAL)
The US Market Overview - 2Q14 (FINAL)
 
Asia Economics Outlook 2018
Asia Economics Outlook 2018Asia Economics Outlook 2018
Asia Economics Outlook 2018
 
Asean-5’s Challenges May Persist Into 2018
Asean-5’s Challenges May Persist Into 2018Asean-5’s Challenges May Persist Into 2018
Asean-5’s Challenges May Persist Into 2018
 
Oecd interim economic ocde outlook march 2017 embargo (3)
Oecd interim economic ocde outlook march 2017   embargo (3)Oecd interim economic ocde outlook march 2017   embargo (3)
Oecd interim economic ocde outlook march 2017 embargo (3)
 
Retail Food Group Valuation
Retail Food Group ValuationRetail Food Group Valuation
Retail Food Group Valuation
 
Monthly Market Outlook | October 2021
Monthly Market Outlook | October 2021Monthly Market Outlook | October 2021
Monthly Market Outlook | October 2021
 
Note pad
Note padNote pad
Note pad
 
Annual Outlook 2022 | ICICI Prudential Mutual Fund
Annual Outlook 2022 | ICICI Prudential Mutual FundAnnual Outlook 2022 | ICICI Prudential Mutual Fund
Annual Outlook 2022 | ICICI Prudential Mutual Fund
 
Annual Equity Outlook 2022 | ICICI Prudential Mutual Fund
Annual Equity Outlook 2022 | ICICI Prudential Mutual FundAnnual Equity Outlook 2022 | ICICI Prudential Mutual Fund
Annual Equity Outlook 2022 | ICICI Prudential Mutual Fund
 
Global Economy (2)
Global Economy (2)Global Economy (2)
Global Economy (2)
 
Annual Fixed Income Outlook 2022 | ICICI Prudential Mutual Fund
Annual Fixed Income Outlook 2022 | ICICI Prudential Mutual FundAnnual Fixed Income Outlook 2022 | ICICI Prudential Mutual Fund
Annual Fixed Income Outlook 2022 | ICICI Prudential Mutual Fund
 
MEDA 2016 Annual Confernece: The Economist Who Loved Me
MEDA 2016 Annual Confernece: The Economist Who Loved MeMEDA 2016 Annual Confernece: The Economist Who Loved Me
MEDA 2016 Annual Confernece: The Economist Who Loved Me
 
The World This Week - 4th to 8th July, 2016
The World This Week - 4th to 8th July, 2016The World This Week - 4th to 8th July, 2016
The World This Week - 4th to 8th July, 2016
 
Weekly Market Notes for July 31, 2017
Weekly Market Notes for July 31, 2017Weekly Market Notes for July 31, 2017
Weekly Market Notes for July 31, 2017
 
Weekly Market Review - January 24, 2014
Weekly Market Review - January 24, 2014Weekly Market Review - January 24, 2014
Weekly Market Review - January 24, 2014
 

Similar to Market outlook equity march 2021

Advice for the Wise October 2015
Advice for the Wise October 2015Advice for the Wise October 2015
Advice for the Wise October 2015
Karvy Private Wealth
 

Similar to Market outlook equity march 2021 (20)

Weekly Market Review - October 18, 2013
Weekly Market Review - October 18, 2013Weekly Market Review - October 18, 2013
Weekly Market Review - October 18, 2013
 
August2021
August2021August2021
August2021
 
Advice For The Wise - February, 2016
Advice For The Wise - February, 2016Advice For The Wise - February, 2016
Advice For The Wise - February, 2016
 
Weekly Market Review - September 13, 2013
Weekly Market Review - September 13, 2013Weekly Market Review - September 13, 2013
Weekly Market Review - September 13, 2013
 
Weekly market review - May 31, 2013
Weekly market review - May 31, 2013Weekly market review - May 31, 2013
Weekly market review - May 31, 2013
 
Weekly Market Review Apr 19, 2013
Weekly Market Review  Apr 19, 2013Weekly Market Review  Apr 19, 2013
Weekly Market Review Apr 19, 2013
 
Equity update (July 2021) | ICICI Prudential Mutual Fund
Equity update (July 2021) | ICICI Prudential Mutual FundEquity update (July 2021) | ICICI Prudential Mutual Fund
Equity update (July 2021) | ICICI Prudential Mutual Fund
 
Weekly Market Review, May 17, 2013
Weekly Market Review, May 17, 2013Weekly Market Review, May 17, 2013
Weekly Market Review, May 17, 2013
 
ICICI Prudential Mutual Funds Equity update
ICICI Prudential Mutual Funds Equity updateICICI Prudential Mutual Funds Equity update
ICICI Prudential Mutual Funds Equity update
 
Weekly Market Review - July 26, 2013
Weekly Market Review - July 26, 2013Weekly Market Review - July 26, 2013
Weekly Market Review - July 26, 2013
 
Equity Update (August 2021) | ICICI Prudential Mutual Fund
Equity Update (August 2021) | ICICI Prudential Mutual FundEquity Update (August 2021) | ICICI Prudential Mutual Fund
Equity Update (August 2021) | ICICI Prudential Mutual Fund
 
Advice for the wise - June 2015
Advice for the wise - June 2015Advice for the wise - June 2015
Advice for the wise - June 2015
 
Weekly Market Review, April 05, 2013
Weekly Market Review, April 05, 2013Weekly Market Review, April 05, 2013
Weekly Market Review, April 05, 2013
 
Weekly Market Review - June 28, 2013
Weekly Market Review - June 28, 2013Weekly Market Review - June 28, 2013
Weekly Market Review - June 28, 2013
 
Advice for the Wise October 2015
Advice for the Wise October 2015Advice for the Wise October 2015
Advice for the Wise October 2015
 
Weekly Market Review ; May 3, 2013
Weekly Market Review ; May 3, 2013Weekly Market Review ; May 3, 2013
Weekly Market Review ; May 3, 2013
 
Weekly Market Review - July 12, 2013
Weekly Market Review - July 12, 2013Weekly Market Review - July 12, 2013
Weekly Market Review - July 12, 2013
 
Weekly Market Review - August 2, 2013
Weekly Market Review - August 2, 2013Weekly Market Review - August 2, 2013
Weekly Market Review - August 2, 2013
 
The world this week - 25th may to 30th may, 2015
The world this week - 25th may to 30th may, 2015The world this week - 25th may to 30th may, 2015
The world this week - 25th may to 30th may, 2015
 
Weekly Market Review - August 30, 2013
Weekly Market Review - August 30, 2013Weekly Market Review - August 30, 2013
Weekly Market Review - August 30, 2013
 

More from Rahulpathak154

More from Rahulpathak154 (20)

UTI Floater Fund - AUM
UTI Floater Fund - AUMUTI Floater Fund - AUM
UTI Floater Fund - AUM
 
UTI Money Market Fund - AUM
UTI Money Market Fund - AUMUTI Money Market Fund - AUM
UTI Money Market Fund - AUM
 
UTI Ultra Short Term Fund - AUM
UTI Ultra Short Term Fund - AUMUTI Ultra Short Term Fund - AUM
UTI Ultra Short Term Fund - AUM
 
UTI Mastershare Unit Scheme - AUM
UTI Mastershare Unit Scheme - AUMUTI Mastershare Unit Scheme - AUM
UTI Mastershare Unit Scheme - AUM
 
UTI Mastershare Unit Scheme - Performance
UTI Mastershare Unit Scheme - PerformanceUTI Mastershare Unit Scheme - Performance
UTI Mastershare Unit Scheme - Performance
 
UTI Value Opportunities Fund - AUM
UTI Value Opportunities Fund - AUMUTI Value Opportunities Fund - AUM
UTI Value Opportunities Fund - AUM
 
UTI Value Opportunities Fund - Performance
UTI Value Opportunities Fund - PerformanceUTI Value Opportunities Fund - Performance
UTI Value Opportunities Fund - Performance
 
UTI Mastershare Unit Scheme - No. of Investors
UTI Mastershare Unit Scheme - No. of InvestorsUTI Mastershare Unit Scheme - No. of Investors
UTI Mastershare Unit Scheme - No. of Investors
 
UTI Corporate Bond Fund - AUM
UTI Corporate Bond Fund - AUMUTI Corporate Bond Fund - AUM
UTI Corporate Bond Fund - AUM
 
Market outlook debt march 2021
Market outlook debt march 2021Market outlook debt march 2021
Market outlook debt march 2021
 
IDFC Credit Risk Fund_One pager
IDFC Credit Risk Fund_One pagerIDFC Credit Risk Fund_One pager
IDFC Credit Risk Fund_One pager
 
IDFC Nifty ETF_Scheme information document
IDFC Nifty ETF_Scheme information documentIDFC Nifty ETF_Scheme information document
IDFC Nifty ETF_Scheme information document
 
IDFC Nifty ETF_Latest portfolio
IDFC Nifty ETF_Latest portfolioIDFC Nifty ETF_Latest portfolio
IDFC Nifty ETF_Latest portfolio
 
IDFC Nifty ETF_Key information memorandum
IDFC Nifty ETF_Key information memorandumIDFC Nifty ETF_Key information memorandum
IDFC Nifty ETF_Key information memorandum
 
IDFC Nifty ETF_Factsheet
IDFC Nifty ETF_FactsheetIDFC Nifty ETF_Factsheet
IDFC Nifty ETF_Factsheet
 
IDFC Nifty ETF_Fund spotlight
IDFC Nifty ETF_Fund spotlightIDFC Nifty ETF_Fund spotlight
IDFC Nifty ETF_Fund spotlight
 
IDFC Sensex ETF_Scheme information document
 IDFC Sensex ETF_Scheme information document IDFC Sensex ETF_Scheme information document
IDFC Sensex ETF_Scheme information document
 
IDFC Sensex ETF_Fund spotlight
 IDFC Sensex ETF_Fund spotlight IDFC Sensex ETF_Fund spotlight
IDFC Sensex ETF_Fund spotlight
 
IDFC Sensex ETF_Factsheet
 IDFC Sensex ETF_Factsheet IDFC Sensex ETF_Factsheet
IDFC Sensex ETF_Factsheet
 
IDFC Focused Equity Fund_Key information memorandum
IDFC Focused Equity Fund_Key information memorandumIDFC Focused Equity Fund_Key information memorandum
IDFC Focused Equity Fund_Key information memorandum
 

Recently uploaded

一比一原版CBU毕业证卡普顿大学毕业证成绩单如何办理
一比一原版CBU毕业证卡普顿大学毕业证成绩单如何办理一比一原版CBU毕业证卡普顿大学毕业证成绩单如何办理
一比一原版CBU毕业证卡普顿大学毕业证成绩单如何办理
btohy
 
一比一原版MQU毕业证麦考瑞大学毕业证成绩单如何办理
一比一原版MQU毕业证麦考瑞大学毕业证成绩单如何办理一比一原版MQU毕业证麦考瑞大学毕业证成绩单如何办理
一比一原版MQU毕业证麦考瑞大学毕业证成绩单如何办理
aytyn
 

Recently uploaded (7)

cyberagent_For New Investors_EN_240424.pdf
cyberagent_For New Investors_EN_240424.pdfcyberagent_For New Investors_EN_240424.pdf
cyberagent_For New Investors_EN_240424.pdf
 
一比一原版CBU毕业证卡普顿大学毕业证成绩单如何办理
一比一原版CBU毕业证卡普顿大学毕业证成绩单如何办理一比一原版CBU毕业证卡普顿大学毕业证成绩单如何办理
一比一原版CBU毕业证卡普顿大学毕业证成绩单如何办理
 
Investor Day 2024 Presentation Sysco 2024
Investor Day 2024 Presentation Sysco 2024Investor Day 2024 Presentation Sysco 2024
Investor Day 2024 Presentation Sysco 2024
 
Collective Mining | Corporate Presentation - May 2024
Collective Mining | Corporate Presentation - May 2024Collective Mining | Corporate Presentation - May 2024
Collective Mining | Corporate Presentation - May 2024
 
Teck Investor Presentation - May 23, 2024
Teck Investor Presentation - May 23, 2024Teck Investor Presentation - May 23, 2024
Teck Investor Presentation - May 23, 2024
 
一比一原版MQU毕业证麦考瑞大学毕业证成绩单如何办理
一比一原版MQU毕业证麦考瑞大学毕业证成绩单如何办理一比一原版MQU毕业证麦考瑞大学毕业证成绩单如何办理
一比一原版MQU毕业证麦考瑞大学毕业证成绩单如何办理
 
Collective Mining | Corporate Presentation - May 2024
Collective Mining | Corporate Presentation - May 2024Collective Mining | Corporate Presentation - May 2024
Collective Mining | Corporate Presentation - May 2024
 

Market outlook equity march 2021

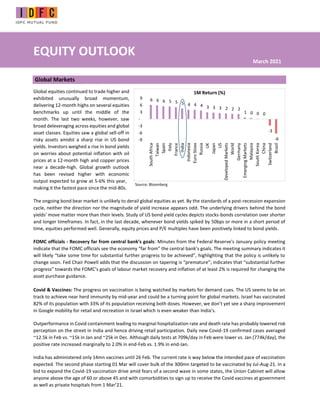
  • 1. EQUITY OUTLOOK Global Markets Global equities continued to trade higher and exhibited unusually broad momentum, delivering 12-month highs on several equities benchmarks up until the middle of the month. The last two weeks, however, saw broad deleveraging across equities and global asset classes. Equities saw a global sell-off in risky assets amidst a sharp rise in US bond yields. Investors weighed a rise in bond yields on worries about potential inflation with oil prices at a 12-month high and copper prices near a decade-high. Global growth outlook has been revised higher with economic output expected to grow at 5-6% this year, making it the fastest pace since the mid-80s. The ongoing bond bear market is unlikely to derail global equities as yet. By the standards of a post-recession expansion cycle, neither the direction nor the magnitude of yield increase appears odd. The underlying drivers behind the bond yields' move matter more than their levels. Study of US bond yield cycles depicts stocks-bonds correlation over shorter and longer timeframes. In fact, in the last decade, whenever bond yields spiked by 50bps or more in a short period of time, equities performed well. Generally, equity prices and P/E multiples have been positively linked to bond yields. FOMC officials - Recovery far from central bank’s goals: Minutes from the Federal Reserve's January policy meeting indicate that the FOMC officials see the economy “far from” the central bank’s goals. The meeting summary indicates it will likely “take some time for substantial further progress to be achieved”, highlighting that the policy is unlikely to change soon. Fed Chair Powell adds that the discussion on tapering is “premature”; indicates that “substantial further progress” towards the FOMC’s goals of labour market recovery and inflation of at least 2% is required for changing the asset purchase guidance. Covid & Vaccines: The progress on vaccination is being watched by markets for demand cues. The US seems to be on track to achieve near herd immunity by mid-year and could be a turning point for global markets. Israel has vaccinated 82% of its population with 33% of its population receiving both doses. However, we don’t yet see a sharp improvement in Google mobility for retail and recreation in Israel which is even weaker than India’s. Outperformance in Covid containment leading to marginal hospitalization rate and death rate has probably lowered risk perception on the street in India and hence driving retail participation. Daily new Covid-19 confirmed cases averaged ~12.5k in Feb vs. ~15k in Jan and ~25k in Dec. Although daily tests at 709k/day in Feb were lower vs. Jan (774k/day), the positive rate increased marginally to 2.0% in end-Feb vs. 1.9% in end-Jan. India has administered only 14mn vaccines until 26 Feb. The current rate is way below the intended pace of vaccination expected. The second phase starting 01 Mar will cover bulk of the 300mn targeted to be vaccinated by Jul-Aug-21. In a bid to expand the Covid-19 vaccination drive amid fears of a second wave in some states, the Union Cabinet will allow anyone above the age of 60 or above 45 and with comorbidities to sign up to receive the Covid vaccines at government as well as private hospitals from 1 Mar’21. March 2021 Source: Bloomberg 6 6 6 5 5 5 4 4 4 3 3 3 2 2 2 1 0 0 0 -3 -6 -9 -6 -3 - 3 6 9 South Africa Taiwan Spain Italy France India Indonesia Euro Stoxx Russia UK Japan US Developed Markets World Germany Emerging Markets Malaysia South Korea China Switzerland Brazil 1M Return (%)
  • 2. Domestic Markets After lagging behind significantly in Jan, MSCI India (USD) rose 5.1% in Feb and significantly outperformed peers MSCI AC Asia Pacific ex Japan (+3.8%) and MSCI EM (+4.4%) on post-budget euphoria. Mid-caps and small-caps outperformed large caps by ~4%/5%, respectively, in Feb. Source: Bloomberg Capital Flows: FPIs recorded net inflows of USD4.1bn into Indian equities in Feb and remained net sellers in the debt markets with net outflows of USD868mn. DIIs remained net equity sellers at USD2.2bn in Feb, while insurance funds bought USD206mn of equities in Feb. FPI net flows (USD bn) DII net flows (USD bn) Bond Markets and Currency: Benchmark 10-year treasury yields averaged at 6.09% in Feb (19bps higher vs. Jan avg.). On month end values, the 10Y yield was up 33bps to end the month at 6.23%. US 10Y yield is at 1.40% (+34bps MoM, +26bps YoY). INR lost 0.7% and ended the month at 73.47 per USD in Feb. In the last 12 months, INR (-1.8%) has outperformed the broader EM FX (-2.6%). DXY gained +0.3% in Feb (vs. +0.7% in Jan) and ended the month at 90.88 (-7.4% in the last 12 months). India’s FX reserves are close to their all-time peak at USD584bn as of 19 Feb. FX reserves have decreased by USD1.5bn in the last 4 weeks. While, fiscal deficit for Apr-Jan was Rs12.3tn or 67% of the budgeted FY21 deficit (Rs.18.5tn). This compares to 106% reached during the same time frame in FY20. 7 12 28 30 12 16 11 -37 91 4 11 18 39 39 6 15 12 -36 112 12 12 22 44 42 -1 13 9 -42 139 14 -100 -50 - 50 100 150 1M Ret 3M Ret 6M Ret 1Y Ret 3Y Ret 5Y Ret 10Y Ret Till Mar- 20 bottom Since Mar-20 bottom YTD Return Nifty 50, Mid Cap and Small Cap Returns (%) Nifty 50 NIFTY Midcap 100 NIFTY Smallcap 100 Source: Bloomberg
  • 3. RBI policy: The RBI kept policy rates on hold, reiterated its accommodative stance, indicated a phased withdrawal of last year’s reserve requirement cut, but simultaneously pledged to keep liquidity conditions accommodative to ensure the government’s larger-than-expected borrowing program goes through non-disruptively – all of which was expected. Q3 FY21 Earnings Season Corporate India’s Q3FY21 performance is noteworthy with more surprises than disappointments. Earnings continue to beat estimates with almost 3 upgrades for every 1 downgrade in BSE200, highest in several quarters. Source: Bloomberg The earnings momentum accelerated further in 3QFY21, aided by pickup in sales growth. Aggregate sales growth of domestically-oriented companies has turned positive after five consecutive quarters of contraction, and points to a recovering domestic demand. BSE 200 saw second quarter of upward revision, whereas the mid-cap index has seen 3 consecutive quarters of upward revision in EPS estimates. Adjusted PAT for the BSE All Cap (~840 stocks) grew a handsome 33% YoY in 3QFY21 which is the highest in nearly 4 years, after similar strength in 2Q. Close to 70% of this was on account of Materials/Energy – benefitting from ongoing commodity inflation (including oil inventory gains). Ex-Metals, growth stands at 24% YoY. Metals, Oil, Auto, IT and Pharma sectors are key contributors to the earnings growth, while BFSI, Engineering and Media disappointed. Consensus estimates continue to be upgraded and are now implying aggregate PAT growth of ~30-35% YoY in FY22. Source: Bloomberg 29% 19% 12% 9% 7% 6% 5% 5% 4% 4% 4% 2% 2% 0% 0% -4% -10% 0% 10% 20% 30% 40% CorpBk Cmdty Auto Cement BSE200 Energy NBFCCyc Stap IT RetBk NBFCStab Disc Industrial Utilities Pharma Telecom Avg EPS Change: current quarter 6.1% 3.0% -15% -10% -5% 0% 5% 10% Dec-05 Sep-06 Jun-07 Mar-08 Dec-08 Sep-09 Jun-10 Mar-11 Dec-11 Sep-12 Jun-13 Mar-14 Dec-14 Sep-15 Jun-16 Mar-17 Dec-17 Sep-18 Jun-19 Mar-20 Dec-20 BSE200 EPS Revision 2 Yr Fwd 5.4% 7.6% 8.5% -30% -20% -10% 0% 10% 20% Sep-11 Mar-12 Sep-12 Mar-13 Sep-13 Mar-14 Sep-14 Mar-15 Sep-15 Mar-16 Sep-16 Mar-17 Sep-17 Mar-18 Sep-18 Mar-19 Sep-19 Mar-20 Sep-20 Feb-21 NSE MidCap EPS Revision 2Yr Fwd
  • 4. Sectoral Impact Metals, PSU Banks and Industrials outperformed while Healthcare, Staples and IT were notable laggards in Feb. Sectoral Performance as on February 26, 2021 1M Ret 3M Ret 6M Ret 1Yr Ret 3Yr Ret 5Yr Ret Till Mar- 20 bottom Since Mar-20 Since Jan-18 Since Sep-13 USD INR -0.7% 0.8% 0.2% -1.8% -4.3% -1.4% -6.9% 3.7% -15.4% -2.2% Market Cap Wise Nifty 50 6.6% 12.0% 27.6% 29.7% 11.5% 15.8% -37.5% 90.9% 39.2% 13.4% NIFTY Midcap 100 11.3% 18.0% 39.5% 38.6% 5.8% 15.1% -35.7% 111.7% 10.2% 17.6% NIFTY Smallcap 100 12.2% 22.5% 44.0% 41.8% -1.2% 13.1% -42.2% 138.7% -12.3% 15.7% Sector Wise S&P BSE Pvt Banks 11.8% 12.8% 42.5% 19.6% 10.8% 20.0% -48.5% 108.1% 35.7% 20.5% S&P BSE PSU 22.5% 32.5% 36.3% 19.3% -5.6% 4.9% -41.0% 71.0% -23.4% 3.5% S&P BSE FMCG -2.1% 2.1% 5.4% 9.1% 4.5% 11.0% -24.0% 38.0% 12.2% 8.2% S&P BSE Auto 3.7% 14.0% 29.7% 47.3% -2.6% 7.7% -43.0% 117.6% -13.6% 10.4% S&P BSE Cons Durables 5.5% 17.4% 39.5% 21.4% 14.5% 23.6% -29.5% 80.1% 39.7% 25.9% S&P BSE Healthcare 1.1% 2.6% 13.4% 54.7% 14.0% 6.5% -18.0% 89.5% 40.8% 11.6% S&P BSE Info Tech -1.6% 12.9% 35.3% 63.0% 25.1% 19.1% -27.6% 118.0% 117.8% 16.7% S&P BSE Telecom 3.7% 20.6% 13.9% 18.2% -0.9% 3.2% -19.8% 56.1% -16.1% 1.6% S&P BSE Utilities 17.5% 21.7% 30.0% 25.3% -0.7% 8.7% -32.0% 67.9% -10.6% 6.5% S&P BSE Capital Goods 10.5% 26.4% 56.6% 39.8% 4.1% 13.9% -41.1% 115.5% 12.0% 14.9% S&P BSE India Infra 20.7% 35.4% 50.4% 44.5% -2.5% 10.9% -39.9% 109.4% -12.1% S&P BSE India Manufacturing 4.4% 11.5% 18.2% 29.6% 5.9% 11.6% -34.5% 78.1% 15.3% 10.9% S&P BSE Oil & Gas 12.5% 17.3% 18.8% 23.2% 0.1% 13.6% -39.3% 73.8% -4.1% 9.0% S&P BSE Metal 24.4% 34.3% 55.3% 66.5% -3.3% 15.2% -48.2% 154.1% -7.7% 6.9% Source: Bloomberg The Macro Picture PMI: Composite PMI increased by 0.9pt MoM to 55.8 in Jan after a 1.4pt MoM decline in Dec. Helped by stronger demand conditions, Services PMI rose to 52.8 in Jan from 52.3 in Dec, while Manufacturing PMI inched up to 57.7 in Jan from 56.4 in Dec. The forward-looking demand indicators remained constructive with composite new orders remaining strong at 55.9, increasing 1.0pt MoM. Inflation: Jan CPI inflation came in at 4.1%, softening further from 4.6% in Dec. Food prices led the downside surprise, dropping 1% MoM on the back of last month’s 1.5% fall. Vegetable prices continued to mean-revert, plunging 11.5%
  • 5. MoM in Jan after a 9% fall in Dec. Most other food prices, including pulses, came in soft as expected, except oilseeds, which reflected rising global prices. As a result, food inflation softened to 2.7% YoY in Jan from 3.9% in Dec. Core prices (core inflation ex. gasoline and diesel) increased 0.5% MoM in Jan after a 0.3% rise in Dec, likely reflecting a combination of pent-up demand and input cost pressures. Import Export: India's exports up 6.16% in Jan; trade deficit narrows USD14.54bn, following healthy growth in pharma and engineering sectors. Similarly, imports dropped by about 26% to USD300.26bn during April-Jan this fiscal. GDP at 96% of its 1QFY20 pre-pandemic levels: India's GDP grew 0.4% in Q3 of FY21, underpinned by weak service sector growth. Few key highlights were (i) trade, hotels, transport, and communication services continued to contract, much more than some of the formal sector indicators had suggested, indicating continued weakness in the informal sector; and (ii) government consumption continued to contract, despite a material pickup in central government spending, suggesting contractions in state government spending offset the central government impulse. Sequential growth was strong at 25% QoQ, taking GDP to 96% of its 1QFY20 pre-pandemic level. Economic growth revised upwards: Global forecasting firm Oxford Economics revised India's economic growth projection for 2021 to 10.2% from the earlier 8.8%, citing receding Covid-19 risks and the shift in the monetary policy outlook. GST collections: GST collections in Feb’21 stood at INR 1.13trn (7.4% YoY), crossing the Rs1trn mark for the 5th consecutive month. The govt. has credited this to economic recovery and the various measures taken by tax administration to improve compliance. • The upcoming GST Council meeting in Mar’21 will likely take up rationalizing tax rates and mergers of multiple slabs, to bring them close to being revenue-neutral and make the indirect tax regime simpler (The 15th Finance Commission has recommended merging the 12% and 18% tax rates). • As part of efforts to bring parity in taxation on Agri-inputs, the Department of Chemical and Petrochemicals has approached the Finance Ministry for reducing GST on pesticides from 18% to 5%. • Prime Minister Narendra Modi expressed government’s commitment to bring natural gas under the GST regime to make prices cheaper and uniform across the country. He also informed that the govt. was spending Rs7.5trn over 5 years to build oil and gas infrastructure. • Renewed interest in bringing petroleum products under the ambit of GST, something that has invited resistance from states in the past since VAT from these forms ~25-30% of states’ own tax revenue. IPO, M&A and PE investments: M&A deal activity in 2020 jumps 33% to USD36.9bn. While, PE/VC investments in Jan’21 reported a 35% drop YoY to USD1.6bn from USD2.5bn. The number of deals reported also remained flat at 80, according to EY-IVCA data. SEBI eased the listing norms for large companies, apparently paving the way for the much-awaited mega float of Life Insurance Corporation (LIC). The regulator said large companies can now divest a minimum 5% in the IPO, instead of 10%. Further, they will get five years, instead of three, to raise the public float to 25%. Commodities: The run-up in international commodity prices is on expectations of stimulus-led demand coming ahead of supply normalization. Brent gained a whopping 17.5% MoM in Feb to end the month at USD64.4/bbl. It made the 1-year peak at USD67/bbl, as the market looks ahead toward an accelerated decline in record inventories. On the supply side, OPEC+ discipline and Saudi Arabia’s decision to reduce output by 1mbd through March were further amplified over 18 18 16 9 8 7 -1 -6 -10 -5 - 5 10 15 20 Brent WTI Copper Aluminium Zinc Steel Silver Gold Commodities 1M Return (%) Source: Bloomberg
  • 6. the last week when US crude production fell 3.2mbd amid an unprecedented polar blast. From the demand perspective, the winter of 2021 stands out as one of the coldest in decades, upending energy markets and sending prices for electricity, fuel and vessels to record highs. Thrust on Atma-Nirbhar Bharat through production-linked incentive (PLI) schemes PLI scheme for Telecom: The government approved a Rs121.95bn PLI scheme for Telecom gear manufacturing in India, a move that will position the nation as a global powerhouse for production of such equipment ahead of 5G roll-outs. There will be a minimum investment threshold of Rs100mn for MSMEs with incentives from 7% to 4% over five years and Rs1bn for others with incentives from 6% to 4% over five years above base year (FY2020). The government expects around Rs2.4tn of incremental production (with Rs2tn in exports) and investment of more than Rs30 bn. PLI scheme for IT hardware: The Union Cabinet approved the PLI scheme for IT hardware (laptops, tablets, all-in-one PCs and servers) with an outlay of Rs73.5bn. The aim is to enhance the development of the electronics ecosystem in India. The scheme is likely to benefit five major global players and 10 domestic champions. The scheme shall extend an incentive of 4% to 2% / 1% on net incremental sales (over FY2020) of goods manufactured in India and covered under the target segment, to eligible companies, for a period of four years. The government expects domestic value addition to increase to 20-25% by FY20225 and employment generation potential of over 180,000. PLI scheme for Pharmaceuticals: The Union Cabinet approved the PLI scheme for pharmaceuticals with an outlay of Rs150bn. The aim is to increase production and export of (1) biopharmaceuticals; complex generic drugs; patented drugs or drugs nearing patent expiry; cell based or gene therapy drugs; orphan drugs; special empty capsules; complex excipients; phytopharmaceuticals, (2) KSMs/DIs/APIs, and (3) repurposed drugs; auto immune drugs, anti-cancer drugs, anti-diabetic drugs, anti-infective drugs, cardiovascular drugs, psychotropic drugs and anti-retroviral drugs; in vitro diagnostic devices; other drugs as approved; other drugs not manufactured in India. The scheme will be available for three categories of companies having global revenue (1) greater than Rs50 bn (incentive of Rs110 bn), (2) between Rs5 bn and Rs50 bn (incentive of Rs22.5 bn), and (3) less than Rs5 bn (incentive of Rs17.5 bn). Between FY2023 and FY2028, the government expects total incremental sales of Rs2.94tn and total incremental exports of Rs1.96tn along with 20,000 direct jobs and 80,000 indirect jobs. Other Government policy updates • Monetization policy: PM Modi has said that about 100 under-utilized or unutilized assets with PSUs will be monetized to create Rs2.5trn of investment opportunities. India's government has shortlisted four mid-sized state-run banks for privatization (Bank of Maharashtra, Bank of India, Indian Overseas Bank and the Central Bank of India), under a new push to sell state assets and shore up government revenues. Two of these banks will be selected for sale in FY22. • RBI has set up an expert committee on urban co-operative banks (UCBs) to provide a road map for strengthening the sector and also evaluate the prospects for consolidating the sector. • Finance Ministry directed departments and ministries to surrender savings anticipated in the Grants for FY21 by 20 Mar’21. • Ministry of Agriculture has informed that India's food grain production is estimated to rise by 2% in 2020-21 crop year to an all-time high of 303.3MT due to better output of rice, wheat, pulses and coarse cereals. Other Key snippets: • State Budgets: Some state governments have given preference to the agriculture sector in their Budgets for FY22 amid the ongoing farmers' protest against the Centre's three farm laws- i) Rajasthan: has announced a separate budget on agriculture from next year onwards, along with provision of interest-free crop loans worth Rs160bn to the farmers, ii) UP: has proposed Rs1bn for the Aatmanirbhar Krishak Samanvit Vikas Yojana and Rs6bn for the Mukhyamantri Krishak Durghatna Kalyan Yojana, iii) Bihar: has earmarked Rs5.5bn for the Har Khet Ko Pani scheme. • The Election Commission has announced the schedule for upcoming Assembly elections- West Bengal will go to polls in eight phases, Assam will see three-phase voting starting 27 Mar’21. Assembly elections in Tamil Nadu, Kerala and Puducherry will be held in a single phase on 6 Apr’21. (Source: Indian Express)
  • 7. • Increase in the fuel prices throughout the country with petrol prices crossing the Rs100 mark in MP and Rajasthan. Key Sectoral Trends: • Banking & Finance: Key trends observed in the credit card data put out by the RBI for Dec-20 are: i) net card additions were much lower, ii) monthly spends/card increased 2% MoM in Dec-20, after the decline in Nov-20, and iii) total industry spends were 4% lower YoY in Dec-20. • Capital Goods: Capital Goods companies sailed through last-mile hiccups in productivity and supply chain in 3Q, and are targeting strong growth in execution for 4QFY21, led by normalcy in operations and acceleration in government & private spending. Valuation re-rating continues, in line with growing optimism across quality plays. • Telecom: We look at a few interesting data points from the recently-released Nokia MBiT Index Report - 2021. At 311PB/day in Dec-20, 4G constituted 99% of data traffic across network. Per-capita usage is up, while subscriber adds have slowed down. Strong rural and class C circle data traffic growth (traditional stronghold of Jio) and Jio’s slowdown in data traffic growth suggests that Bharti is probably making inroads here. • Infrastructure: Road contractors reported healthy improvement in revenues and profitability during 3QFY21, as project execution normalized to pre-Covid19 days. The outlook remains strong, with all companies boasting of good order books and strong award pipelines. • Pharma: The sector results were a mixed bag, with one half of the sector beating consensus EBITDA estimates while other half missing expectations. Although growth recovered for most of the companies in the India formulations market, the US business listed weakness across the board, owing to lower sales of seasonal products and base-price erosion. • Agriculture and Chemicals: In the chemical markets, the global recovery continues, with world chemical production up 1.8% MoM in Dec-2020. India’s chemical exports grew 2.6% YoY in Jan’21, while imports grew 16.0% YoY. Global crop futures were largely stable last month. In India, corn and soybean prices rose 3-7% MoM. • FMCG: The FMCG industry in India has recorded a value growth of 7.3% in Oct-Dec’20 quarter helped by consumption- led recovery during the festive period and increase in sales from traditional as well as organized trade, according to data analytics firm Nielsen. • Advertising spends across media platforms in India will grow by 23.5% in 2021 to Rs801.23bn in 2021 after a sharp 21.5% decline in the pandemic-hit 2020. • The Indian IT industry revenues are set to grow by 2.3% to USD194bn in FY2020-21 and the exports will go up by 1.9% to USD150bn. • Non-life insurance companies registered a 6.7% increase in their gross direct premium collection in Jan at Rs184.88bn Outlook From Indian equities point of view, the solid Dec quarter earnings was clearly a key highlight. Few, if any, would have been able to forecast, at the start of the current fiscal in April’20, that Dec ’20 quarter would deliver the highest ever quarterly profits for the BSE200 set of companies! Globally, however, the worries on inflation and the unsettling moves on the US 10-year yield gave a glimpse, a “trailer” of reality – valuations could compress; economic growth could get stunted, if bonds yields sustained and moved ahead. For the current economic recovery to sustain, containing bond yields, not through “yield curve management” but through moderating inflation expectation will be a key variable to track for the rest of the year. On this front, last week’s correction of crude oil and copper may be a sign in the right direction. If the recent surge in commodity prices can be “managed” then future inflation expectations will get moderated helping bond yields to calm down. Equity investors may be well advised to add declining bond yields, in their daily prayers!
  • 8. Disclaimer: MUTUAL FUND INVESTMENTS ARE SUBJECT TO MARKET RISKS, READ ALL SCHEME RELATED DOCUMENTS CAREFULLY. The Disclosures of opinions/in house views/strategy incorporated herein is provided solely to enhance the transparency about the investment strategy / theme of the Scheme and should not be treated as endorsement of the views / opinions or as an investment advice. This document should not be construed as a research report or a recommendation to buy or sell any security. This document has been prepared on the basis of information, which is already available in publicly accessible media or developed through analysis of IDFC Mutual Fund. The information/ views / opinions provided is for informative purpose only and may have ceased to be current by the time it may reach the recipient, which should be taken into account before interpreting this document. The recipient should note and understand that the information provided above may not contain all the material aspects relevant for making an investment decision and the security may or may not continue to form part of the scheme’s portfolio in future. Investors are advised to consult their own investment advisor before making any investment decision in light of their risk appetite, investment goals and horizon. The decision of the Investment Manager may not always be profitable; as such decisions are based on the prevailing market conditions and the understanding of the Investment Manager. Actual market movements may vary from the anticipated trends. This information is subject to change without any prior notice. The Company reserves the right to make modifications and alterations to this statement as may be required from time to time. Neither IDFC Mutual Fund / IDFC AMC Trustee Co. Ltd./ IDFC Asset Management Co. Ltd nor IDFC, its Directors or representatives shall be liable for any damages whether direct or indirect, incidental, punitive special or consequential including lost revenue or lost profits that may arise from or in connection with the use of the information.