Download to read offline
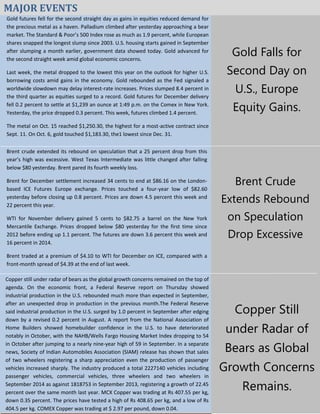


During the week of October 20-24, 2014, gold futures fell for the second consecutive day amid rising equities, while palladium neared bear market territory. Oil prices showed fluctuations with Brent crude rebounding slightly after a significant drop, and copper remained under pressure due to global growth concerns. Economic indicators revealed mixed results, with U.S. industrial production rebounding unexpectedly, while housing market confidence declined.


