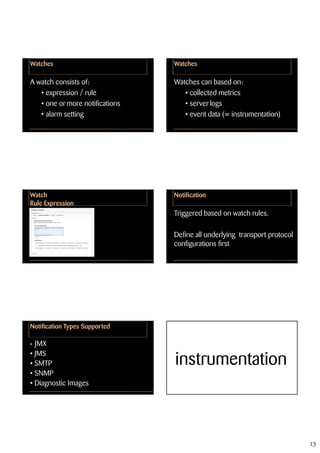
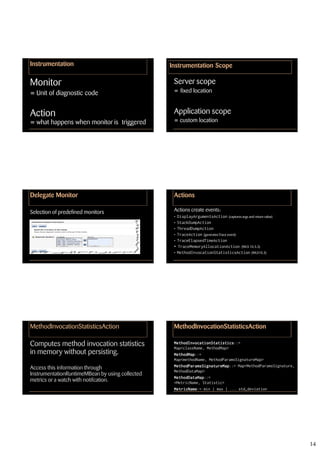
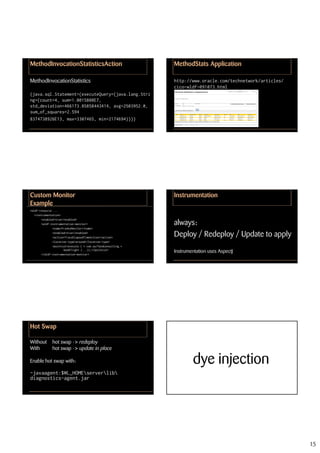
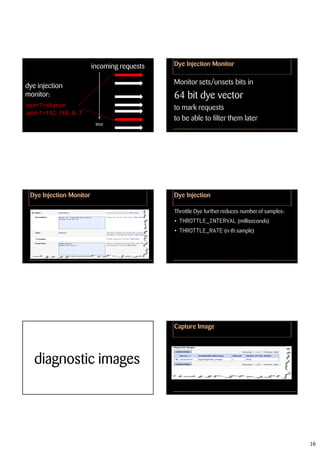
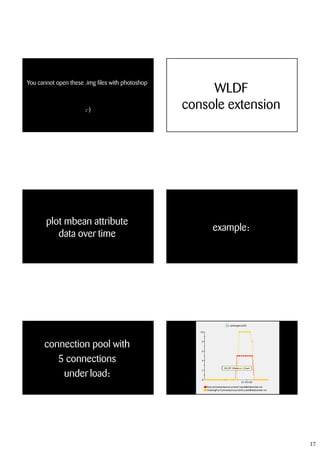
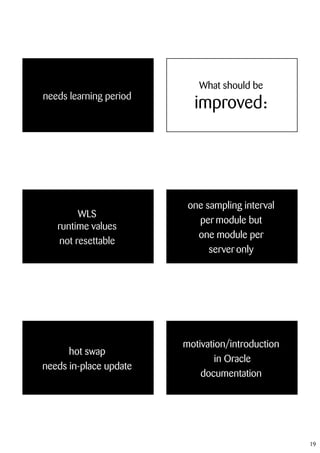
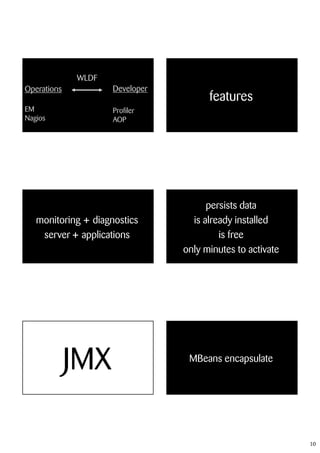
This document provides an overview of the WebLogic Diagnostic Framework (WLDF). It discusses how WLDF can be used to monitor WebLogic Server and applications through features like instrumentation, diagnostic archives, watches and notifications. Specific WLDF components are explained like collected metrics, diagnostic modules, and actions. Examples are given around monitoring method invocation statistics and using dye injection. The document recommends WLDF as being well designed, well documented, and quick to apply once there is a learning period. It suggests some areas for improvement in WLDF documentation and hot swap functionality.
Connections Administration Toolkit - Product PresentationTIMETOACT GROUP
Simplify the administration of IBM Connections with this easy to install and easy to use web interface tool. Complex multilevel administration commands can be done with just a single click, even by administrators without WebSphere background.
Easily accelerate and automate administrative tasks and enhance the maintenance tasks for IBM Connections. Benefit from extremely lowered effort for training and maintenance.
AAI-1304 Technical Deep-Dive into IBM WebSphere LibertyWASdev Community
A detailed look into the philosophy, architecture and design of the most flexible, simple and scalable Java EE Application Server on the market today; the WebSphere Liberty profile. These slides describe the motivation behind this project, and the key characteristics that are encouraging so many Java EE users to move their applications to Liberty.
The Boss: A Petascale Database for Large-Scale Neuroscience, Powered by Serve...Amazon Web Services
The IARPA Machine Intelligence from Cortical Networks (MICrONS) program is a research endeavor created to improve neurally-plausible machine-learning algorithms by understanding data representations and learning rules used by the brain through structurally and functionally interrogating a cubic millimeter of mammalian neocortex. This effort requires efficiently storing, visualizing, and processing petabytes of neuroimaging data. The Johns Hopkins University Applied Physics Laboratory (APL) has developed an open-source, highly available service to manage these data, called the Boss. The Boss uses AWS to provide a cloud-native spatial database with an innovative storage hierarchy and auto-scaling capability to balance cost and performance. This system extensively uses serverless components to meet both scalability and cost requirements. In this session, we provide an overview of the Boss, and we focus on how the APL used Amazon DynamoDB, AWS Lambda, and AWS Step Functions for several high-throughput components of the system. We discuss both the challenges and successes with serverless technologies.
CETPA INFOTECH PVT LTD is one of the IT education and training service provider brands of India that is preferably working in 3 most important domains. It includes IT Training services, software and embedded product development and consulting services.
Cloud providers like Amazon or Goggle have great user experience to create and manage PaaS and IaaS services. But is it possible to reproduce same experience and flexibility locally, in on premise datacenter? This talk describes success story of creation private cloud based on DC/OS cluster. It is used to host and share different services like hadoop or kafka for development teams, dynamically manage services and resource pools with GKE integration.
In an increasingly competitive marketplace, speed and business agility are paramount. And integration between customer-facing systems and back-end applications is more crucial than ever.
At this event, you'll learn how open source software built by communities, like Apache Camel, Docker, Kubernetes, OpenShift Origin, and Fabric8, can help organizations integrate services and establish effective continuous integration and delivery (CI/CD) pipelines.
Frank munz oracle fusion middleware and aws cloud services in sync11InSync Conference
Insync2011 presentation by Dr. Frank Munz. A technical review of Oracle's Cloud computing perspective (Oracle provided AMIs, Oracle VM templates) and Amazon Cloud Services such as SNS/SQS, Elastic Load Balancing, Autoscaling.
Ebs operational reporting at santos evaluation, selection & implementation
WebLogic Diagnostic Framework Dr. Frank Munz / munz & more WLS11g
1. WebLogic Diagnostic
Framework
For the Busy IT Professional
welcome!
munz & more
Dr. Frank Munz
Insync, Aug2010
about me Frank Munz
Java EE
and
EAI
10 years with some BPM
= SOA
1
2. 3
years ago
munz & more working globally
http://www.munzandmore.com based @ Manly & Munich
2
4. Weblogic Server
Oracle Service Bus
Version 4 to 11g
Architecture
Operation
from the very beginning
Development
Training / Coaching
Weblogic Server Course
Architecture, Features and Operation
high end curriculum
Monitoring, Sizing and Performance
WLS / OSB / SOA Tuning
arch / features / operation Oracle Service Bus Course
monitoring / sizing / performance tuning Architecture, Development and
Operation
4
6. some passengers per year
45.000.000 (max)
30 821
in 6 hours
30 821
passengers
6
7. looking at:
worse: this went on for hours…
monitoring + diagnostic
is important important
7
8. “So far, this was not
necessary” 3.
how is
tools your most important
application doing right now?
?
8
9. Free Heap? Size of http session?
Time to
Free DB connections
replicate http session
in connection pool?
in cluster?
What SQL is sent
to the DB?
At which LOC?
positioning
How long is it executing?
9
10. WLDF
Operations Developer
features
EM Profiler
Nagios AOP
persists data
monitoring + diagnostics is already installed
server + applications is free
only minutes to activate
JMX MBeans encapsulate
10
11. Configuration Data
+ MBeans have
Runtime Values
WLST
attributes
start WLST with:
operations
children java weblogic.WLST [Script.py]
notifications -> domainRuntime()
WLST Quick Reference
ls() show current mbean / cmo = current managed object
ls('a') shows attributes , 'c' child mbeans, 'o' operations
cd() navigate
serverConfig() change to config mbeans
serverRuntime() change to server runtime
domainRuntime() change to domain runtime
jndi()
edit()
change to jndi tree
change to edit tree
WLDF basics
startEdit() start an edit session, then use set('pn','v') / get('pn')
save() persist changes
activate() activate changes
undo() undo changes
easeSyntax()
easeSyntax() switch off python syntax, do not use for scripting
11
12. Diagnostic System Module
Create a system modul,
target it to any number of servers
• You can have many modules configured
collected metrics
• Set target to particular server when needed
• You can change module target witout restart
Collected Metrics Collected Metric
Type and Attributes
... replace your WLST script that
contains a loop with sleep() e.g. to
monitor free heap.
Remember:
Collected metrics = harvested data
Diagnostic Archives
• File (default) watches
• DB archive &
both come with retirement options
notifications
12
13. Watches Watches
A watch consists of: Watches can based on:
• expression / rule • collected metrics
• one or more notifications • server logs
• alarm setting • event data (= instrumentation)
Watch Notification
Rule Expression
Triggered based on watch rules.
Define all underlying transport protocol
configurations first
Notification Types Supported
• JMX
• JMS
• SMTP instrumentation
• SNMP
• Diagnostic Images
13
14. Instrumentation Instrumentation Scope
Monitor Server scope
= Unit of diagnostic code = fixed location
Action Application scope
= what happens when monitor is triggered = custom location
Delegate Monitor Actions
Selection of predefined monitors Actions create events:
• DisplayArgumentsAction (captures args and return value)
• StackDumpAction
• ThreadDumpAction
• TraceAction (generates Trace event)
• TraceElapsedTimeAction
• TraceMemoryAllocationAction (WLS 10.3.3)
• MethodInvocationStatisticsAction (WLS10.3)
MethodInvocationStatisticsAction MethodInvocationStatisticsAction
Computes method invocation statistics MethodInvocationStatistics::=
MethodInvocationStatistics
Map<className, MethodMap>
in memory without persisting. MethodMap::=
MethodMap
Map<methodName, MethodParamsSignatureMap>
MethodParamsSignatureMap::= Map<MethodParamsSignature,
MethodParamsSignatureMap
Access this information through
MethodDataMap>
InstrumentationRuntimeMBean by using collected
MethodDataMap::=
MethodDataMap
metrics or a watch with notifcation. <MetricName, Statistic>
MetricName:= min | max | ... std_deviation
MetricName
14
15. MethodInvocationStatisticsAction MethodStats Application
MethodInvocationStatistics http://www.oracle.com/technetwork/articles/
cico-wldf-091073.html
{java.sql.Statement={executeQuery={java.lang.Stri
ng={count=4, sum=1.0015808E7,
std_deviation=466173.85858443414, avg=2503952.0,
sum_of_squares=2.594
8374738926E13, max=3307465, min=2174694}}}}
Custom Monitor Instrumentation
Example
<wldf-resource ...
<instrumentation>
always:
<enabled>true</enabled>
<wldf-instrumentation-monitor>
<name>FranksMonitor</name>
<enabled>true</enabled>
<action>TraceElapsedTimeAction</action>
Deploy / Redeploy / Update to apply
<location-type>around</location-type>
<pointcut>execute ( * com.surfandconsulting.*
bookFligh* (...));</pointcut>
Instrumentation uses AspectJ
</wldf-instrumentation-monitor>
Hot Swap
Without hot swap -> redeploy
With hot swap -> update in place
Enable hot swap with: dye injection
-javaagent:$WL_HOMEserverlib
diagnostics-agent.jar
15
16. incoming requests Dye Injection Monitor
dye injection
Monitor sets/unsets bits in
monitor: 64 bit dye vector
user1=sharon to mark requests
addr1=192.168.0.7
to be able to filter them later
time
Dye Injection Monitor Dye Injection
Throttle Dye further reduces number of samples:
• THROTTLE_INTERVAL (milliseconds)
• THROTTLE_RATE (n-th sample)
Capture Image
diagnostic images
16
17. You cannot open these .img files with photoshop
WLDF
;-) console extension
plot mbean attribute
example:
data over time
connection pool with
5 connections
under load:
17
18. with “PinnedToThread”
enabled:
/dashboard
is the new WLDF console extension
well designed
Conclusion well docuemented
quick to apply
18
19. What should be
needs learning period
improved:
one sampling interval
WLS
per module but
runtime values
one module per
not resettable
server only
motivation/introduction
hot swap
in Oracle
needs in-place update
documentation
19
20. more information: www.munzandmore.com/blog
WebLogic on
Amazon and
Rackspace Mike Cico‘s article:
http://www.oracle.com/technetwork/articles/cico-wldf-091073.html
Cloud
www.munzandmore.com/book
Oracle WLDF docs: the end
http://download.oracle.com/docs/cd/E14571_01/web.1111/e13714/toc.htm
20