Download to read offline
![International Research Journal of Engineering and Technology (IRJET) e-ISSN: 2395-0056
Volume: 09 Issue: 01 | Jan 2022 www.irjet.net p-ISSN: 2395-0072
© 2022, IRJET | Impact Factor value: 7.529 | ISO 9001:2008 Certified Journal | Page 1201
Web Application for House Price Prediction
Ameena Farooq V P1, Caina Rose Paul2, Vismaya K3
1-3Students, Dept. of Computer Science and Engineering, Cochin University of Science and Technology, Kerala,
India.
---------------------------------------------------------------------***----------------------------------------------------------------------
Abstract - This paper presents our work on an attempt to
create a web application that can predict the price of a
house using textual and visual features of the house. Our
agenda was to produce a user-friendly software that is
accessible to everyone. As building or buying a house is
something every person does at some point in their lives, we
thought this is a very essential and relevant project. To
create the machine learning model two models were trained
and merged in the end so that two different aspects of the
house can be considered. Dense layers (model1) were used
to train the textual features of the house which included
number of bedrooms, number of bathrooms, area (in sq ft),
and zipcode. For training the visual images that included
the pictures of the bedroom, bathroom, kitchen and frontal
elevation of the house CNN architecture was used (model2).
Both model1 and model2 were combined to get the final
model. As a frontend, a web application was created using
streamlit where inputs (both textual and visual) can be
inserted to get the predicted price of the house. Our research
work was successful as we created a web application that
can be used by everyone, even people who do not have any
prior technological knowledge. The only prerequisite for
using the web application is the requirement of data of the
house
Key Words: Web application, house price prediction,
Machine learning, Convolution Neural Network,
Streamlit.
1. INTRODUCTION
Building a house can be a person’s lifetime dream but a
layman may not know the expenses for building the house
and without proper planning and understanding they
might have to spend a lot of money and sometimes even
exhaust their savings. Traditionally estimating the
building expenditure of the house is a tedious process. It is
usually based on comparable sales price, the value of
similar properties, and interference of unauthorized third
parties, which is unreliable. It is always better to
understand the expenses of building a house beforehand
so that it can be adjusted according to one’s likings. This
prior knowledge of the expenditure of the house will help
in efficiently managing one's finances and prevent
repentance in the future.
This motivated us to pursue this research work to ensure
that people are aware of the outlay. Precise automatic
prediction for the houses prices is needed to help
policymakers to better design policies and control
inflation and also help individuals for wise investment
plans. Keeping in mind about all the people in the world
we have created a web application that can be used by
anyone with ease, even people without any technical
knowledge.
2. RELATED WORK
To discover weaknesses in the current systems and
improve its effectiveness, we must first comprehend it.
The following is a list of current literature for the problem
at hand.
The model[2] predicts the price based on the historical
market price, present market value, and future
development. It also features a user-friendly website
where customers’ requirements are collected. For data
mining, the Naive Bayes method is employed. The
disadvantage of this system is that they do not consider a
visual data set.
The CNN model is used for feature extraction from
satellite pictures[4,1], such as signs and text, and it
predicts the price using linear regression on the limited
data obtained after processing images. The following
model makes use of a satellite to capture the street and
aerial view, as well as the gathered dwelling qualities, such
as location accessibility, neighborhood amenity, and
structural elements. However, because a precise image of
the house is not provided, the anticipated value may be
erroneous. Instead, this model’s predictions are made
based on the area.
Another model[3] uses both texts and images, it is a
comparative study of the SVM and simple Neural network
model. Since the texts and images are not separated, the
accuracy may be compromised.
There is, however, no system that offers a user-friendly
online web app that uses both images and textual details
of the house to predict the price, which is planned to be
built.
3. PROPOSED SYSTEM
Dataset is the primary requirement of a machine learning
model. Dataset for house prices that contains both visual
and textual information composed of 535 sample houses
from California state in the United States of
America(U.S.A) is used here. Each house is represented by
four images: a bathroom, a bedroom, a kitchen and a
frontal view of the house. There are 2140 photos in the
dataset folder. It also includes a text file with textual](https://image.slidesharecdn.com/irjet-v9i1213-220912083154-1c7ff7d2/75/Web-Application-for-House-Price-Prediction-1-2048.jpg)
![International Research Journal of Engineering and Technology (IRJET) e-ISSN: 2395-0056
Volume: 09 Issue: 01 | Jan 2022 www.irjet.net p-ISSN: 2395-0072
© 2022, IRJET | Impact Factor value: 7.529 | ISO 9001:2008 Certified Journal | Page 1202
information. The number of houses in order is represented
by each row in the file. The textual data represents the
house's physical qualities, such as the number of
bedrooms, bathrooms, and square footage area, as well as
the zip code of the location.
The main aim of our research is to build a user-friendly
web application where the price of a house can be
predicted using details including visual and textual
features of the house. The proposed system's model was
built using dense layers and convolution neural networks.
Preprocessing of the dataset is done before building the
model. Once all the preprocessing steps are done, the data
is trained using a Multilayer Perceptron model that has
been built using the Keras Functional API. A dense model
is used to extract features from text data. Textual data is
passed through dense layers and saved as an input
model1. The CNN model is used to extract features from
image data and saved as an input model2. The input
model1 and input model2 are further merged and again
passed through dense layers and finally through the
flattening layer. Training of the model is stopped using the
early stopping callback method and the best model
weights are saved and exported.
The convolution layer is the core building block of CNN.
This layer performs a dot product between two matrices,
where one matrix is the set of learnable parameters,
otherwise known as a kernel, and the other matrix is the
restricted portion of the receptive field. The kernel is
spatially smaller than an image but is more in-depth. This
means that, if the image is composed of three (RGB)
channels, the kernel height and width will be spatially
small, but the depth extends up to all three channels. The
rectifier linear activation function or ReLu is a piecewise
linear function that will output the input directly if it is
positive, otherwise, it will output zero.
The dense layer is a neural network layer that is
connected deeply, which means each neuron in the dense
layer receives input from all neurons of its previous layer.
The dense layer is found to be the most commonly used
layer in the models. The dense layer performs matrix-
vector multiplication. The values used in the matrix are
parameters that can be trained and updated with the help
of backpropagation. The output generated by the dense
layer is an ‘m’ dimensional vector. Thus, a dense layer is
basically used to change the dimensions of the vector[8].
Dense layers also apply operations like rotation, scaling,
and translation to the vector.
Once the model is built, the front end for the web app is
created using the streamlit library. The web app contains
different pages: one for the logo, a signup and login page,
and the last page for entering the details of the house and
getting the predictions. Each of these pages was designed
separately and connected with one another using
hyperlinks. The web app was then deployed using
streamlit sharing to obtain a public URL that can be
accessed by anyone who has the link. This way, any person
can get the price of the house without professional help or
a third party.
4. SYSTEM ARCHITECTURE
As shown in figure-1 our research includes two main
components. First the web app for the user and second the
model built by us. When a user launches the web app, he
or she is presented with a login/signup screen. If they are
a new user they are required to sign in by creating an
account, or else they can just log in by entering their
username and password. They are then directed to the
home page where they should enter the input data
required and once they click on the predict button they
obtain the prediction stating the cost of the house.
Fig -1: System Architecture
The data is preprocessed before building the model using
various techniques considering each attribute. The
preprocessed data is divided into two halves of training
and testing data in a 70:30 ratio. Both the data sets are
trained and tested to obtain satisfactory results.
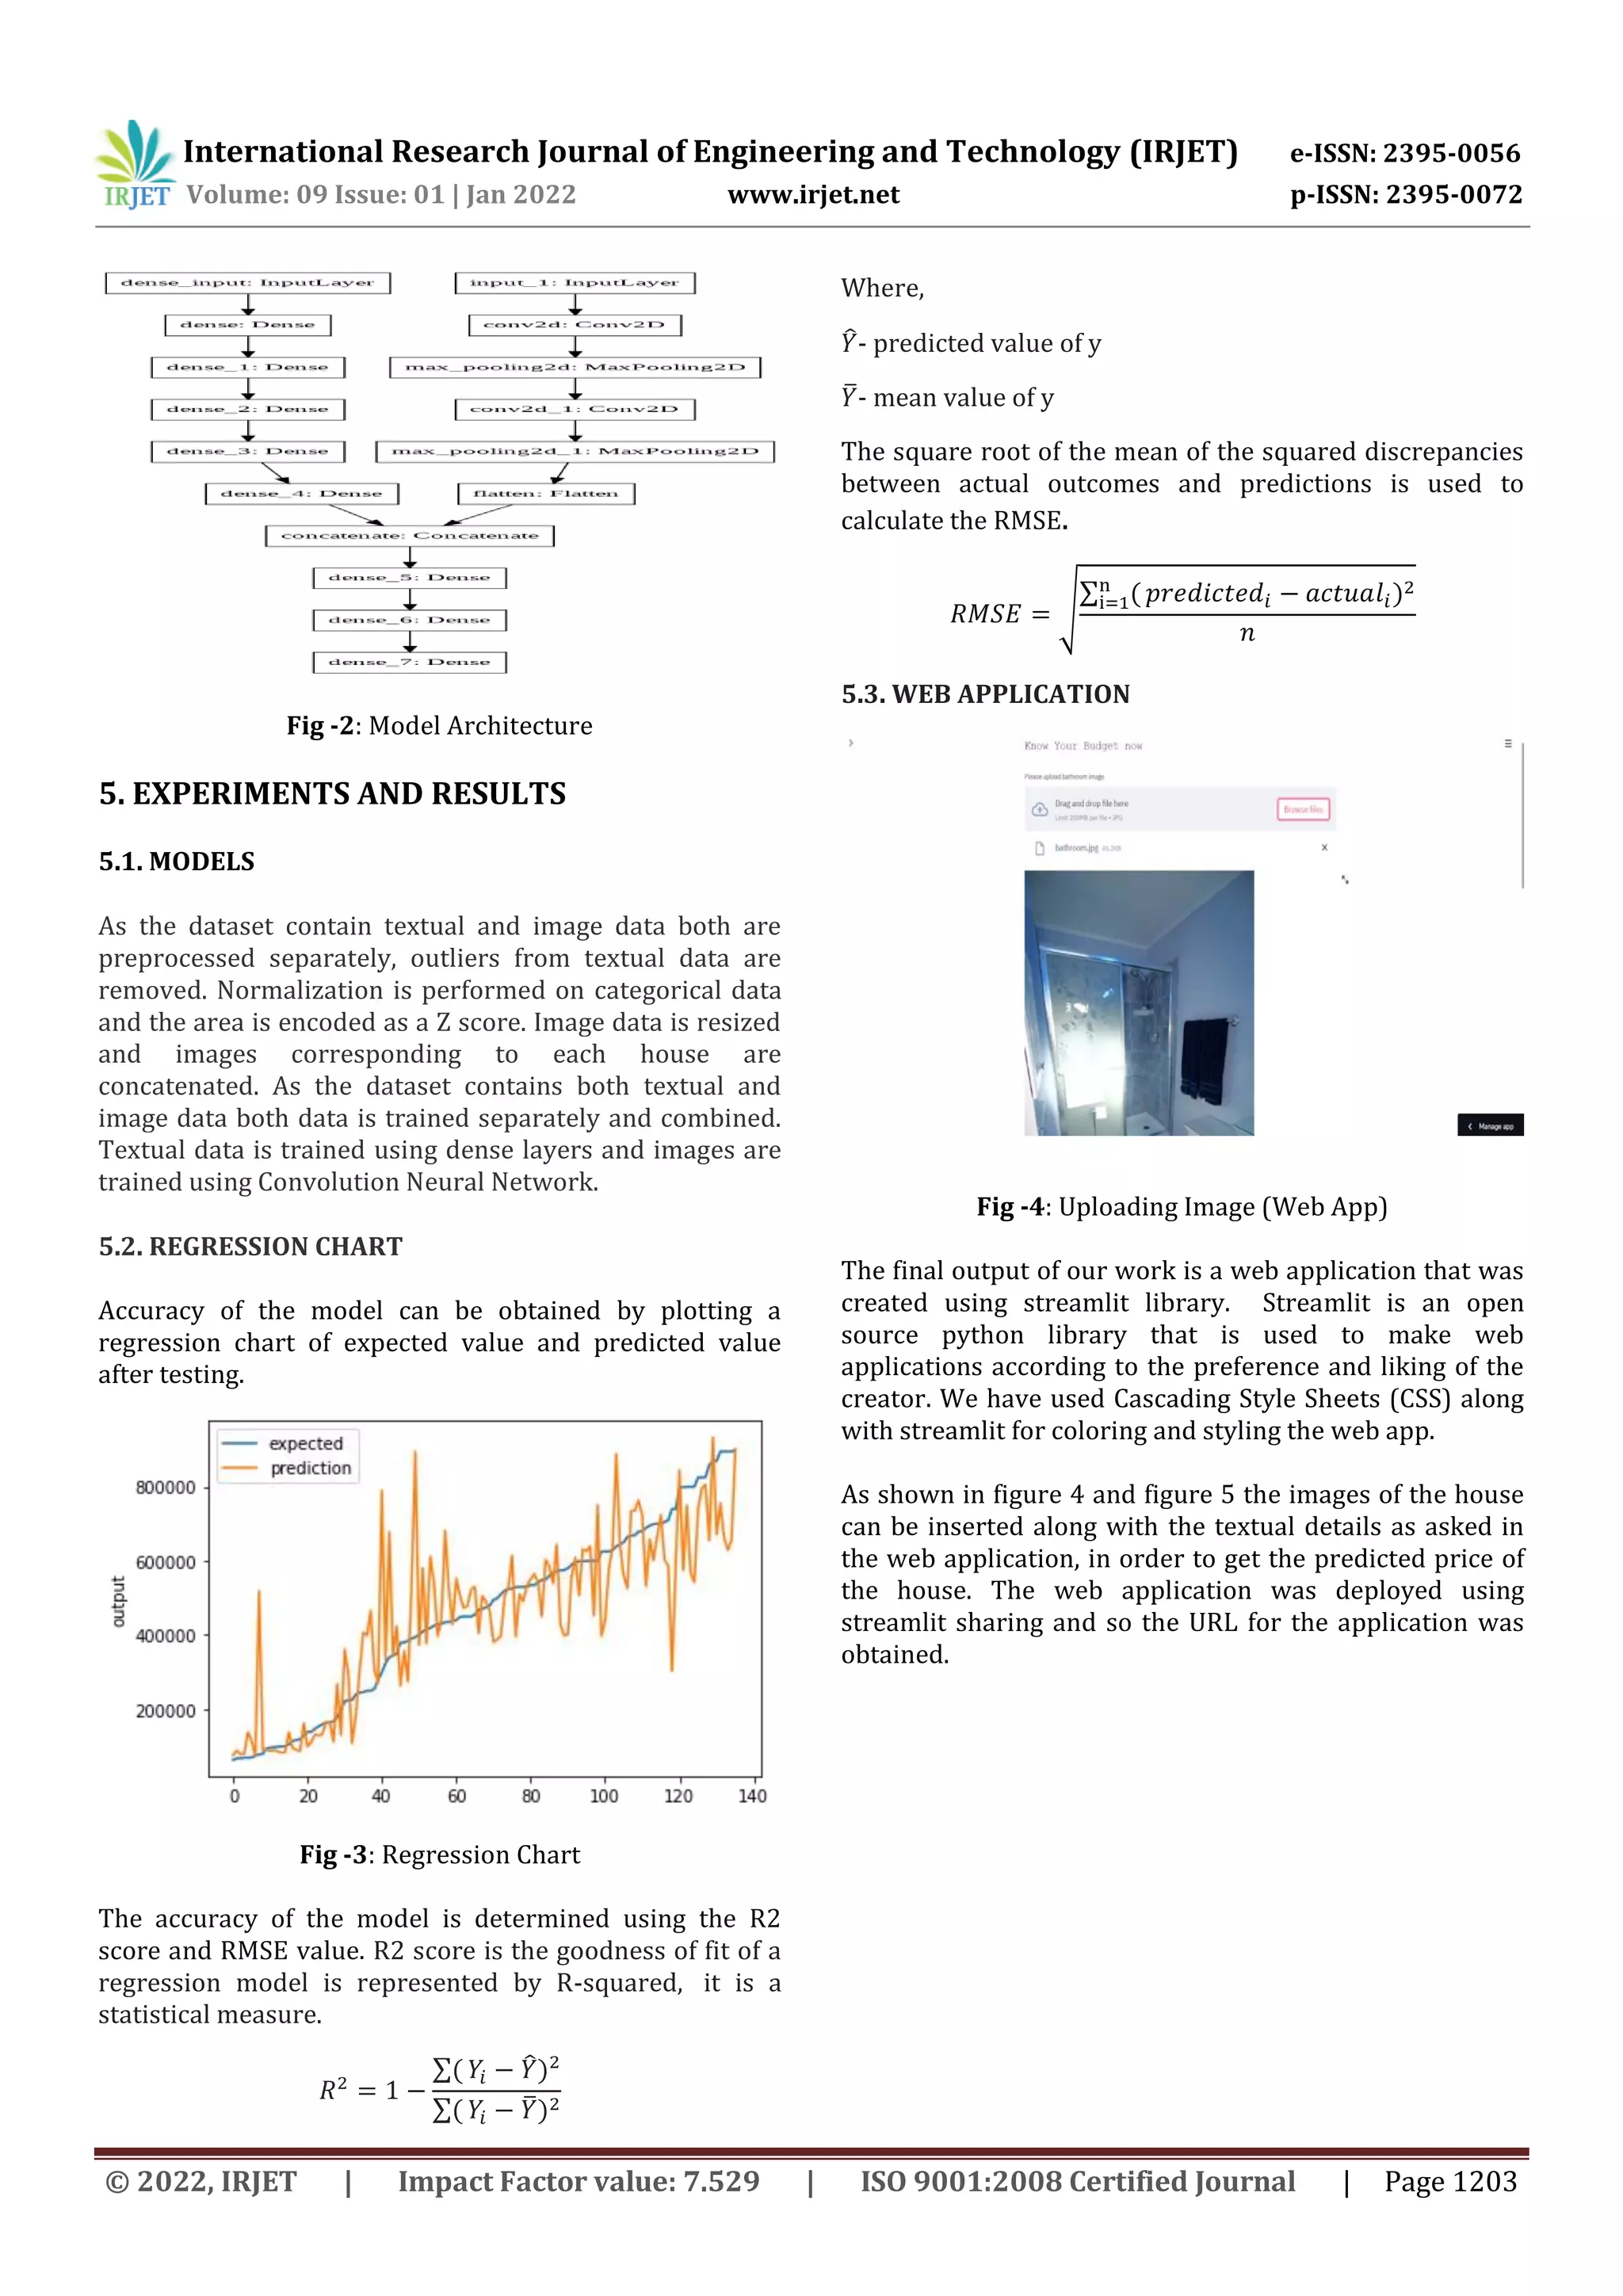
The architecture of the model is as shown in figure-2.
Textual data is passed through four dense layers and this
is how input model 1 is formed. Image data is passed
through convolution layers (Conv2D) twice and max-
pooled each time. After flattening input model 2 is
obtained. Both input model1 and model 2 are
concatenated and passed through three more dense layers
to obtain the final model of our research work to predict
the price of the house.](https://image.slidesharecdn.com/irjet-v9i1213-220912083154-1c7ff7d2/75/Web-Application-for-House-Price-Prediction-2-2048.jpg)
![International Research Journal of Engineering and Technology (IRJET) e-ISSN: 2395-0056
Volume: 09 Issue: 01 | Jan 2022 www.irjet.net p-ISSN: 2395-0072
© 2022, IRJET | Impact Factor value: 7.529 | ISO 9001:2008 Certified Journal | Page 1204
Fig -5: Entering textual inputs (Web app)
6. CONCLUSION
The objective was to create a system that would assist
individuals in managing their finances in order to build
their dream house. The ultimate result is a user-friendly
web application that assists any group of people in
estimating the value of their house by uploading images
and textual data. The CNN assisted in the development of
an accurate model. This is the first paper, to our
knowledge, to have provided a web application for the
purpose of predicting the price of the house. This may also
be utilized in real estate and for other applications. In the
future we can alter the dataset to improve the model by
adding more zipcodes and other attributes.
REFERENCES
[1] Take a look around using street view and satellite
images to estimate house prices, Stephen law, brooks
Paige, Chris Russel, arXiv:1807.07155v2[econ.EM] 21
Oct 2019
[2] House price forecasting using data mining technique,
Atharva chogle, Priyanka khaire, Akshata gaud, Jinal
Jain,ISO 3297:2007 Certified Vol. 6, Issue 12,
December 2017
[3] House price estimation from visual and textual
featuresEmanAhmed,MohammedMustafa,DOI:
10.5220/0006040700620068 In Proceedings of the
8th International Joint Conference on Computational
Intelligence (IJCCI 2016), ISBN: 978-989-758-201-1
[4] Implementation of House Price Prediction Model
Using Image Processing and Machine Learning by
Gaikwad Purva Chandrakant, Ganjave Pratiksha
Namdev, Gorade Pooja Subhash, S. S. Gore, ISSN
(Online): ISSN (Online): 2581-5792, Volume-2, Issue-
11, November-2019
[5] https://streamlit.io/
[6] https://share.streamlit.io/
[7] https://www.kaggle.com/amir22010/house-price-
estimation-from-image-and-text-feature/data
[8] https://machinelearningknowledge.ai/keras-dense-
layer-explained-for-beginners/](https://image.slidesharecdn.com/irjet-v9i1213-220912083154-1c7ff7d2/75/Web-Application-for-House-Price-Prediction-4-2048.jpg)

This document describes a web application created to predict house prices using both textual and visual features of a home. The application uses two machine learning models - one trained on textual data like number of bedrooms and one trained on image data using CNN. The models are merged to make predictions. The frontend was built with Streamlit allowing users to enter home details and get price predictions without expertise. The goal was to make such a tool accessible to all through a user-friendly web interface.