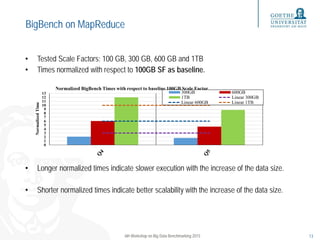
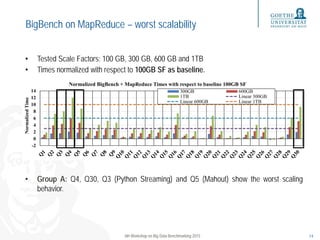
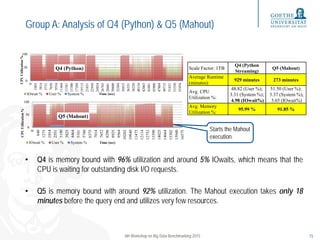
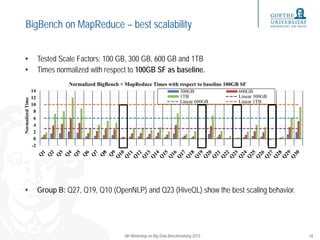
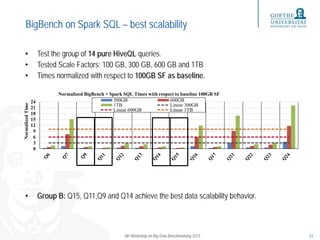
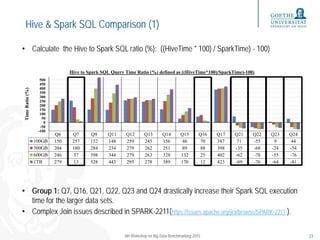
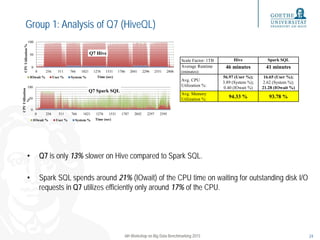
This document evaluates the performance of Spark SQL using the BigBench benchmarking framework, comparing it to MapReduce and Hive. It discusses the scalability of various queries, provides insights into the configuration of the testing cluster, and examines the findings from running BigBench on Spark and MapReduce. Ultimately, it highlights that Spark SQL performs faster than Hive for stable queries, though some Spark SQL queries show scalability issues due to potential join optimization problems.
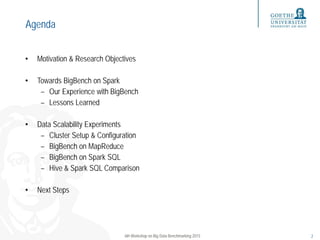
![Our Experience with BigBench
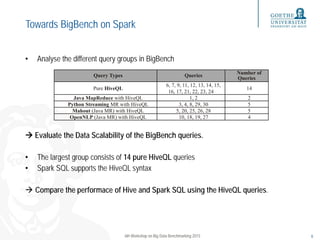
• Validating the Spark SQL query results
– Empty query results
– Non-deterministic end results (OpenNLP and Mahout)
– No reference results are available
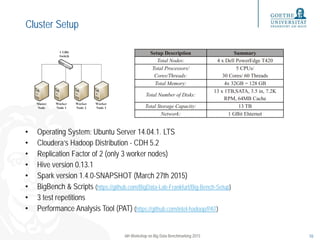
• BigBench Setup: https://github.com/BigData-Lab-Frankfurt/Big-Bench-Setup
– Executing single or subset of queries
– Gather execution times, row counts and sample values from result tables
6th Workshop on Big Data Benchmarking 2015 8
Query #
Row Count
SF 100
Row Count
SF 300
Row Count
SF 600
Row Count
SF 1000
Sample Row
Q1 0 0 0 0
Q2 1288 1837 1812 1669 1415 41 1
Q3 131 426 887 1415 20 5809 1
Q4 73926146 233959972 468803001 795252823 0_1199 1
Q5 logRegResult.txt
AUC = 0.50 confusion: [[0.0, 0.0],
[1.0, 3129856.0]] entropy: [[-0.7, -
0.7], [-0.7, -0.7]]
… … …](https://image.slidesharecdn.com/wbdb2015bigbenchsparksql-150810140324-lva1-app6892/85/WBDB-2015-Performance-Evaluation-of-Spark-SQL-using-BigBench-8-320.jpg)