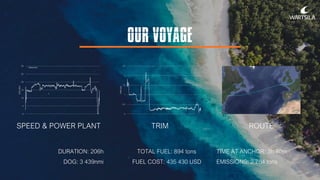
UNLEASHING THE POTENTIAL OF DIGITAL TECHNOLOGIES
Computing
Power
Connectivity Automation
Connected
Devices
THREE MAIN INDUSTRY CHANGE DRIVERS
Resource
utilization
Climate impact Safety
The industry will go through a digital transformation
WE WILL LEAD THIS TRANSFORMATION
WÄRTSILÄ LEGACY
Unrivalled
installed base
World’s widest
product portfolio
Ecosystem
know-how
NEW COMPETENCIES
Analytics, situational awareness, sensors, software
engineering, cloud platform, simulation, presence in ports
... and a new mindset
ENIRAM
Voyage efficiency
Asset efficiency
Insight Factory: dynamic energy models
GUIDANCE MARINE
Real-time position measurement technologies
Situational awareness
TRANSAS
Beyond the vessel:
fleet operation centres, training academies
and ship traffic control
TURNING THE VISION INTO REALITY
TO ADDRESS INDUSTRY INEFFICIENCIES
Fleet-wide annualized
voyage cost waste of
14 500 MEUR from
inefficient fuel usage
Active vessels spend 35% of
time at port operations.
14% could be eliminated
through just in time arrival
An example in containership business
Source: McKinsey
JOURNEY OVERVIEW
5900 TEU VESSEL SAILING FROM
ROTTERDAM TO NEW YORK*
Source: Wärtsilä Simulation
CHAPTER 1
ENHANCING
HUMAN
EXPERIENCE WITH
DATA ANALYTICS
CHAPTER 2
CONTINUOUS
MONITORING AND
OPTIMISATION
CONNECTED
ECOSYSTEM
CHAPTER 3
FROM RAW DATA
TO VALUE
GENERATING
INSIGHTS
CHAPTER 4
CHAPTER 1
ENHANCING HUMAN EXPERIENCE
WITH DATA ANALYTICS
VOYAGE PLANNING
FROM CAPTAIN EXPERIENCE
A B
Route planning based on personal expertise
and past voyages or standard industry tools
TO ADVANCED INTELLIGENT
ROUTING (AIR)
Automatic voyage planning based on
meteocean data, traffic schemes, regulations
and energy efficiency A B
CHAPTER 2
CONTINUOUS MONITORING AND OPTIMISATION
DEEP SEA
FROM STATIC TABLES
Manual adjustments not considering
changing environmental conditions
TO TRIM OPTIMISATION
Based on specific vessel hydrodynamics
and real-time measured movements
CHAPTER 3
CONNECTED ECOSYSTEM
APPROACHING THE DESTINATION PORT
FROM UNCOORDINATED
NAVIGATION TO COLLABORATIVE
ECOSYSTEM
Inefficient information sharing leading to
non-optimal speed and waiting time at anchor
CHAPTER 4
POST VOYAGE
FROM RAW DATA
TO VALUE GENERATING INSIGHTS
FROM OVERLOOKED VOYAGE
No transparent information of crew
and ship performance
TO VOYAGE BENCHMARKING
Continuous improvemen through
post-voyage energy diagnostics
SAVINGS POTENTIAL
CONCLUSIONS
IN NUMBERS*
Source: Wärtsilä Simulation
OUR VOYAGE
TIME AT ANCHOR: 3h 40m
EMISSIONS: 2 784 tons
DURATION: 206h
DOG: 3 439nmi
TOTAL FUEL: 894 tons
FUEL COST: 435 430 USD
TRIMSPEED & POWER PLANT ROUTE
0
5
10
15
20
25
30
SOG(KN)
0
0,5
1
1,5
2
2,5
TRIM(M)
– Measured
OUR VOYAGE
0
0,5
1
1,5
2
2,5
TRIM(M)
TRIM
-2.1%
SPEED & POWER PLANT
-7.1%
ROUTE
-2.7%
0
5
10
15
20
25
30
SOG(KN)
– Measured
– Optimum
OUR VOYAGE
12.1% energy saved
53 000 €
Annual 1 430 000 €
340 T CO2
Annual 9 200 t
110 T FUEL
Annual 2 930 t
DISRUPTIVE POTENTIAL
Just-in-time arrival at port of Singapore
160 000 000 €
fuel bill savings
1 600 000 T
CO2 emissions cut
SAFETY
thanks to reduced
congestion
540 000 T
fuel reduction
CHALLENGES AND RESPONSES
Bundled solutions with connectivity
Shared benefits across stakeholders
Partnerships to build critical mass
Driving ahead of regulatory bodies
Conversion packages
Connectivity and cybersecurity
Entrenched practices
Fragmentation and conflicting priorities
Lack of standards and regulations
Asset lifetime
ROAD TO ECOSYSTEM SOLUTIONS MINDSET
1. Transformation in the marketplace
2. Transformation in business development
3. Expertise in end-to-end solutions
Wartsila smart voyage_optimisation_overview

Wartsila smart voyage_optimisation_overview