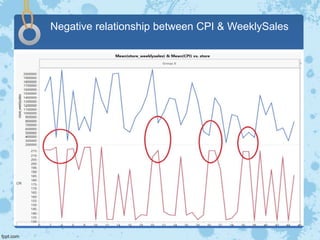
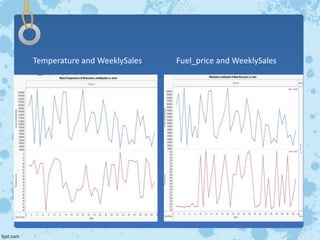
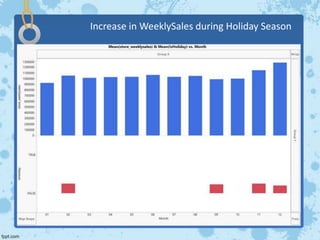
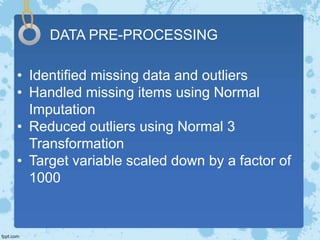
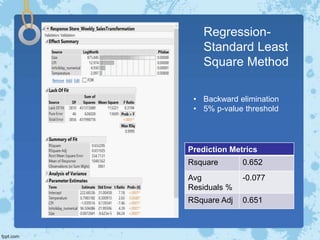
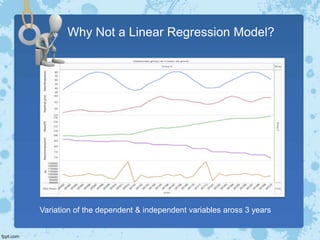
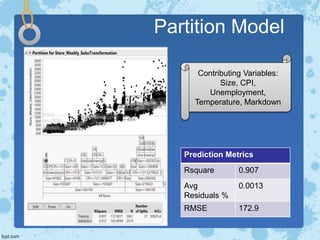
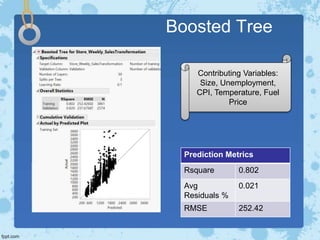
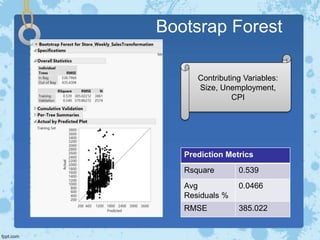
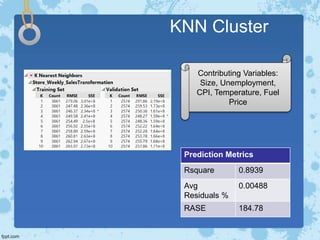
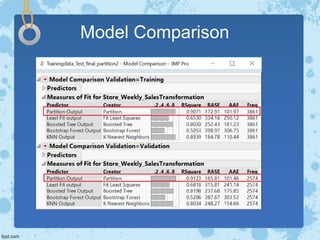
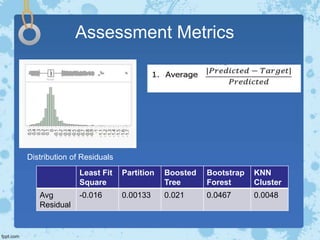
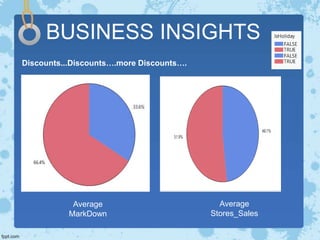
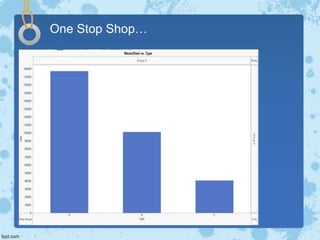
Retail
Data
Analytics
Team 5:
Saiviveka Murali
Shweta Ikhe
Swaraj Machiraju
Bidisha Datta
Problem Statement
The objective is to predict the weekly sales of a Retail
Store looking at previous years performance per Store
on a weekly basis.
To analyze how internal and external factors can affect
the Weekly Sales in the future.
To Provide recommended actions based on the
insights drawn, with prioritization placed on largest
business impact
Phases Of SEMMA
Sample
Explore
Modify
Model
Assess
•Explored various relationships
between the variables
• Selected the retail data set
•Transformed variables
for data modeling
• Applied various modeling
• Evaluation of the modeling
SAMPLING
Size
Temperature
Fuel price
CPI
Is Holiday
Markdown
Unemployment
Store
Weekly
Sales
DATA
EXPLORATION
Collinearity: Size and Type
Size vs WeeklySales
Negative relationship between CPI & WeeklySales
Temperature and WeeklySales Fuel_price and WeeklySales
Increase in WeeklySales during Holiday Season
DATA
PRE-PROCESSING
• Identified missing data and outliers
• Handled missing items using Normal
Imputation
• Reduced outliers using Normal 3
Transformation
• Target variable scaled down by a factor of
1000
DATA PRE-PROCESSING
DATA
MODELING
Regression-
Standard Least
Square Method
• Backward elimination
• 5% p-value threshold
Prediction Metrics
Rsquare 0.652
Avg
Residuals %
-0.077
RSquare Adj 0.651
Why Not a Linear Regression Model?
Variation of the dependent & independent variables aross 3 years
Partition Model
Prediction Metrics
Rsquare 0.907
Avg
Residuals %
0.0013
RMSE 172.9
Contributing Variables:
Size, CPI,
Unemployment,
Temperature, Markdown
Boosted Tree
Prediction Metrics
Rsquare 0.802
Avg
Residuals %
0.021
RMSE 252.42
Contributing Variables:
Size, Unemployment,
CPI, Temperature, Fuel
Price
Bootsrap Forest
Prediction Metrics
Rsquare 0.539
Avg
Residuals %
0.0466
RMSE 385.022
Contributing Variables:
Size, Unemployment,
CPI
KNN Cluster
Prediction Metrics
Rsquare 0.8939
Avg
Residuals %
0.00488
RASE 184.78
Contributing Variables:
Size, Unemployment,
CPI, Temperature, Fuel
Price
MODEL
EVALUATION
AND
ASSESSMENT
Model Comparison
Assessment Metrics
Least Fit
Square
Partition Boosted
Tree
Bootstrap
Forest
KNN
Cluster
Avg
Residual
-0.016 0.00133 0.021 0.0467 0.0048
Distribution of Residuals
BUSINESS INSIGHTS
Discounts...Discounts….more Discounts….
Average
MarkDown
Average
Stores_Sales
One Stop Shop…
What Next…
Impact of fuel price on sales on a weekly basis with help of
indicators such as distance of consumer from the stores
Geographical co-ordinates of the store which can help analyze the
impact of temperature on consumer purchase patterns
Extend the exploration to market basket analysis using additional
indicators such as products/consumer goods, departments and
previous and current orders of consumers
Questions???

Walmart Sales Prediction