Gta office market statistics q3 2011
•
0 likes•421 views

commercial real estate toronto, office space, lease, colliers

Recommended
Recommended
More Related Content
What's hot
What's hot (17)
Viewers also liked
Viewers also liked (20)
Similar to Gta office market statistics q3 2011
Similar to Gta office market statistics q3 2011 (20)
More from Chris Fyvie
More from Chris Fyvie (20)
Recently uploaded
Recently uploaded (20)
Gta office market statistics q3 2011
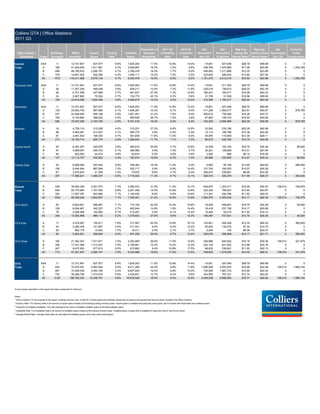
- 1. Colliers GTA | Office Statistics 2011 Q3 Proportion of 2011 Q3 2010 Q3 Net Net Wgt Avg. Wgt Avg. Net Currently Office Market / Buildings Office Vacant Vacancy Available Sublease Availability Availability Absorption Absorption Asking Net Asking Gross New Supply Under 1 2 3 5 Submarket Class Surveyed Inventory Space Rate Space Availability Rate Rate 2011 Q3 12 Months Rental Rates Rental Rates 2011 Q3 Construction Central AAA 11 12,721,647 837,977 6.6% 1,625,203 11.5% 12.8% 14.4% -15,601 527,046 $28.79 $59.98 0 0 Total: A 186 41,923,046 1,811,981 4.3% 3,028,687 16.3% 7.2% 9.8% 446,764 1,970,560 $17.26 $33.95 0 1,253,765 B 498 49,165,632 2,295,791 4.7% 3,786,478 18.2% 7.7% 8.5% 406,652 1,217,889 $12.03 $23.89 0 0 C 378 14,601,363 630,385 4.3% 1,090,111 19.2% 7.5% 5.5% 323,654 496,524 $13.82 $27.06 0 0 All 1073 118,411,688 5,576,134 4.7% 9,530,478 16.6% 8.0% 9.2% 1,161,470 4,212,018 $16.93 $33.98 0 1,253,765 Financial Core AAA 11 12,721,647 837,977 6.6% 1,625,203 11.5% 12.8% 14.4% -15,601 211,352 $28.79 $59.98 0 0 A 26 11,547,249 446,438 3.9% 838,211 10.4% 7.3% 11.9% 226,016 736,610 $26.20 $52.39 0 0 B 48 6,741,508 247,868 3.7% 491,627 27.5% 7.3% 10.9% 180,431 180,917 $19.09 $40.03 0 0 C 24 2,607,862 70,024 2.7% 134,775 45.1% 5.2% 5.8% 21,709 31,538 $18.56 $38.64 0 0 All 109 33,618,266 1,602,308 4.8% 3,089,815 15.2% 9.2% 12.0% 412,555 1,160,417 $26.44 $54.48 0 0 Downtown AAA 11 12,721,647 837,977 6.6% 1,625,203 11.5% 12.8% 14.4% -15,601 527,046 $28.79 $59.98 0 0 A 109 24,604,745 997,965 4.1% 1,648,287 10.2% 6.7% 9.4% 411,206 1,583,017 $23.61 $45.67 0 878,765 B 237 24,959,950 949,186 3.8% 1,901,401 31.4% 7.6% 8.4% 260,614 738,089 $18.26 $34.37 0 0 C 169 8,140,684 368,022 4.5% 586,628 26.7% 7.2% 3.8% 67,983 146,733 $16.93 $30.90 0 0 All 526 70,427,026 3,153,150 4.5% 5,761,518 19.2% 8.2% 9.2% 724,202 2,994,885 $23.09 $45.56 0 878,765 Midtown A 18 4,729,110 215,938 4.6% 313,221 27.2% 6.6% 10.5% 23,083 230,186 $20.28 $40.98 0 0 B 98 9,993,081 413,307 4.1% 595,775 3.6% 6.0% 5.3% 12,114 189,768 $15.38 $34.26 0 0 C 97 3,461,523 196,530 5.7% 381,838 11.8% 11.0% 8.0% 44,876 110,809 $13.30 $29.11 0 0 All 213 18,183,714 825,775 4.5% 1,290,834 11.7% 7.1% 7.2% 80,072 530,763 $15.75 $34.08 0 0 Central North A 25 6,381,097 240,676 3.8% 360,815 30.9% 5.7% 10.8% 14,538 102,162 $16.76 $36.49 0 95,000 B 57 4,808,057 245,753 5.1% 356,585 4.9% 7.4% 3.7% 32,221 129,829 $13.51 $27.84 0 0 C 45 923,553 44,474 4.8% 45,674 0.0% 4.9% 4.5% 3,926 -998 $9.14 $16.50 0 0 All 127 12,112,707 530,902 4.4% 763,074 16.9% 6.3% 7.5% 50,686 230,993 $14.47 $30.43 0 95,000 Central East A 34 6,208,094 357,402 5.8% 706,364 18.3% 11.4% 9.3% -2,063 55,194 $13.65 $29.60 0 280,000 B 106 9,404,544 687,546 7.3% 932,717 5.9% 9.9% 14.4% 101,704 160,203 $10.97 $24.26 0 0 C 67 2,075,603 21,359 1.0% 75,972 9.6% 3.7% 9.3% 206,870 239,981 $8.89 $24.09 0 0 All 207 17,688,241 1,066,307 6.0% 1,715,052 11.2% 9.7% 12.1% 306,510 455,378 $11.89 $26.27 0 280,000 Suburb A 239 30,652,345 2,251,573 7.3% 3,382,574 31.5% 11.0% 14.1% 649,875 1,323,411 $16.00 $30.03 138,014 726,979 Total: B 459 25,770,904 1,757,394 6.8% 2,821,346 14.0% 10.9% 12.8% 323,354 769,327 $13.44 $24.87 0 0 C 354 11,927,397 843,690 7.1% 1,145,530 8.6% 9.6% 15.6% 111,341 290,796 $11.83 $20.03 0 0 All 1052 68,350,646 4,852,657 7.1% 7,349,451 21.2% 10.8% 13.9% 1,084,570 2,383,534 $14.17 $26.06 138,014 726,979 GTA North A 62 6,823,941 486,891 7.1% 712,102 42.2% 10.4% 16.9% 79,205 458,681 $16.79 $30.26 0 45,000 B 109 6,054,461 342,237 5.7% 453,044 14.9% 7.5% 14.4% 16,418 237,136 $14.17 $25.69 0 0 C 78 2,626,566 150,982 5.7% 213,457 5.9% 8.1% 13.4% 10,464 52,015 $11.65 $19.14 0 0 All 249 15,504,968 980,110 6.3% 1,378,603 27.6% 8.9% 15.3% 106,087 747,831 $14.74 $26.26 0 45,000 GTA East A 17 2,476,097 192,811 7.8% 317,407 44.5% 12.8% 16.1% 143,801 224,329 $12.32 $26.20 0 360,000 B 44 2,285,355 101,897 4.5% 211,441 9.4% 9.3% 12.4% 83,834 130,270 $7.04 $14.70 0 0 C 29 863,179 15,093 1.7% 18,411 0.0% 2.1% 3.7% 2,245 -145 $9.09 $24.57 0 0 All 90 5,624,631 309,800 5.5% 547,259 29.5% 9.7% 12.6% 229,879 356,699 $10.17 $21.71 0 360,000 GTA West A 160 21,352,307 1,571,871 7.4% 2,353,065 26.6% 11.0% 12.9% 426,869 640,402 $16.18 $30.36 138,014 321,979 B 306 17,431,088 1,313,261 7.5% 2,156,861 14.3% 12.4% 12.4% 223,103 401,922 $13.96 $25.76 0 0 C 247 8,437,652 677,615 8.0% 913,662 9.4% 10.8% 17.5% 98,632 236,681 $11.93 $20.15 0 0 All 713 47,221,047 3,562,747 7.5% 5,423,589 18.8% 11.5% 13.5% 748,603 1,279,005 $14.45 $26.51 138,014 321,979 GTA AAA 11 12,721,647 837,977 6.6% 1,625,203 11.5% 12.8% 14.4% -15,601 527,046 $28.79 $59.98 0 0 Total: A 425 72,575,391 4,063,554 5.6% 6,411,260 24.3% 8.8% 11.6% 1,096,639 3,293,970 $16.66 $32.08 138,014 1,980,744 B 957 74,936,536 4,053,185 5.4% 6,607,825 16.4% 8.8% 10.0% 730,006 1,987,216 $12.65 $24.32 0 0 C 732 26,528,760 1,474,075 5.6% 2,235,641 13.7% 8.4% 9.8% 434,995 787,321 $12.74 $23.24 0 0 All 2125 186,762,334 10,428,791 5.6% 16,879,929 18.6% 9.0% 10.9% 2,246,039 6,595,553 $15.77 $30.64 138,014 1,980,744 Survey results presented on this report have been condensed for reference. Notes: 1 Office Inventory: For the purpose of this report, buildings with less than 10,000 SF of office space and buildings owned and occupied by the government have not been included in the office inventory. 2 Vacancy Rate: The Vacancy Rate is the amount of vacant space divided by the existing building inventory base. Vacant space is available and physically unoccupied, and it includes both head lease and sublease space. 3 Proportion of sublease availability: This ratio represents the share of available sublease space of the total available space. 4 Availability Rate: The Availability Rate is the amount of available space divided by the building inventory base. Available space is space that is available for lease and may or may not be vacant. 5 Average Rental Rates: Average rental rates are calculated off available spaces which also quote rental figures.
- 2. Colliers Downtown | Office Statistics 2011 Q3 Proportion of 2011 Q3 2010 Q3 Net Net Wgt Avg. Wgt Avg. Net Currently Office Market / Buildings Office Vacant Vacancy Available Sublease Availability Availability Absorption Absorption Asking Net Asking Gross New Supply Under 1 2 Submarket Class Surveyed Inventory Space Rate Space Availability3 Rate Rate 2011 Q3 12 Months 5 Rental Rates Rental Rates 2011 Q3 Construction Financial Core AAA 11 12,721,647 837,977 6.6% 1,625,203 11.5% 12.8% 14.4% -15,601 527,046 $28.79 $59.98 0 0 A 26 11,547,249 446,438 3.9% 838,211 10.4% 7.3% 11.9% 226,016 789,390 $26.20 $52.39 0 0 B 48 6,741,508 247,868 3.7% 491,627 27.5% 7.3% 10.9% 180,431 440,289 $19.09 $40.03 0 0 C 24 2,607,862 70,024 2.7% 134,775 45.1% 5.2% 5.8% 21,709 67,291 $18.56 $38.64 0 0 All 109 33,618,266 1,602,308 4.8% 3,089,815 15.2% 9.2% 12.0% 412,555 1,824,016 $26.44 $54.48 0 0 Downtown East A 22 1,099,753 60,817 5.5% 62,524 47.9% 5.7% 5.6% 5,450 -91 $16.77 $35.92 0 0 B 52 1,911,227 90,124 4.7% 179,064 7.7% 9.4% 13.2% 38,840 127,619 $19.36 $29.73 0 0 C 37 930,064 96,891 10.4% 162,861 7.5% 17.5% 17.5% 11,960 81,172 $17.53 $25.47 0 0 All 111 3,941,044 247,833 6.3% 404,448 13.8% 10.3% 12.1% 56,250 208,700 $18.32 $28.46 0 0 Downtown North A 13 5,641,211 215,591 3.8% 288,222 0.0% 5.1% 5.2% 66,340 163,789 $23.00 $43.02 0 0 B 28 6,490,471 123,139 1.9% 275,917 16.0% 4.3% 3.7% 70,763 83,993 $17.69 $37.34 0 0 C 33 2,595,629 102,535 4.0% 123,876 2.7% 4.8% 5.7% 17,119 -24,209 $16.94 $35.92 0 0 All 74 14,727,311 441,265 3.0% 688,015 6.9% 4.7% 4.6% 154,223 223,573 $19.94 $39.63 0 0 Downtown South A 6 2,270,654 45,925 2.0% 55,536 23.3% 2.4% 4.8% 126,674 427,906 $31.00 $53.90 0 878,765 B 5 1,271,110 116,483 9.2% 267,753 79.5% 21.1% 13.0% 11,354 -34,607 $15.00 $29.23 0 0 C 7 273,699 56,840 20.8% 56,840 100.0% 20.8% 6.1% 0 -56,840 $13.25 $18.82 0 0 All 18 3,815,463 219,249 5.7% 380,129 74.3% 10.0% 8.1% 138,028 336,459 $21.98 $40.00 0 878,765 Downtown West A 42 4,045,878 229,193 5.7% 403,794 9.4% 10.0% 11.2% -13,274 202,023 $18.51 $33.88 0 0 B 104 8,545,634 371,571 4.3% 687,041 27.7% 8.0% 8.8% -40,775 120,794 $17.93 $31.05 0 0 C 68 1,733,430 41,732 2.4% 108,276 22.0% 6.2% 8.0% 17,195 79,320 $14.42 $26.63 0 0 All 214 14,324,942 642,496 4.5% 1,199,111 21.1% 8.4% 9.4% -36,855 402,137 $17.84 $31.75 0 0 Downtown AAA 11 12,721,647 837,977 6.6% 1,625,203 11.5% 12.8% 14.4% -15,601 527,046 $28.79 $59.98 0 0 Total: A 109 24,604,745 997,965 4.1% 1,648,287 10.2% 6.7% 9.4% 411,206 1,583,017 $23.61 $45.67 0 878,765 B 237 24,959,950 949,186 3.8% 1,901,401 31.4% 7.6% 8.4% 260,614 738,089 $18.26 $34.37 0 0 C 169 8,140,684 368,022 4.5% 586,628 26.7% 7.2% 7.4% 67,983 146,733 $16.93 $30.90 0 0 All 526 70,427,026 3,153,150 4.5% 5,761,518 19.2% 8.2% 9.7% 724,202 2,994,885 $23.09 $45.56 0 878,765 Survey results presented on this report have been condensed for reference. Notes: 1 Office Inventory: For the purpose of this report, buildings with less than 10,000 SF of office space and buildings owned and occupied by the government have not been included in the office inventory. 2 Vacancy Rate: The Vacancy Rate is the amount of vacant space divided by the existing building inventory base. Vacant space is available and physically unoccupied, and it includes both head lease and sublease space. 3 Proportion of Sublease Availability: This ratio represents the share of available sublease space of the total available space. 4 Availability Rate: The Availability Rate is the amount of available space divided by the building inventory base. Available space is space that is available for lease and may or may not be vacant. 5 Average Rental Rates: Average rental rates are calculated off available spaces which also quote rental figures.
- 3. Colliers Midtown | Office Statistics 2011 Q3 Proportion of 2011 Q3 2010 Q3 Net Net Wgt Avg. Wgt Avg. Net Currently Office Market / Buildings Office Vacant Vacancy Available Sublease Availability Availability Absorption Absorption Asking Net Asking Gross New Supply Under 1 2 3 5 Submarket Class Surveyed Inventory Space Rate Space Availability Rate Rate 2011 Q3 12 Months Rental Rates Rental Rates 2011 Q3 Construction Yonge-Bloor A 8 2,622,554 149,846 5.7% 189,679 28.6% 7.2% 9.1% -12,992 16,463 $22.64 $42.90 0 - B 37 5,583,452 117,139 2.1% 154,625 2.5% 2.8% 3.3% 4,304 115,055 $16.13 $36.81 0 - C 29 1,393,195 95,001 6.8% 193,541 20.9% 13.9% 13.0% 28,125 51,310 $12.79 $30.34 0 - All 74 9,599,201 361,986 3.8% 537,845 18.3% 5.6% 6.3% 19,437 182,828 $17.22 $36.63 0 - Yonge-St.Clair A 4 788,196 10,263 1.3% 37,531 31.1% 4.8% 8.4% 9,947 67,328 $19.08 $42.03 0 - B 19 1,586,172 110,319 7.0% 169,212 4.3% 10.7% 8.4% -2,374 654 $16.19 $34.63 0 - C 13 226,401 1,523 0.7% 2,323 0.0% 1.0% 1.7% 0 12,317 $17.12 $34.20 0 - All 36 2,600,769 122,105 4.7% 209,067 9.1% 8.0% 7.0% 7,573 80,299 $16.72 $35.95 0 - Yonge-Eglinton A 6 1,318,360 55,829 4.2% 86,011 22.4% 6.5% 14.5% 26,128 146,395 $15.98 $36.67 0 - B 28 2,535,072 161,164 6.4% 247,252 4.0% 9.8% 8.3% 8,288 55,907 $14.38 $32.61 0 - C 24 897,069 67,263 7.5% 145,996 3.1% 16.3% 6.9% 14,736 10,848 $14.68 $29.73 0 - All 58 4,750,501 284,256 6.0% 479,260 7.1% 10.1% 9.9% 49,152 213,149 $14.76 $32.46 0 - Toronto West A 0 0 0 0.0% 0 0.0% 0.0% 0.0% 0 0 $0.00 $0.00 0 - B 14 288,385 24,685 8.6% 24,685 0.0% 8.6% 2.4% 1,896 18,152 $15.00 $32.09 0 - C 31 944,858 32,743 3.5% 39,977 0.0% 4.2% 5.7% 2,015 36,334 $10.15 $21.92 0 - All 45 1,233,243 57,428 4.7% 64,662 0.0% 5.2% 5.0% 3,911 54,486 $12.00 $25.80 0 - Midtown A 18 4,729,110 215,938 4.6% 313,221 27.2% 6.6% 10.5% 23,083 230,186 $20.28 $40.98 0 - Total: B 98 9,993,081 413,307 4.1% 595,775 3.6% 6.0% 5.3% 12,114 189,768 $15.38 $34.26 0 - C 97 3,461,523 196,530 5.7% 381,838 11.8% 11.0% 8.0% 44,876 110,809 $13.30 $29.11 0 - All 213 18,183,714 825,775 4.5% 1,290,834 11.7% 7.1% 7.2% 80,072 530,763 $15.75 $34.08 0 - Survey results presented on this report have been condensed for reference. Notes: 1 Office Inventory: For the purpose of this report, buildings with less than 10,000 SF of office space and buildings owned and occupied by the government have not been included in the office inventory. 2 Vacancy Rate: The Vacancy Rate is the amount of vacant space divided by the existing building inventory base. Vacant space is available and physically unoccupied, and it includes both head lease and sublease space. 3 Proportion of Sublease Availability: This ratio represents the share of available sublease space of the total available space. 4 Availability Rate: The Availability Rate is the amount of available space divided by the building inventory base. Available space is space that is available for lease and may or may not be vacant. 5 Average Rental Rates: Average rental rates are calculated off available spaces which also quote rental figures.
- 4. Colliers Central North | Office Statistics 2011 Q3 Proportion of 2011 Q3 2010 Q3 Net Net Wgt Avg. Wgt Avg. Net Currently Office Market / Buildings Office Vacant Vacancy Available Sublease Availability Availability Absorption Absorption Asking Net Asking Gross New Supply Under 1 2 3 5 Submarket Class Surveyed Inventory Space Rate Space Availability Rate Rate 2011 Q3 12 Months Rental Rates Rental Rates 2011 Q3 Construction Yorkdale A 2 317,281 0 0.0% 0 0.0% 0.0% 0.0% 0 1,560 $0.00 $0.00 0 95,000 B 13 1,163,783 16,850 1.4% 31,625 0.0% 2.7% 2.2% -3,221 15,379 $11.72 $29.11 0 0 C 14 329,414 39,394 12.0% 39,394 0.0% 12.0% 12.3% 3,846 22,346 $9.00 $15.70 0 0 All 29 1,810,478 56,244 3.1% 71,019 0.0% 3.9% 3.5% 625 39,285 $10.21 $21.67 0 95,000 Dufferin Finch A 0 0 0 0.0% 0 0.0% 0.0% 0.0% 0 0 $0.00 $0.00 0 0 B 17 1,109,157 188,825 17.0% 194,457 0.0% 17.5% 2.4% 9,777 24,160 $11.88 $23.69 0 0 C 15 301,078 3,800 1.3% 5,000 0.0% 1.7% 1.0% 80 -4,720 $7.95 $18.09 0 0 All 32 1,410,235 192,625 13.7% 199,457 0.0% 14.1% 2.1% 9,857 19,440 $11.78 $23.55 0 0 North Yonge A 23 6,063,816 240,676 4.0% 360,815 30.9% 6.0% 11.4% 14,538 100,602 $16.76 $36.49 0 0 Corridor B 27 2,535,117 40,078 1.6% 130,503 13.5% 5.1% 5.0% 25,665 90,290 $16.83 $34.64 0 0 C 16 293,061 1,280 0.4% 1,280 0.0% 0.4% 0.0% 0 -18,624 $18.00 $35.00 0 0 All 66 8,891,994 282,033 3.2% 492,598 26.2% 5.5% 9.2% 40,203 172,267 $16.78 $36.00 0 0 Central North A 25 6,381,097 240,676 3.8% 360,815 30.9% 5.7% 10.8% 14,538 102,162 $16.76 $36.49 0 95,000 Area B 57 4,808,057 245,753 5.1% 356,585 4.9% 7.4% 3.7% 32,221 129,829 $13.51 $27.84 0 - Total: C 45 923,553 44,474 4.8% 45,674 0.0% 4.9% 4.5% 3,926 -998 $9.14 $16.50 0 - All 127 12,112,707 530,902 4.4% 763,074 16.9% 6.3% 7.5% 50,686 230,993 $14.47 $30.43 0 95,000 Survey results presented on this report have been condensed for reference. Notes: 1 Office Inventory: For the purpose of this report, buildings with less than 10,000 SF of office space and buildings owned and occupied by the government have not been included in the office inventory. 2 Vacancy Rate: The Vacancy Rate is the amount of vacant space divided by the existing building inventory base. Vacant space is available and physically unoccupied, and it includes both head lease and sublease space. 3 Proportion of Sublease Availability: This ratio represents the share of available sublease space of the total available space. 4 Availability Rate: The Availability Rate is the amount of available space divided by the building inventory base. Available space is space that is available for lease and may or may not be vacant. 5 Average Rental Rates: Average rental rates are calculated off available spaces which also quote rental figures.
- 5. Colliers Central East | Office Statistics 2011 Q3 Proportion of 2011 Q3 2010 Q3 Net Net Wgt Avg. Wgt Avg. Net Currently Office Market / Buildings Office Vacant Vacancy Available Sublease Availability Availability Absorption Absorption Asking Net Asking Gross New Supply Under 1 2 3 5 Submarket Class Surveyed Inventory Space Rate Space Availability Rate Rate 2011 Q3 12 Months Rental Rates Rental Rates 2011 Q3 Construction Don Mills - Eglinton A 6 1,082,940 19,959 1.8% 59,965 23.8% 5.5% 2.6% 0 78,605 $13.00 $29.36 0 0 B 38 3,788,141 247,030 6.5% 311,336 5.4% 8.2% 19.1% 34,431 -37,793 $10.71 $24.48 0 0 C 23 518,322 0 0.0% 25,890 0.0% 5.0% 6.4% 450 26,929 $0.00 $25.00 0 0 All 67 5,389,403 266,989 5.0% 397,190 7.8% 7.4% 14.7% 34,881 67,742 $11.08 $25.25 0 0 Duncan Mill A 3 528,307 9,917 1.9% 13,321 22.5% 2.5% 6.7% -6,083 6,150 $14.00 $28.46 0 0 B 21 1,430,763 122,605 8.6% 145,757 14.6% 10.2% 3.7% 28,498 60,766 $9.71 $22.62 0 0 C 15 374,146 1,560 0.4% 6,920 0.0% 1.8% 17.3% 54,840 54,247 $12.00 $26.38 0 0 All 39 2,333,216 134,082 5.7% 165,998 14.6% 7.1% 6.6% 77,255 121,163 $10.15 $23.25 0 0 Consumer Road A 6 1,302,553 151,888 11.7% 228,871 0.0% 17.6% 14.3% -53,523 -58,395 $14.03 $31.29 0 0 B 16 1,972,881 246,774 12.5% 345,714 3.4% 17.5% 20.2% -22,153 -2,190 $11.96 $26.50 0 0 C 8 473,993 8,949 1.9% 31,912 22.8% 6.7% 11.3% 47,648 47,923 $8.63 $24.25 0 0 All 30 3,749,427 407,610 10.9% 606,496 3.1% 16.2% 17.1% -28,028 -12,663 $12.57 $28.19 0 0 Woodbine Steeles A 16 3,028,644 175,639 5.8% 404,207 27.7% 13.3% 10.8% 57,543 28,834 $13.44 $28.35 0 280,000 B 19 1,340,827 71,137 5.3% 99,910 4.9% 7.5% 9.0% 59,185 106,015 $10.21 $20.59 0 0 C 15 391,131 3,800 1.0% 4,200 0.0% 1.1% 3.0% 1,800 800 $8.50 $19.40 0 0 All 50 4,760,602 250,576 5.3% 508,317 23.0% 10.7% 9.7% 118,528 135,650 $12.76 $26.75 0 280,000 Toronto East A 3 265,650 0 0.0% 0 0.0% 0.0% 0.0% 0 0 $0.00 $0.00 0 0 B 12 871,932 0 0.0% 30,000 0.0% 3.4% 6.9% 1,743 33,404 $10.00 $15.55 0 0 C 6 318,011 7,050 2.2% 7,050 0.0% 2.2% 10.3% 102,132 110,082 $7.00 $20.70 0 0 All 21 1,455,593 7,050 0.5% 37,050 0.0% 2.5% 5.9% 103,875 143,486 $9.43 $16.53 0 0 Central East A 34 6,208,094 357,402 5.8% 706,364 18.3% 11.4% 9.3% -2,063 55,194 $13.65 $29.60 0 280,000 Area B 106 9,404,544 687,546 7.3% 932,717 5.9% 9.9% 14.4% 101,704 160,203 $10.97 $24.26 0 0 Total: C 67 2,075,603 21,359 1.0% 75,972 9.6% 3.7% 9.5% 206,870 239,981 $8.89 $24.09 0 0 All 207 17,688,241 1,066,307 6.0% 1,715,052 11.2% 9.7% 12.1% 306,510 455,378 $11.89 $26.27 0 280,000 Survey results presented on this report have been condensed for reference. Notes: 1 Office Inventory: For the purpose of this report, buildings with less than 10,000 SF of office space and buildings owned and occupied by the government have not been included in the office inventory. 2 Vacancy Rate: The Vacancy Rate is the amount of vacant space divided by the existing building inventory base. Vacant space is available and physically unoccupied, and it includes both head lease and sublease space. 3 Proportion of Sublease Availability: This ratio represents the share of available sublease space of the total available space. 4 Availability Rate: The Availability Rate is the amount of available space divided by the building inventory base. Available space is space that is available for lease and may or may not be vacant. 5 Average Rental Rates: Average rental rates are calculated off available spaces which also quote rental figures.
- 6. Colliers GTA North | Office Statistics 2011 Q3 Proportion of 2011 Q3 2010 Q3 Net Net Wgt Avg. Wgt Avg. Net Currently Office Market / Buildings Office Vacant Vacancy Available Sublease Availability Availability Absorption Absorption Asking Net Asking Gross New Supply Under 1 2 3 5 Submarket Class Surveyed Inventory Space Rate Space Availability Rate Rate 2011 Q3 12 Months Rental Rates Rental Rates 2011 Q3 Construction Vaughan A 14 778,564 0 0.0% 3,500 100.0% 0.4% 8.8% 3,969 88,788 $0.00 $24.95 0 0 B 31 1,432,073 41,047 2.9% 62,697 30.0% 4.4% 6.5% -1,579 50,597 $13.81 $24.46 0 0 C 15 530,069 26,834 5.1% 26,834 0.0% 5.1% 2.5% 3,432 3,432 $15.82 $24.80 0 0 All 60 2,740,706 67,881 2.5% 93,031 24.0% 3.4% 6.4% 5,822 142,817 $14.58 $24.59 0 0 Richmond Hill A 3 462,205 9,190 2.0% 9,190 0.0% 2.0% 1.0% 0 1,312 $0.00 $0.00 0 45,000 B 7 235,022 6,852 2.9% 9,036 0.0% 3.8% 3.7% 0 5,407 $12.85 $24.62 0 0 C 2 40,000 0 0.0% 0 0.0% 0.0% 0.0% 0 0 $0.00 $0.00 0 0 All 12 737,227 16,042 2.2% 18,227 0.0% 2.5% 1.8% 0 6,719 $12.85 $24.62 0 45,000 Hwy404-Hwy407 A 34 4,296,788 331,359 7.7% 535,740 46.0% 12.5% 21.3% 75,236 380,846 $18.03 $31.84 0 0 B 47 2,601,930 233,510 9.0% 263,546 0.0% 10.1% 23.2% -1,118 136,103 $14.82 $26.94 0 0 C 46 1,644,283 54,823 3.3% 109,628 9.3% 6.7% 11.6% 8,562 42,958 $11.90 $19.98 0 0 All 127 8,543,001 619,692 7.3% 908,914 28.2% 10.6% 20.0% 82,680 559,907 $15.80 $28.05 0 0 Markham A 11 1,286,384 146,342 11.4% 163,672 30.7% 12.7% 13.1% 0 -12,265 $13.62 $26.22 0 38,922 Town Centre B 24 1,785,436 60,828 3.4% 117,765 41.3% 6.6% 9.6% 19,115 45,028 $12.11 $21.84 0 0 C 15 412,214 69,325 16.8% 76,995 3.2% 18.7% 36.2% -1,530 5,625 $9.82 $15.98 0 0 All 50 3,484,034 276,495 7.9% 358,432 28.3% 10.3% 13.9% 17,585 38,388 $12.11 $22.07 0 38,922 GTA North A 62 6,823,941 486,891 7.1% 712,102 42.2% 10.4% 16.8% 79,205 458,681 $16.79 $30.26 0 83,922 Total: B 109 6,054,461 342,237 5.7% 453,044 14.9% 7.5% 14.4% 16,418 237,136 $14.17 $25.69 0 0 C 78 2,626,566 150,982 5.7% 213,457 5.9% 8.1% 13.4% 10,464 52,015 $11.65 $19.14 0 0 All 249 15,504,968 980,110 6.3% 1,378,603 27.6% 8.9% 15.3% 106,087 747,831 $14.74 $26.26 0 83,922 Survey results presented on this report have been condensed for reference. Notes: 1 Office Inventory: For the purpose of this report, buildings with less than 10,000 SF of office space and buildings owned and occupied by the government have not been included in the office inventory. 2 Vacancy Rate: The Vacancy Rate is the amount of vacant space divided by the existing building inventory base. Vacant space is available and physically unoccupied, and it includes both head lease and sublease space. 3 Proportion of Sublease Availability: This ratio represents the share of available sublease space of the total available space. 4 Availability Rate: The Availability Rate is the amount of available space divided by the building inventory base. Available space is space that is available for lease and may or may not be vacant. 5 Average Rental Rates: Average rental rates are calculated off available spaces which also quote rental figures.
- 7. Colliers GTA East | Office Statistics 2011 Q3 Proportion 2011 Q3 2010 Q3 Net Net Wgt Avg. Wgt Avg. Net Currently Office Market / Buildings Office Vacant Vacancy Available of Sublease Availability Availability Absorption Absorption Asking Net Asking Gross New Supply Under 1 2 3 5 Submarket Class Surveyed Inventory Space Rate Space Availability Rate Rate 2011 Q3 12 Months Rental Rates Rental Rates 2011 Q3 Construction Scarborough A 6 1,488,002 122,682 8.2% 245,578 57.5% 16.5% 20.6% 93,510 111,987 $14.85 $32.63 0 0 Town Centre B 30 1,766,774 86,174 4.9% 184,370 5.6% 10.4% 12.8% 95,977 142,413 $12.62 $26.90 0 0 C 23 676,559 15,093 2.2% 18,411 0.0% 2.7% 4.6% 2,245 -145 $9.09 $24.57 0 0 All 59 3,931,335 223,949 5.7% 448,359 33.8% 11.4% 14.3% 191,731 256,500 $13.70 $29.94 0 0 Pickering Oshawa A 11 988,095 70,129 7.1% 71,829 0.0% 7.3% 8.3% 50,291 112,342 $14.20 $28.71 0 360,000 B 14 518,581 15,723 3.0% 27,071 35.5% 5.2% 11.4% -12,143 -12,143 $14.51 $25.02 0 - C 6 186,620 0 0.0% 0 0.0% 0.0% 0.0% 0 0 $0.00 $0.00 0 - All 31 1,693,296 85,852 5.1% 98,900 9.7% 5.8% 8.3% 38,148 100,199 $14.29 $27.70 0 360,000 GTA East A 17 2,476,097 192,811 7.8% 317,407 44.5% 12.8% 16.1% 143,801 224,329 $12.32 $26.20 0 360,000 Area B 44 2,285,355 101,897 4.5% 211,441 9.4% 9.3% 12.4% 83,834 130,270 $7.04 $14.70 0 - Total: C 29 863,179 15,093 1.7% 18,411 0.0% 2.1% 3.7% 2,245 -145 $9.09 $24.57 0 - All 90 5,624,631 309,800 5.5% 547,259 29.5% 9.7% 12.6% 229,879 356,699 $10.17 $21.71 0 360,000 Survey results presented on this report have been condensed for reference. Notes: 1 Office Inventory: For the purpose of this report, buildings with less than 10,000 SF of office space and buildings owned and occupied by the government have not been included in the office inventory. 2 Vacancy Rate: The Vacancy Rate is the amount of vacant space divided by the existing building inventory base. Vacant space is available and physically unoccupied, and it includes both head lease and sublease space. 3 Proportion of Sublease Availability: This ratio represents the share of available sublease space of the total available space. 4 Availability Rate: The Availability Rate is the amount of available space divided by the building inventory base. Available space is space that is available for lease and may or may not be vacant. 5 Average Rental Rates: Average rental rates are calculated off available spaces which also quote rental figures.
- 8. Colliers GTA West | Office Statistics 2011 Q3 Proportion of 2011 Q3 2010 Q3 Net Net Wgt Avg. Wgt Avg. Net Currently Office Market / Buildings Office Vacant Vacancy Available Sublease Availability Availability Absorption Absorption Asking Net Asking Gross New Supply Under 1 2 3 5 Submarket Class Surveyed Inventory Space Rate Space Availability Rate Rate 2011 Q3 12 Months Rental Rates Rental Rates 2011 Q3 Construction Airport A 21 2,510,579 286,889 11.4% 364,229 35.8% 14.5% 26.4% 207,139 497,255 $16.05 $30.33 0 0 Corporate Centre B 27 1,863,486 181,552 9.7% 286,718 45.0% 15.4% 16.6% 14,307 -9,633 $14.68 $28.16 0 0 C 31 1,383,218 202,156 14.6% 279,371 9.8% 20.2% 27.8% 19,884 30,045 $13.54 $22.05 0 0 All 79 5,757,283 670,598 11.6% 930,318 30.8% 16.2% 23.5% 241,331 517,666 $14.88 $27.17 0 0 Airport East A 8 957,966 115,973 12.1% 186,121 26.1% 19.4% 27.0% 44,348 94,839 $15.96 $32.61 0 0 B 34 2,221,265 356,377 16.0% 514,021 14.8% 23.1% 26.9% 13,662 157,241 $11.92 $23.57 0 0 C 27 985,197 72,612 7.4% 82,879 9.8% 8.4% 12.7% 1,770 -25,221 $10.02 $18.64 0 0 All 69 4,164,428 544,962 13.1% 783,022 17.0% 18.8% 23.6% 59,780 226,860 $12.68 $25.20 0 0 Airport West A 21 2,613,606 53,626 2.1% 77,715 0.0% 3.0% 3.4% -936 20,417 $13.14 $24.72 0 0 B 27 1,468,066 36,667 2.5% 73,316 23.3% 5.0% 5.8% 52,623 57,139 $10.72 $21.04 0 0 C 11 345,719 19,284 5.6% 31,337 0.0% 9.1% 10.1% 0 63,317 $7.57 $16.31 0 0 All 59 4,427,391 109,578 2.5% 182,368 9.3% 4.1% 4.9% 51,688 140,873 $11.21 $21.79 0 0 Brampton A 13 707,556 80,669 11.4% 142,146 41.9% 20.1% 4.1% 573 14,927 $16.88 $28.14 0 0 B 13 1,658,846 32,806 2.0% 94,006 0.0% 5.7% 0.2% 0 0 $13.80 $25.61 0 0 C 5 107,426 11,880 11.1% 11,880 0.0% 11.1% 49.2% 1,485 18,194 $12.00 $23.75 0 0 All 31 2,473,828 125,355 5.1% 248,032 24.0% 10.0% 3.3% 2,058 33,121 $15.48 $26.97 0 0 Burlington A 19 1,754,171 149,978 8.5% 235,978 33.0% 13.5% 16.0% 11,081 1,795 $17.38 $28.48 0 0 B 35 1,476,729 85,722 5.8% 124,237 5.1% 8.4% 8.8% 3,893 3,618 $13.47 $21.96 0 0 C 29 1,048,162 72,896 7.0% 106,018 2.5% 10.1% 9.0% 12,677 38,834 $11.42 $16.86 0 0 All 83 4,279,062 308,597 7.2% 466,233 18.7% 10.9% 11.8% 27,652 44,247 $14.99 $24.10 0 0 Cooksville A 5 664,087 13,556 2.0% 39,853 14.1% 6.0% 3.2% 1,000 7,292 $15.58 $29.15 0 0 B 19 831,027 48,380 5.8% 68,480 5.4% 8.2% 5.5% 11,757 14,294 $12.76 $23.29 0 0 C 13 323,292 26,897 8.3% 26,897 0.0% 8.3% 9.4% 2,755 10,307 $7.00 $18.00 0 0 All 37 1,818,406 88,833 4.9% 135,230 6.9% 7.4% 5.4% 15,513 31,893 $12.44 $23.97 0 0 Hwy401 A 9 1,763,830 125,332 7.1% 207,729 31.6% 11.8% 17.0% -4,436 -50,477 $13.39 $25.24 0 0 Hurontario B 12 743,944 31,836 4.3% 36,712 0.0% 4.9% 5.4% -4,876 -5,590 $11.43 $22.59 0 0 C 17 756,939 8,320 1.1% 24,216 27.6% 3.2% 3.8% 5,940 18,284 $10.28 $19.98 0 0 All 38 3,264,713 165,488 5.1% 268,658 26.9% 8.2% 11.3% -3,372 -37,783 $12.84 $24.40 0 0 Hwy427 A 14 2,361,188 213,481 9.0% 261,547 14.8% 11.1% 14.7% 93,090 -208,094 $14.44 $31.19 0 0 Bloor-Islington B 34 1,555,926 137,806 8.9% 171,491 0.0% 11.0% 10.7% 24,851 -88,612 $11.91 $25.35 0 0 C 25 639,776 38,867 6.1% 44,036 61.3% 6.9% 8.2% 11,930 18,280 $8.70 $20.62 0 0 All 73 4,556,890 390,154 8.6% 477,074 13.8% 10.5% 12.4% 129,871 -278,426 $13.00 $28.11 0 0 Mississauga A 14 3,002,934 254,920 8.5% 457,562 17.8% 15.2% 12.9% 28,431 123,448 $16.95 $33.02 0 0 City Centre B 9 530,735 7,561 1.4% 18,334 22.1% 3.5% 4.7% 0 20,048 $14.47 $25.93 0 0 C 13 225,898 0 0.0% 1,456 0.0% 0.6% 0.0% -3,125 -3,581 $14.00 $23.49 0 0 All 36 3,759,567 262,481 7.0% 477,352 17.9% 12.7% 10.9% 25,306 139,915 $16.84 $32.72 0 0 Meadowvale A 18 3,221,780 89,852 2.8% 180,224 54.9% 5.6% 4.6% 21,791 121,652 $17.11 $31.88 138,014 321,979 B 41 2,433,725 236,505 9.7% 552,505 11.7% 22.7% 18.1% 64,166 144,490 $16.17 $29.03 0 0 C 41 1,609,387 179,940 11.2% 223,920 5.7% 13.9% 34.9% 22,742 48,907 $12.18 $19.14 0 0 All 100 7,264,892 506,297 7.0% 956,649 18.4% 13.2% 16.2% 108,700 315,049 $15.42 $27.25 138,014 321,979 Sheridan Winston A 4 347,676 0 0.0% 0 0.0% 0.0% 0.0% 0 48,535 $0.00 $0.00 0 0 B 21 1,249,260 7,700 0.6% 14,000 0.0% 1.1% 6.9% 5,865 21,675 $11.63 $23.12 0 0 C 12 443,107 2,562 0.6% 4,392 0.0% 1.0% 11.2% 11,540 8978 $11.25 $16.23 0 0 All 37 2,040,043 10,262 0.5% 18,392 0.0% 0.9% 6.6% 17,405 79188 $11.54 $21.47 0 0 Oakville A 14 1,446,934 187,596 13.0% 199,960 9.3% 13.8% 14.9% 24,786 -31,188 $18.90 $30.80 0 0 B 34 1,398,079 150,348 10.8% 203,040 3.9% 14.5% 16.0% 36,853 87,251 $16.48 $26.20 0 0 C 23 569,531 42,200 7.4% 77,261 1.4% 13.6% 13.4% 11,033 10337 $13.14 $24.45 0 0 All 71 3,414,544 380,143 11.1% 480,261 5.8% 14.1% 15.1% 72,672 66400 $16.95 $27.83 0 0 GTA West A 160 21,352,307 1,571,871 7.4% 2,353,065 26.6% 11.0% 12.9% 426,869 640,401 $16.18 $30.36 138,014 321,979 Total: B 306 17,431,088 1,313,261 7.5% 2,156,861 14.3% 12.4% 12.4% 223,103 401,921 $13.96 $25.76 0 0 C 247 8,437,652 677,615 8.0% 913,662 9.4% 10.8% 17.5% 98,632 236,681 $11.93 $20.15 0 0 All 713 47,221,047 3,562,747 7.5% 5,423,589 18.8% 11.5% 13.5% 748,603 1,279,004 $14.45 $26.51 138,014 321,979 Survey results presented on this report have been condensed for reference. Notes: 1 Office Inventory: For the purpose of this report, buildings with less than 10,000 SF of office space and buildings owned and occupied by the government have not been included in the office inventory. 2 Vacancy Rate: The Vacancy Rate is the amount of vacant space divided by the existing building inventory base. Vacant space is available and physically unoccupied, and it includes both head lease and sublease space. 3 Proportion of Sublease Availability: This ratio represents the share of available sublease space of the total available space. 4 Availability Rate: The Availability Rate is the amount of available space divided by the building inventory base. Available space is space that is available for lease and may or may not be vacant. 5 Average Rental Rates: Average rental rates are calculated off available spaces which also quote rental figures.