The document discusses vulnerability profiling and outlines challenges in defining vulnerability based on fixed demographic characteristics. It then describes the "Umbrella Model" for measuring household livelihood vulnerability, which assesses vulnerability according to 10 factors such as indebtedness, income, assets, health, and social support. The model aims to better understand differences in vulnerability between households in order to design effective interventions.
The document discusses how perspectives on the AIDS epidemic have evolved over time from an initial focus on viral transmission and risk behavior in the 1980s-1990s, to disease progression and treatment in the late 1990s-2000s, and more recently to impact mitigation. It analyzes how different groups have constructed different narratives around AIDS and how problem frames have shifted from risk and vulnerability to rights and threats. Key differences between AIDS and other epidemics discussed are its slow progression, invisibility, association with stigmatized behaviors, and unprecedented mobilization of affected groups that have created large-scale change.
Disaster Risk Reduction Versus Disaster Management July 10, 2011RustyBinas
1) Disaster risk reduction aims to build resilience and self-reliance in communities by reducing risks, while disaster management focuses on emergency response and saving lives in the event of a hazard.
2) Disaster risk reduction emphasizes addressing the root causes of risk through activities like ensuring human rights and reducing vulnerabilities. Disaster management concentrates on contingency planning and mobilizing resources for relief efforts.
3) According to the document, disaster risk reduction is more strategic and sustainable because it makes communities resilient in the long-run by building their capacities to cope with hazards internally.
This document proposes a framework for defining resilient health systems based on lessons from other fields. It defines a resilient health system as one that can prepare for and respond effectively to crises while maintaining core functions. The framework identifies 5 key elements of resilient health systems: 1) awareness of strengths/vulnerabilities, 2) diversity to address diverse health challenges, 3) self-regulation to contain threats while maintaining services, 4) integration of diverse actors and coordination of response, and 5) adaptability to transform in response to adverse conditions. Building resilience requires investments before crises to strengthen health systems and promote rapid recovery during and after crises.
Falls are Not Inevitable: Designing and Implementing a Comprehensive, Evidenc...Cora Butler, JD, RN, CHC
Learning Objectives:
1) Describe the individual and residential care setting consequences of falls in the senior population.
2) Identify best practices for developing a comprehensive multi-disciplinary approach to fall prevention and fall management.
3) Discuss the balance between maintaining resident safety and a resident’s right to self-determination (right to choose).
4) Identify the role and application of data driven approaches and emerging technologies in maintaining quality and resident safety in senior living settings.
5) Identify ways to sustain performance over time.
1. The document discusses how online grassroots activists in Nepal attempted to empower marginalized communities affected by two earthquakes in 2015 by giving them visibility and a voice, as established humanitarian agencies focused aid primarily on urban areas.
2. It notes that some rural areas and communities of "untouchables" had still received no assistance two months after the first quake, showing how old power structures influenced the response despite being destabilized.
3. The author explores how changing power dynamics in disaster contexts can shape humanitarian responses and the role of online activists in connecting overlooked groups to information and assistance networks to better meet their needs and build long-term resilience.
The City Resilience Framework is a unique framework developed by Arup with support from the Rockefeller Foundation, based on extensive research in cities. It provides a lens to understand the complexity of cities and the drivers that contribute to their resilience. Looking at these drivers can help cities to assess the extent of their resilience, to identify critical areas of weakness, and to identify actions and programs to improve the city’s resilience.
Presentation held by Fiona Percy, Care International, at the learning event the Community Based Adaptation and Resilience in East and Southern Africa’s Drylands, held in Addis Abeba, Ethiopia by Care International Adaptation Learning Program for Africa (ALP), The CGIAR research program on Climate change, Agriculture and Food Security (CCAFS) and African Insect Science for Food and Health (ICIPE)
The document discusses disaster preparedness and response strategies for earthquakes in Sikkim, India. It emphasizes the importance of understanding the local terrain and vulnerabilities, effective community communication and alert systems, immediate rescue and evacuation assistance from local NGOs, identifying and supporting vulnerable groups, ensuring immediate needs are met, organizing and communicating data to stakeholders, designing support for trauma, establishing temporary shelters, and facilitating the return to normal life through rebuilding and mitigation efforts. The document provides an overview of many important factors to consider after an earthquake to save lives and support communities.
Importance of connected communities to flood resilienceNeil Dufty
This document discusses the importance of connected communities and social capital in building flood resilience. It provides evidence from research on recent disasters that shows communities with higher levels of social capital, such as strong social networks and high levels of trust and cooperation, recover faster after floods and other disasters. The document suggests some implications for floodplain and emergency managers in Victoria, including working with community developers to assess and strengthen social connections in flood-prone communities before disasters occur, and including content in community education programs about how to form and utilize social capital for flood preparedness and response.
Social Protection in the Face of Climate Change: Targeting Principles and Fin...BASIS AMA Innovation Lab
BASIS Director Michael Carter and BASIS researcher, Sarah Janzen (Professor, Montana State University), presented in December 2015 on the importance of social protection mechanisms in the face of climate change.
The document discusses homelessness and definitions of homelessness. It defines a homeless person as someone who is sleeping in a non-habitable location, emergency shelter, or losing housing within 14 days without support. It also includes people fleeing domestic violence without another residence. Homeless populations include those who are chronically homeless, defined as having a disabling condition and being continuously homeless for over a year or having at least four episodes of homelessness in the past three years.
This document discusses how trauma experienced by individuals can be transmitted across generations and negatively impact entire communities. It defines trauma and explores theories of its transgenerational transfer. Experiencing or being exposed to unresolved trauma is linked to increased rates of family violence, substance abuse, mental health issues, and criminal behavior in subsequent generations. Government policies are also discussed as exacerbating trauma and community dysfunction in Indigenous communities in Australia. The transmission of historical trauma through cultural and family systems helps explain the phenomenon of "dysfunctional community syndrome" seen in some Indigenous communities with high levels of compounded, unresolved trauma.
This document discusses the concepts of "care" and "dependency" and how they have traditionally been viewed separately in research and policy. It argues that care and dependency are interrelated and should be viewed as different aspects of the same phenomenon. The document outlines how the concept of "care" emerged from feminist scholarship to highlight the unpaid labor of women. It also discusses how "dependency" is a contested term with different meanings. The paper proposes that integrating perspectives on care and dependency can lead to a better understanding of their relationship and the social contexts involved.
The percentage of individuals taking recommended preparedness actions like having an emergency plan, disaster supplies kit, and protecting their home has remained largely unchanged since 2007, though over a quarter reported contemplating or preparing to take action to prepare. While 70% of homes had taken at least one mitigation measure, only two measures had been completed by over a quarter of homes. The most commonly cited barriers to preparing were cost and not knowing how to prepare.
The document discusses the relationship between development, quality of life, and disaster risk reduction. It states that development aims to improve quality of life and dignity over time. However, hard-won development can be hampered by disasters, which most severely impact vulnerable community members. To build resilience, development and disaster risk reduction programs must focus on vulnerability reduction and involve multiple stakeholders through participatory planning.
This document discusses risk management, risk regulation, and blame culture in social work. It provides examples of approaches to risk management for released offenders such as improved communication, standardized risk assessment procedures, and local resistance to housing ex-offenders. The document suggests that blame culture has increased due to declining trust in institutions combined with a societal tendency towards negativity and making claims against those in positions of power. Risk regulation aims to control risks through information gathering, standard setting, and influencing behavior.
This document summarizes Nikolas Rose's examination of the rise of psychotherapeutic and social care cultures. It discusses how these cultures involve "governmentality" and exercise a therapeutic authority to legitimize power. Therapies are sought when individuals feel unable to bear the obligations of choice. The document also examines power relations in social worker-client relationships. Social workers control aspects like time, location and resources, establishing power vectors. Social work can also take social issues and construe them as private problems, aiming to normalize people according to dominant ideologies. It discusses how social work forms certain types of selves and identities through its techniques and technologies of care and governing conduct.
This document provides guidance on building sustainability into community recovery after a natural disaster. It discusses how sustainability can help communities become more resilient through disaster recovery. The recovery process involves both short-term and long-term efforts. Key steps include planning ahead for recovery, addressing obstacles, enabling holistic recovery efforts, and institutionalizing sustainability permanently in local policies and plans. Public participation, quality of life, economic vitality, social equity, environmental protection, and disaster resilience are all important principles to consider.
Mapping social vulnerability to flood hazard in Norfolk%2C EnglandKurtis Garbutt
This document summarizes a study that created an open-source vulnerability index (OS-VI) to map social vulnerability to flood hazards in Norfolk, England. The researchers used a deductive indicator-based approach incorporating indicators of vulnerability and flood risk to determine an area's social vulnerability. Unlike some indices, the OS-VI included measures of accessibility to key services like healthcare to account for the loss of capabilities during floods. It was designed for national scale analysis using open-source data and tools. The document reviews literature on vulnerability assessments and indicator selection. It presents the OS-VI methodology and maps vulnerability in Norfolk, including an analysis of accessibility to hospitals.
Emergency preparedness aims to strengthen capacity to withstand disasters through various measures. It requires assessing a community's vulnerability by understanding their interaction with hazards and environment. Preparedness includes developing legal frameworks, collecting risk information, strategies for response and recovery, public awareness, and organizational development. The goal is to reduce vulnerability and risk through prevention, mitigation, and increasing resilience via preparedness planning.
A briefing for Public Health teams on a public mental health approach resilience, trauma and coping beyond the pandemic, and addressing the needs of communities and workplaces
This document discusses vulnerability and resilience in the context of livelihoods and food security. It defines vulnerability as the degree to which people or assets are exposed to harm from hazards, which is determined by their location. Resilience refers to the ability to recover from hardship. Several factors influence livelihoods, including hazards, poverty, environmental degradation, urbanization, and climate change. Hazards disproportionately impact the poor, who often live in more hazardous areas with less capacity to cope. The document analyzes how different elements like gender, age, assets and facilities are vulnerable to various hazards.
The document discusses disaster management and defines key terms. It explains that a disaster occurs when hazards meet vulnerability. The combination of hazards, vulnerability, and inability to reduce risk results in disaster. Vulnerability is defined as the diminished capacity to anticipate, cope with, resist, and recover from hazards. Natural hazards become natural disasters when they affect vulnerable human populations and infrastructure. Man-made disasters result from human-caused hazards like technological or industrial accidents. The disaster management cycle includes impact/response, rehabilitation, reconstruction, mitigation, and preparedness phases. Preparedness aims to strengthen community capacity through activities like risk assessment, response planning, and resource mobilization.
This document defines vulnerability and discusses it from different perspectives. Vulnerability refers to the susceptibility of individuals, communities, or systems to harm from hazards. It is determined by physical, social, economic, and environmental factors that influence the ability to prepare for, respond to, and recover from disasters. The document outlines four main types of vulnerability: physical, economic, social, and environmental. Understanding vulnerability is important for assessing disaster risk. Approaches to reducing vulnerability include building codes, insurance, economic diversity, awareness raising, and preparedness measures.
Recovery-Oriented Risk Assessment and Shared Decision Making. Mapping the Pro...CrimsonpublishersPPrs
Recovery-Oriented Risk Assessment and Shared Decision Making. Mapping the Process of Recovery in Mental Health Care by Jan Sitvast in Psychology and Psychotherapy Research Study
1) A disaster is defined as a serious disruption to a community caused by hazardous events that lead to human, material, economic, and environmental losses and impacts.
2) Disaster risk is determined by the potential loss caused by an interaction between hazards, exposure, vulnerability, and capacity.
3) Disaster risk drivers like climate change, poverty, and rapid urbanization can promote or increase disaster risk by weakening resilience and amplifying the potential impacts of hazards.
COV-19 -Corona Virus -- What a past week in our country and globally.docxmelvinjrobinson2199
COV-19 -Corona Virus -- What a past week in our country and globally ! Tremendous changes with compulsory disorganization and vigilance everywhere in our great country and throughout our world ! The news seems to captivate with an approach of sensitivity to the economical impacts each American as well as every nation on our planet is facing dealing with this emergency management (EM) disaster/pandemic event. Our governments national grip and charge for social distancing with the mandatory closing of non-essential businesses has reach a crucial point in every persons desire to see this horrible virus erracticated. We are all eager to resume our life's, go back to work and make sure we remain and stay healthy and safe as we move forward and into the future. However, will life as Americans ever be the same again for this country and every person in it ? Are face masks the new norm? What about social distancing ? (SD) ? Is SD also a new norm?
Today April 15th is the 6th of 7th classes in this EMA 205 class/course. I was looking forward to enjoying a class room environment with each and all the students enrolled in this EMA 205 course. I enjoy and believe social interaction and amalgamation where we would be able to interact, share, discuss and learn about the many accountable responsibilities in the profession of emergency management could have provided a more balanced understanding of EM. Unfortunately, we were unable to congregate as a group and this is where I find a topic of interest for your next assignment:
The corona virus and COVID-19, the illness it causes, are spreading among communities in the United States and other countries, phrases such as “social distancing,” “self-quarantine” and “flattening the curve” are showing up in the media. What do these terms mean? how do these terms apply to you, your family, your work place, your friends and your community? Have you seen --"Please limit the spread of infection and this diseases and be sure to follow public health guidance programs as the situation develops". What are the public health guidance programs?
Emergency vs. Disaster : An emergency is defined as an unforeseen combination of circumstances, resulting in a state that calls for immediate action or an urgent need for assistance or relief. Large-scale emergencies are usually considered disasters. An emergency can be a temporary disruption of services due to a short power outage, a longer-term situation causing an organization to relocate due to substantial building damage or even a larger scale, city-wide or regional emergency. Depending on the magnitude of the event, services may be provided as usual, services may need to be altered temporarily or, in extreme situations, services may be re-located or even discontinued. In any type of event, the goal is to have plans in place that will: • minimize damage • ensure the safety of staff and clients • protect vital records/assets • allow for self-sufficiency for at least 72 hours .
1) The document discusses the relationship between disaster, development, and reducing disaster risk through sustainable development.
2) It provides an overview of key concepts like the disaster management cycle, disaster risk governance, and integrating development approaches into disaster risk reduction.
3) The document emphasizes the importance of taking an interdisciplinary, participatory approach to disaster risk reduction through building local resilience and well-being.
This document provides an overview of key concepts in disaster risk reduction including hazard, vulnerability, risk, and disaster. It defines these terms and explains how they are related. The document also outlines the major components of disaster risk management, including risk analysis, risk reduction, disaster management, and recovery. It describes strategies within each component and discusses both progress that has been made and continuing challenges in comprehensive disaster risk management.
Risk assessment involves determining the magnitude of potential losses from recognized threats and the probability of losses occurring. It is used in fields like finance, public health, and environmental decisions. In public health, risk assessment quantifies the probability of harmful health effects from activities, and most countries do not allow activities that increase health risks above thresholds. Risk assessment involves hazard identification, dose-response analysis, exposure quantification, and combining the results to estimate risks, which can vary within populations.
Integrating protection into humanitarian responses guidance.3OctLeigh Brady
This document provides guidance for integrating protection into humanitarian responses. It defines protection as seeking to ensure civilian safety from harm and emphasizes that humanitarian agencies have a role to play in understanding risks faced by affected populations and considering how their work impacts these risks. The document outlines key protection principles like focusing on dignity, respecting self-protection capacities, and doing no harm. It suggests that humanitarian responses with a protection entry point should acknowledge protection problems underlying needs, address root causes rather than just symptoms, and consider complementary protection activities like advocacy, legal support, and community-based mechanisms. Specifically for the Occupied Palestinian Territory context, it recommends agencies use protection checklists when planning projects, add conventional protection activities, coordinate and share data with protection partners,
Disaster risk management involves reducing risks through systematic efforts to analyze and manage hazards, exposure, vulnerability, and capacity. It includes preparedness, response, and recovery efforts to lessen disaster impacts. The document outlines key concepts in disaster risk management, including defining disasters and different types, phases of management from risk reduction to recovery, and principles such as using an integrated and collaborative approach. Disaster risk is a function of hazards and vulnerability moderated by capacity. Risk analysis should involve communities to identify priorities and reduce social exclusions.
Social protection aims to reduce vulnerability among the poor. It encompasses protective, preventive, promotive and transformative measures. Protective measures provide relief from deprivation through social assistance and services. Preventive measures deal with economic vulnerability through social insurance. Promotive measures enhance incomes and capabilities via livelihood programs. Transformative measures address social equity and exclusion through collective action and regulatory changes. Effective social protection requires addressing challenges of affordability, growth, and equity. Recent research shows many forms are affordable and can directly boost incomes and indirectly support growth. Rights-based approaches also focus on modifying attitudes towards vulnerable groups.
Understanding vulnerability to hazards and disastersKennethDumancas
Vulnerability refers to the capacity of individuals and societies to prepare for, withstand, and recover from hazardous events. It is influenced by many economic, social, political, and environmental factors. The Pacific Ring of Fire is home to over 75% of the world's active and dormant volcanoes and is highly prone to earthquakes and volcanic eruptions due to its location along the boundaries of tectonic plates. Vulnerable groups include persons with disabilities, the elderly, children, and those with low socioeconomic status who have greater difficulty coping with disasters.
This document defines vulnerability and disaster risk. Vulnerability refers to characteristics that make individuals, communities, or assets susceptible to harm from hazards. It can be physical, social, economic, or environmental. Vulnerability depends on exposure to hazards as well as resistance and resilience. The Philippines, for example, is highly vulnerable to typhoons due to high exposure, lack of protection, and limited ability to recover. Understanding vulnerability is important for assessing disaster risk, which is a function of hazards and vulnerability moderated by response capacity. Reducing vulnerability involves measures like building codes, insurance, economic diversity, and preparedness.
Running head: 1-3 FINAL PROJECT: MILESTONE ONE 1
PHE 330 FINAL PROJECT: MILESTONE ONE 5
1-3 Final Project: Milestone One
XXXXXXXXX
Public Health Education & Communication
Tami Ford
Southern New Hampshire University
September 4, 2022
I. Health Problem.
I have chosen to complete my final project discussing Human Immunodeficiency Virus (HIV). There are quite a few people that I know that are near and dear to my heart living with this virus. There are many misconceptions about HIV that the public has simply due to unawareness. With most common public health issues there are many questions that need to be answered to solve the myths. Mental health and substance use disorders can also make it difficult for people to take their medications as prescribed. When HIV is not treated or maintained, it can lead to the fatal diseases Acquired Immune Deficiency Syndrome (AIDS). Of note, you cannot have AIDS without being infected with HIV. According to the Center for Disease Control, HIV can affect anyone regardless of sexual orientation, race, ethnicity, gender, or age (CDC, 2022). However, certain groups are at a higher risk for HIV and weigh special considerations due to the specific risk factors. Gay and Bisexual men, pregnant women, infants, children, Transgender people, people who exchange sex for money, people who inject drugs, etc. These are all considerations of the causes for higher risk for being affected by HIV. However, with the modern medicines and treatments for HIV, many have been known to live long and healthy lives.
II. Organization.
The organization that I have chosen is the World Health Organization (WHO). WHO was founded in 1948 and is the United Nations Agency that connects nations, partners, and people to promote health, keep the world safe and serve the vulnerable – so everyone, everywhere can attain the highest level of health (WHO, 2022). My role in this organization will be a Public Health Physician. WHO works closely with United Nations Children’s Fund (UNICEF) on Elimination of Mother-to Child Transmission (EMTCT) of HIV and pediatric AIDS and works with United Nations Population Fund (UNFPA) on the integration of HIV and Sexual and Reproductive Health and Rights (SRHR). WHO considers the epidemiological, technological, and contextual trends of previous years, promotes learning with each disease area, and generates opportunities to leverage innovations and knowledge for efficient responses to HIV and sexually transmitted infections (STI). Thanks to awareness and past research, WHO is able to provide a in depth analysis of the past and current trends of HIV and other STI through multiple platforms.
References
Centers for Disease Control and Prevention. (2022, August 5).
HIV. Centers for Disease Control and Prevention. Retrieved September 4, 2022, from https://www.cd.
The presentation focuses on the importance of investing in human capital in building and strengthening community resilience against disasters. It is evident that poor health and education impact longer term employment opportunities and income prospects for young people entering into job market. Lower income and/or employment opportunities thus in turn affect the capacity of individuals, families and communities as a whole to respond effectively and efficiently to shocks, stress and disasters. That’s why it becomes crucial to invest for building human capital which in the longer run helps strengthening resilience and coping capacity.
The presentation targets to build awareness and sensitization among the stakeholders involved in community resilience and disaster risk reduction.
Strategies for Effective Upskilling is a presentation by Chinwendu Peace in a Your Skill Boost Masterclass organisation by the Excellence Foundation for South Sudan on 08th and 09th June 2024 from 1 PM to 3 PM on each day.
A review of the growth of the Israel Genealogy Research Association Database Collection for the last 12 months. Our collection is now passed the 3 million mark and still growing. See which archives have contributed the most. See the different types of records we have, and which years have had records added. You can also see what we have for the future.
Introduction to AI for Nonprofits with Tapp NetworkTechSoup
Dive into the world of AI! Experts Jon Hill and Tareq Monaur will guide you through AI's role in enhancing nonprofit websites and basic marketing strategies, making it easy to understand and apply.
Exploiting Artificial Intelligence for Empowering Researchers and Faculty, In...Dr. Vinod Kumar Kanvaria
Exploiting Artificial Intelligence for Empowering Researchers and Faculty,
International FDP on Fundamentals of Research in Social Sciences
at Integral University, Lucknow, 06.06.2024
By Dr. Vinod Kumar Kanvaria
ISO/IEC 27001, ISO/IEC 42001, and GDPR: Best Practices for Implementation and...PECB
Denis is a dynamic and results-driven Chief Information Officer (CIO) with a distinguished career spanning information systems analysis and technical project management. With a proven track record of spearheading the design and delivery of cutting-edge Information Management solutions, he has consistently elevated business operations, streamlined reporting functions, and maximized process efficiency.
Certified as an ISO/IEC 27001: Information Security Management Systems (ISMS) Lead Implementer, Data Protection Officer, and Cyber Risks Analyst, Denis brings a heightened focus on data security, privacy, and cyber resilience to every endeavor.
His expertise extends across a diverse spectrum of reporting, database, and web development applications, underpinned by an exceptional grasp of data storage and virtualization technologies. His proficiency in application testing, database administration, and data cleansing ensures seamless execution of complex projects.
What sets Denis apart is his comprehensive understanding of Business and Systems Analysis technologies, honed through involvement in all phases of the Software Development Lifecycle (SDLC). From meticulous requirements gathering to precise analysis, innovative design, rigorous development, thorough testing, and successful implementation, he has consistently delivered exceptional results.
Throughout his career, he has taken on multifaceted roles, from leading technical project management teams to owning solutions that drive operational excellence. His conscientious and proactive approach is unwavering, whether he is working independently or collaboratively within a team. His ability to connect with colleagues on a personal level underscores his commitment to fostering a harmonious and productive workplace environment.
Date: May 29, 2024
Tags: Information Security, ISO/IEC 27001, ISO/IEC 42001, Artificial Intelligence, GDPR
-------------------------------------------------------------------------------
Find out more about ISO training and certification services
Training: ISO/IEC 27001 Information Security Management System - EN | PECB
ISO/IEC 42001 Artificial Intelligence Management System - EN | PECB
General Data Protection Regulation (GDPR) - Training Courses - EN | PECB
Webinars: https://pecb.com/webinars
Article: https://pecb.com/article
-------------------------------------------------------------------------------
For more information about PECB:
Website: https://pecb.com/
LinkedIn: https://www.linkedin.com/company/pecb/
Facebook: https://www.facebook.com/PECBInternational/
Slideshare: http://www.slideshare.net/PECBCERTIFICATION
The simplified electron and muon model, Oscillating Spacetime: The Foundation...RitikBhardwaj56
Discover the Simplified Electron and Muon Model: A New Wave-Based Approach to Understanding Particles delves into a groundbreaking theory that presents electrons and muons as rotating soliton waves within oscillating spacetime. Geared towards students, researchers, and science buffs, this book breaks down complex ideas into simple explanations. It covers topics such as electron waves, temporal dynamics, and the implications of this model on particle physics. With clear illustrations and easy-to-follow explanations, readers will gain a new outlook on the universe's fundamental nature.
हिंदी वर्णमाला पीपीटी, hindi alphabet PPT presentation, hindi varnamala PPT, Hindi Varnamala pdf, हिंदी स्वर, हिंदी व्यंजन, sikhiye hindi varnmala, dr. mulla adam ali, hindi language and literature, hindi alphabet with drawing, hindi alphabet pdf, hindi varnamala for childrens, hindi language, hindi varnamala practice for kids, https://www.drmullaadamali.com
Macroeconomics- Movie Location
This will be used as part of your Personal Professional Portfolio once graded.
Objective:
Prepare a presentation or a paper using research, basic comparative analysis, data organization and application of economic information. You will make an informed assessment of an economic climate outside of the United States to accomplish an entertainment industry objective.
1. Vulnerability Profiling
One of the key elements of social protection, and in particular when planning programmes
and interventions for social protection, is to understand and define vulnerability. This is framed
around five key questions: Who is vulnerable? To what are they vulnerable? Why are they
vulnerable? What can be done to reduce their vulnerability? What is the likely impact of an
intervention on their vulnerability?
Vulnerability Profiling: challenges
The concept of ‘vulnerable groups’ has been applied recently to both relief and development
programmes as an approach to try and ensure that those who are most at risk can be enabled to get
necessary assistance. This approach is typically based around fairly fixed categories of ‘vulnerable
groups’ such as women headed households, persons with disabilities and older persons. Sometimes,
socio-economic criteria such as land tenure or income are used to classify people. On the basis of
classification as ‘vulnerable’ or ‘not’, a person or household may be entitled to some form of
assistance. This approach assumes that all people with certain demographic criteria (PwDs or older
persons) are vulnerable, and would thus need assistance. Whilst it may be true that certain groups
of people such as PwDs or older persons are more likely to be vulnerable to certain hazards than
others, they may not all be vulnerable, and probably are not vulnerable in the same ways, or for the
same reasons. Frequently, this current practice of assigning people to ‘vulnerable groups’-typically
determined by demographics such as gender, age and disability, by assuming that members of these
groups are homogenous and thus equally vulnerable, fails to adequately differentiate between
persons with disabilities, or older people, or female headed households, who are vulnerable and
those who are not, and moreover, by failing to make detailed analysis of the causes and
contributors to vulnerability at household level are not able to design the most effective
interventions. Inevitably, being classified as ‘vulnerable’ is also a relative term, referring not to an
absolute, fixed state, but one which is judged in comparison with others, usually locally, and which
is also subject to change. This further highlights the need for an approach to measuring
vulnerability which is not based on fixed demographic characteristics (otherwise, all PwDs and all
older people will always be vulnerable, no matter what).
Key concepts for vulnerability profiling
Firstly, vulnerability needs to be considered in relative terms, and in relation to a certain set of
probable threats. For example, we can ask ‘Which people are more vulnerable to the impact of a
natural disaster?’ This question also covers two elements: likelihood of exposure (primary) and
likelihood of loss/injury is exposed (secondary). There can be a third element, which is the
likelihood of serious longer-term consequences as a result of loss/injury (tertiary) and this is
related to resilience. Considering the likelihood of exposure, one needs to establish the list of likely
threats and determine which people are more likely to face those threats within a given time
period. So, for example, flooding or drought exposure will be determined by macro factors (which
region you live in) and more local factors (whether you live near a river). The likelihood of
damage/loss is linked to exposure (because some people may be exposed for longer periods or to
more extreme conditions than others) but is also linked to more local factors such as house design,
types of livelihood, health status, ability to escape to safer places. The likelihood of longer-term
2. consequences is more directly linked to resilience: the ability to withstand, to respond to, and to
build back after exposure to a particular threat. Thus, it is clear that people who live in flood-prone
areas are more likely than those who do not, to experience flooding; moreover, those who live in
poorly built houses near the river bank are more likely to experience loss and damage than those is
better houses. Finally, those who have a few coping mechanisms are more likely to suffer long-term
consequences of flood damage than those who have multiple coping mechanisms. Hence, assessing
and measuring vulnerability is complex, and is defined by the threat being considered. Having said
that, it is still possible to make some generalizations about vulnerability and who might be more
vulnerable, particularly when considering resilience. Within the mandate of social protection,
protection from exposure to, damage by and consequences of different man-made and natural
hazards are included. However, the focus of much of the research which will be presented here is
primarily around the third aspect, which looks at resilience and the ability to withstand the damage
of a hazard and ‘bounce back’ to continue to survive or even thrive. Whilst other aspects are
important, it is this aspect which is most relevant to much of the work around social security, social
welfare and community based social protection schemes.
Having established some understanding of vulnerability, and of the challenges of how to measure
vulnerability in a way which is consistent with a rights-based approach and which is not based on
fixed demographic characteristics, we can now describe an approach to measuring vulnerability
which has the potential to measure aspects of household vulnerability in a more detailed way,
potentially allowing us to understand more about why THIS household is more vulnerable than
THAT household to a certain type of hazard. Understanding this type of vulnerability profile allows
us to then look at what needs to be done to reduce the vulnerability of a certain household, rather
than simply classifying the household as vulnerable or not. The model studied in this paper, the
‘Umbrella’ model, can enable a ‘rights based’ approach, facilitating inclusion of persons with
disabilities (and other ‘vulnerable’ group members) as active participants in process, but without
guaranteeing their status as an automatic beneficiary.
Are vulnerability and poverty the same?
Finally, a common question: what is the correlation between vulnerability and poverty? Are they
essentially the same? What is the advantage of measuring vulnerability? Poverty is acknowledged
to be multi-faceted, often defying simple analysis and interventions. Whilst measurements exist to
quantify poverty in absolute economic terms (for example, $1 per day purchasing power parity), a
more useful poverty measurement needs to reflect the dynamic aspect of poverty. One approach is
to measure both chronic and transitory povertyi, and to quantify the extent to which poverty is
caused by fluctuations in welfare (transitory poverty) as well as low levels of welfare in the long-
term (chronic poverty)ii. Studies of transitory and chronic poverty assert that ‘potentially much
larger reductions in aggregate income poverty might be achieved by enhancing households’ ability
to smooth incomes across time’.iii A significant underlying contributors to and causes of transitory
and chronic poverty is exposure to, and consequences of, natural disasters and other crises and
hazardsiv. This in turn also includes analysis of factors which can affect resilience at community
and household level. Hence, poverty reduction strategies have included aspects of vulnerability
reduction as essential elements. Tools such as the Livelihood Vulnerability Index have been used to
measure projected impact (i.e. vulnerability) at community level of the effects of climate changev. In
general, poverty is linked to vulnerability to natural disaster, economic shock and other hazards in
a cyclical fashion: poorer households are typically more vulnerable to both exposure to and
negative impact from shocks, and the increased exposure and impact contributes to chronic
poverty. Hence, any understanding of poverty must also include an understanding of vulnerability.
Thus it may be that some households can be considered ‘poor’ but not necessarily vulnerable, and
likewise, some vulnerable households may not necessarily be poor. The overall advantage of
3. measuring vulnerability is that it can help identify not only households that are already poor, but
those that are at risk of becoming poor. This identification of ‘near-poor’ households with
vulnerabilities to specific hazards can be of great beneft to poverty reduction programmes. One
critical question concerning measurement is, to what extent there is overlap between hosueholds
classified as poor and households classified as vulnerable? This will be explored further as we
consider a specific tool to measure vulnerability.
Umbrella Model to measure household livelihood vulnerability
The umbrella model for measuring household livelihood vulnerability was developed in 2010 by
the Livelihood and Food Security Trust Fund, in an attempt to introduce more rigorous and
measureable selection criteria to ensure that the right interventions reached those who really
needed them. The model is is so called because of its application to plot household vulnerability in a
user-friendly umbrella style radar plot to illustrate the relative degree of ‘protection’ which a
household has against shocks and hazards. The tool draws on Moser’s ‘Asset vulnerability
framework’ to measure household economic vulnerability according to ten factors (indebtedness,
productive income, livelihood diversity, dependency ratio, asset profile, water & sanitation, food
security, health, social capital and decision making power), and was developed according to a
livelihood and vulnerability framework developed by the Livelihood and Food Security Trust Fund
(Myanmar)vi. The full list of factors and linked indicators is included as Table 1.
Table 1: Vulnerability factors, contributions to vulnerability, indicators and sources
Factor Contribution to vulnerability Indicator Source &
validation
Indebtedness High levels of non-productive debt put livelihood assets at
risk (collateral); repayments may reduce essential
expenditure; high levels of existing debt can reduce ability
to access additional credit
Debt repayment as
proportion of income
Repayment: income ratio
>30% is usually risky
World Bank 1997vii,
adapted
Income Low or negative income: expenditure ratio can lead to
reduction in essential spending, increase risk of debt or
negative coping responses. High proportion of income
spent on non-productive items can lead to under-
investment in livelihood, leading to higher risk
Proportion of income
expended on non-
productive items (food,
health, rent, fines)
World Bank 1997,
adapted
Assets Ownership of livelihood assets, convertible assets or
crucially, land (in the form of usage right) can provide short
term protection against shocks.
Moser’s asset vulnerability
Framework, adapted for
survey by Myanmar Market
Research Department
Moser (1998)viii
Food Security Current and prior experience of food insecurity is strongly
linked with increased vulnerability to future food
insecurity. Likewise, food insecurity leading to malnutrition
can affect human capital, and put livelihoods at risk.
Food Security Index UNDPix, modified
Livelihood
diversification
capacity
Income derived from a single source is more vulnerable to
shocks. Multiple sources, or the potential to diversify, can
increase protection against shocks affected main/key
livelihoods
Livelihood diversity index
(= number of income
generating activities at HH)
DHS (2006) modified
Health Chronic or frequent illness in primary earner OR one
requiring care threatens livelihood security and reduces
income, as well as increasing health expenditure;
unplanned health expenditure is a common cause of
negative coping (e.g. conversion of livelihood assets to
cash)
Income generating
household member days
per year lost work through
illness
UNDP modified
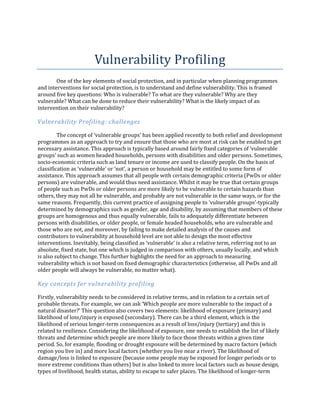
4. Water &
Sanitation
Water is an essential for health and many livelihoods; more
time taken to draw water reduces time for other activities;
unsafe water sources increase risk of ill health which
reduce livelihood effectiveness; unreliable water supplies
increase resource expenditure
Average time to collect
water
DHS (2006)x
Dependents Household members requiring high levels of social or
medical care divert human, physical and financial resources
away from potentially productive livelihood activities
Household Dependency
scale
TLMIxi adapted
Social
Participation
Persons with higher levels of social participation build up
social capital, which can increase the likelihood of relief
and assistance in times of difficulty
Participation index TLMI, adapted from
p-scale (KIT)
Decision
making
Persons with more influence in decision making can have
stronger negotiating position for livelihood related factors
such as fair pricing, land and asset use
Proximity to power scale Adapted UNDP
Factors were measured using standardized indicators, which were then then converted by
mathematical formulas to a scale from 0-1 to allow input into the vulnerability model. The
indicators can be collected at household level, or at community level. Provided that there is a
consistent method to convert to a scale, different and even multiple indicators can be used to
measure the different factors. This is essential as different indicators, or different calibrations, may
be required for different populations or geographical areas. Scores are plotted on a 10-point radar
plot, either as a single household plot, a village aggregate, a township or even State level aggregate.
A sample model for a household ‘plot’ is displayed as Figure 1. Higher scores indicate more
‘protection’ and hence less vulnerability.
Figure 1: sample ‘Umbrella’ vulnerability profile for Ayartaw Township
5. This model looks primarily at relative resilience, as the capacity to cope with shocks and hazards,
rather than relative exposure. Hence, it is best applied to determine which households are more
vulnerable within a given population, rather than for absolute comparison between regions or
countries. Vulnerability was defined in relative terms, by measuring the relative deviation of a
particular household score from the overall population mean. So, the score for each factor is
measured against the overall population score. If the household score for that factor (for example,
health) was more than one standard deviation below the overall population average, then that
factor was classified as ‘vulnerable’. Overall, a household was classified as ‘Vulnerable’ if they had
three or more of the ten factors which scored over 1 standard deviation lower than the population
mean for those factors.
There are several significant features of this model which need further explanation before we can
consider the application of the model. Firstly, the model classifies vulnerability at household, rather
than individual level, thus moving beyond fixed demographic characteristics to more dynamic
socio-economic characteristics. However, this may mean that some individual vulnerabilities may
be masked (such as the vulnerability of older persons within a household). However, in measuring
the resilience of a given household, we make the assumption that resources are distributed
according to need within a household, thus imputing the overall household vulnerability onto its
members.
Secondly, as mentioned above, the model relies on measurement against the population average to
determine vulnerability. As there is no national standard, or gold standard, each household’s
vulnerability is measured against the standard of its local peers. Hence, if a household is classified
as vulnerable, it is has at least three factors which score significantly lower than the overall
population average. In essence, a household is judged according to its neighbours.
Following this, the use of a statistical approach to measure vulnerability (one standard deviation
below the average) does mean that vulnerability is dependent on how equally scores are
distributed. If some scores were very widely distributed, this would lead to a wider range and a
larger standard deviation, meaning that only those with very low scores would be classified as
vulnerable. Likewise, if scores are bunched close together, with very little difference between
households, then very small differences could lead to being classified as vulnerable. One solution
could be to take the average of the scores for all the factors and use that as the basis for classifying
vulnerability. However, this would require that each indicators have the same sensitivity and range,
in order to contribute equally to the overall score. As this is very difficult to do, the ‘three and
above’ rule (three or more factors more than one standard deviation below the mean) was used.
This allows for some errors in households where there may be one or two scores which are low, but
the household itself is reasonably secure. However, as with any approach, there are strengths and
weaknesses.
The model has been tested in various contexts to assess the suitability in determining vulnerability,
and in assisting beneficiary selection. Generally speaking, the model offers a superior approach
than more crude tools like wealth ranking, as it can identify households who are not ‘poorest of the
poor’ but who nonetheless are at risk of becoming so. Field testing has demonstrated high levels of
satisfaction amongst users and households. Validation is challenging, as there is no comparable
‘gold standard’. However, the tool has been used as a baseline for several development projects, and
final end-project assessment is expected to demonstrate whether the model was useful in enabling
accurate profiling and targeting of vulnerable households.
6. How accurate and reliable is the Umbrella Model, and how does it compare with
other approaches to profiling?
The model has been applied in several different projects, and data has been gathered on over 6,000
households in 7 States and Regions of Myanmar, including specific data on over 1,000 households
with persons with disabilities. Analysis of combined data from 5,000 households from a general
population demonstrated that overall, 22.65% of all households were classified as vulnerable, when
compared with the population sample of 5,000 households. Using a standard measure of poverty
(wealth ranking in the lowest quintile) 22.3% of households would be classified as poor, and of
these, 49% were also considered vulnerable. This means that of all the people identified as
vulnerable, around half will be classified as poor by using wealth ranking, and half will not.
Likewise, of all households identified as poor by using wealth ranking, around half would be
considered vulnerable, and half would not. This demonstrates that using the umbrella model, a
significant proportion of the poor households were captured, but in addition, a significant number
of non-poor households were also identified, and a proportion of poor households (as classified
using conventional methods) were not classified as vulnerable. Why the difference? Firstly, we need
to remember that wealth ranking is established by using the quintile (those in the lowest 5th, or
20%) whereas the Umbrella model used a cutoff of one standard deviation below the population
mean. In fact, applying the quintile cutoff to the umbrella model does not significantly alter either
the overall proportion classified as vulnerable, or the correlation between those classified as poor
by wealth ranking and those classified as vulnerable by the umbrella model. Secondly, we need to
remember that wealth ranking is using one factor in an essentially linear approach (any value
below a certain point is considered ‘poor’) whereas the umbrella model, whilst using a linear model
for each calculating the vulnerability status of each factor, converts these into a non-linear result by
combining the number of vulnerable factors and determining a cutoff point (more than two) as the
definition. Thirdly, and most significantly, it should be pointed out that wealth ranking to measure
poverty and the umbrella model to measure vulnerability are measuring different things. One is
measuring actual wealth, whereas the other is measuring a series of characteristics which may put
a household at risk. Hence, although it may be useful to evaluate the ability of the umbrella model to
identify poor households, this is not what the model was designed to do. Testing of the model
against a wider, community based set of criteria for beneficiary selection of ‘poor’ households has
demonstrated wide variation; however, when applied in conjunction with other tools, the umbrella
model has been demonstrated to be a significant asset in terms of assisting accurate mapping of
household and community vulnerabilities and priorities. This illustrates the difference between
poverty and vulnerability, and suggests that the best application of the umbrella model is on
conjunction with other tools. In medical terms, we can think of the umbrella model as a kind of
diagnostic test like an X-ray, used to confirm, expand on and potentially identify new issues, but to
be used in conjunction with basic diagnostic tools such as a patient history and physical
examination.
Another way of evaluating the model is looking at sensitivity and specificity. Sensitivity is the ability
of a test to include all ‘positives’ and to have a low proportion of true ‘positives’ which are not
identified using the test. The specificity of a test is the ability to correctly exclude ‘negatives’ who do
not fit the criteria. Let’s assume that we use asset profile as our standard for poverty, and we ask
the question: how good is the umbrella model at identifying as vulnerable households whose asset
profile is in the lowest quintile (lowest 20%) of the population? In this way, we would say that any
household whose asset profile was in the lowest quintile is a ‘positive’, so we want to see how many
of those households are included when we do vulnerability profiling, and how many households
which are NOT in the lowest quintile are included as ‘positives’ by the umbrella model.
7. We can compare this with standard demographic profiling, which would identify as ‘vulnerable’ any
household which is either landless, female headed, which has a person with disability or an older
person.
Table 2: Comparison of Umbrella Model with Combined Standard Demographic Profiling
Method
Measure
Umbrella model Standard demographic
profiling
Sensitivity 54% 80%
Specificity 84% 5.2%
F-test 0.57 0.08
Overall, using the umbrella model, of 1,114 households with asset profile in the lowest quintile,
572 were identified as vulnerable using the umbrella model-a sensitivity of 54%. However, of the
number of households identified as vulnerable but whose asset profile was NOT in the lowest
quintile was relatively low (585) giving a specificity of 84%. Overall, the F-test (a measure of the
performance of the test) was calculated at 0.57-not great, but a reasonable fit. This compares well
with standard profiling, which has a much lower sensitivity and specificity, and hence a lower F-
test. This tells us that demographic profiling is likely to miss a number of households which are
poor, but which do not fit standard profiles.
The main problem with multiple factors to profiling is that we tend to include too many people, and
so have very low specificity. If we compare using a series of individual profiles (PwD, Female
Headed Household, Older Person, Landless) and ask the question: if we choose people on the basis
that the household has a PwD/Older person, or is female-headed, or landless, what is the likelihood
that we will successfully identify the poorest households (as defined by having asset profile in the
lowest quintile)? Will we leave out a large proportion of people who should be included? Would we
include some people who were not considered the poorest households (this is essentially what we
mean by sensitivity and specificity)?
If we compare the relative sensitivity, specificity, positive predictive value (the likelihood that a
household is actually poor, if included in the list by the selection criteria) and the F-test, we can see
that the selection criteria most likely to accurately include the poorest households, and correctly
exclude households which are not the poorest, is using landlessness as the main criteria.
Table 3: Comparison of different Demographic Factors for profiling
PwD
Female
Headed
Older
Person Landless
Sensitivity 34% 36% 35% 69%
Specificity 67% 79% 53% 75%
Positive Predictive Value 20% 29% 15% 40%
F-test 0.25 0.32 0.21 0.50
In the umbrella model, do some factors influence the likelihood of being classified
as vulnerable more than others?
In any model with multiple factors, it is important to determine whether any individual factors have
an unequal influence over a final outcome. For example, we can construct models to determine the
influence of age, height and weight on blood pressure, and determine which of these three factors
8. are more likely to influence blood pressure. In the same way, with the umbrella model, we need to
determine whether some factors gave inordinate influence on the final classification of
vulnerability.
This is useful for several reasons. Firstly, it can help evaluate whether the model has a good ‘fit’:
meaning, are all the factors reasonably equal in their influence on vulnerability, or are the results
heavily skewed by extreme variables in one or more of the factors. Secondly, in terms of
application, this analysis can help us determine whether certain factors do have more influence,
and if so, then we can estimate the likely impact on overall vulnerability of modifying those factors
(for example, improving livelihood diversity). This is can be analyzed for sub-groups: for example,
we can see whether poor asset profile is a stronger influence on vulnerability amongst female
headed households. This can then give us some clues as to what may be the most beneficial to focus
on in our vulnerability reduction strategies. A word of caution: the big assumption when applying
the umbrella model is that the model truly reflects reality. In other words, that when we identify a
household as ‘vulnerable’ according to the model, that they are in fact likely to be more vulnerable.
This can only really be proven with long-term studies looking at the impact of different hazards on
different types of households-and this raises some ethical issues about not intervening when we see
that vulnerability does exist. However, the assumption is further tested when we consider the likely
impact of changing variables. So, if we improve the livelihood diversity status of a household, so
that they move from being ‘vulnerable’ to ‘not vulnerable’ does that in fact reflect their actual
situation? Again, we have no evidence to confirm this, and therefore need to make an assumption,
based on other studies, that in most situations, improving livelihood diversity does in fact reduce
vulnerability. This again underscores the caution with using any model: there will always be certain
assumptions which can only be practically proved or disproved. Hence, we need to exercise some
caution when reading into the results of analysis of any tool measuring poverty or vulnerability.
Practically, there are two ways to measure the overall influence of a single factor on overall
vulnerability status. The first method is simple exclusion, which examines the rate of change in
vulnerability classification when a certain factor is eliminated from the model. This is
straightforward, but has some problems given that the classification of vulnerability is non-linear
(you either are vulnerable or not) based on having more than two vulnerable factors, and excluding
one factor also reduces the probability of scoring more than two. However, we can nonetheless
estimate the percentage reduction in vulnerability when each factor is removed from the model:
Table 4: Relative influence of different factors in the umbrella model on overall vulnerability
% reduction in vulnerability when factor is
removed
Dependents 15.17
Indebtedness 15.17
Income 16
Livelihood diversification capacity 14.59
Food Security 16.92
Water & Sanitation 20.81
Health 24.05
Assets 21.39
Social Participation 18.08
Decision making 17.91
A more statistically reliable approach to measuring the relative contribution of each factor
(variable) to the overall classification of vulnerability is to construct a multiple logistic regression
9. model, and then evaluate the impact value of each factor in turn on the overall classification of
vulnerability. Using this approach, we can estimate the overall vulnerability score by an equation
which multiplies the household score in each factor by the impact value of each factor.
This becomes y=m1x1 + m2x2+m3x3……+b, where m is the impact factor and x is the score in each
factor. Y is the overall vulnerability score, and b is the constant.
Essentially, what the regression model does is to look at the impact on the whole model of changing
one of the variables (factors) assuming that there is no relationship between one factor and
another.
The outcome of the regression model allows us to see the amount of change in each factor which
would result in a change in status of vulnerability. This can show us the extent to which changes in
certain factors can influence vulnerability. We can also test to see if these findings are statistically
significant.
Firstly, we assess the overall ‘fitness’ of the model, which tells us the degree to which changes in the
variables are linked with changes to the overall status. Not surprisingly, there is reasonable ‘fit’
with an R-coefficient of 0.39 for simple vulnerable/not status and R-co-efficient of 0.58 when
looking at the impact of factors on the overall score for number of vulnerable factors.
When looking at the point change required to influence overall status, we can see that each of tehse
are expressed as a negative number. This shows that a REDUCTION in score is associated with an
increased likelihood of being considered vulnerable, which is how the model works. Reading the
scores we can say, for example, that a reduction in the income score of 0.4 is required to result in a
significant change in the overall vulnerability status, whereas a smaller change (-0.122) in decision
making will have the same effect. This is largely a reflection of the way in which scores are
distributed. If scores are widely distributed, meaning that we have a good spread of high, medium
and low scores, then the point change needed to influence vulnerability status will be higher. In
some factors, however, the differences in scores between households was quite minimal, and so a
small change in the score for that factor would have a significant impact on overall vulnerability.
Again, this leads to the question of 'Does ‘his really matter in reality?’. In other words, if we address
issues of decision making so that household scores improved, and then those households were no
longer considered vulnerable, would that actually mean that they were, in real life, not vulnerable
any more? The answer would be…yes, in a way, because clearly, in real life, lack of participation in
decision making is known to be linked with increased vulnerability. But the complexity of
vulnerability means that there may also be other factors which are also needed to address
vulnerability.
Table 5: relative influence of different factors on overall vulnerability, using linear estimates in a
multifactor regression model
Point change required to
influence overall status
Statistical significance
Dependents -0.209 <0.001
Indebtedness -0.41 <0.001
Income -0.4 <0.001
Livelihood diversification
capacity
-0.359 <0.001
Food Security -0.136 <0.001
Water & Sanitation -0.489 <0.001
Health -0.1904 <0.001
Assets -0.3317 <0.001
Social Participation -0.2027 <0.001
Decision making -0.122 <0.001
10. In later chapters, we will be able to analyze the extent to which the influence of different factors
changes with different types of household. For example, is asset profile a more significant influence
on vulnerability amongst women-headed households?
What is the typical profile of a household classified as vulnerable?
When we compare households classified as vulnerable as those that are not, we can see that
vulnerable households are more likely than non-vulnerable households to be female-headed, to
have a member who has a disability and to have an older person in the house, and typically would
own smaller amounts of land (or none at all) compared to non-vulnerable households.
Table 6: Profile of vulnerable households
Vulnerable Not
Household members (average) 4.8 5.1
Age of Household head 50.39 51.15
% female headed 26.6% 22.3%
% with person with disabilities 20.2% 16.0%
% with older person 38.4% 36.4%
Number of dependents 2.17 1.85
Average number of income sources 2.35 2.77
% expenditure on food 33.5% 31.8%
% expenditure on debt 16.5% 11.5%
% of debt owned by money lenders 30.5% 21.7%
average # land acres owned 1.33 1.99
Average days lost per income generating member to ill health 11.64 2.99
Vulnerable households have a higher number of dependents, fewer income sources, a higher
proportion of expenditure on food and debt, a higher percentage of debt owned by high-risk
creditors such as money lenders, and a much higher average number of days lost per income-
generating member than non-vulnerable households. Interestingly, the average number of
household members was slightly lower for vulnerable than non-vulnerable households, and the
average age of household head was lower for vulnerable than non-vulnerable. In fact, there is clear
linear relationship between the age of household head and vulnerability, where increasing age is
associated with a commensurate decrease in vulnerability.
How does this profile compare with households classified as poor?
Taking our current criteria for classifying as household as poor( asset profile in the lowest quintile)
we can see that poor households have a similar profile compared with households classified as
vulnerable, with fewer household members, a higher percentage being female headed, a higher
percentage of households with members with disabilities or older persons, and a higher proportion
of income spent on food and debt servicing. The only noticeable differences are a narrowing of the
difference in percentage of debt owed to money-lenders and a much smaller difference in the
average days lost per income generating household member. This is an expected difference, given
the way that the vulnerability model is constructed. However, poor households had fewer
11. dependents than non-poor, although this difference disappeared when corrected for number of
household members.
Overall, this comparison indicates that the profile for poor and vulnerable households overlap
considerably, demonstrating that households identified as vulnerable are likely to be poor, and to
have the same profile as poor households, but that additionally, some non-poor households may be
identified by this model, which is precisely the purpose of the vulnerability model, being designed
to identify households ‘at risk’ of poverty as well as those already poor.
Table 7: Profile of households classified as poor
Poor Not
Household members (average) 3.9 5.3
Age of Household head 50.19 51.16
% female headed 35.6% 20.4%
% with person with disabilities 20.1% 16.3%
% with older person 18.1% 16.5%
Number of dependents 1.62 1.99
Average number of income sources 2.21 2.79
% expenditure on food 31.1% 32.4%
% expenditure on debt 14.7% 12.1%
% of debt owned by money lenders 25.0% 23.4%
average # land acres owned 0.64 2.14
Average days lost per income generating member to ill health 6.47 4.56
However, these two profiles also demonstrate the point being made earlier in the paper-that only a
proportion of households with persons with disabilities, older persons or female headed
households are poor or vulnerable.
Category % Poor % Vulnerable
Woman headed households 41 40
Households with PwD 29 45
Households with OP member 26 42
This demonstrates that although demographic profiling can have some value, it will still tend to
result in lower overall positive predictive value than multi-factorial vulnerability profiling.
How can the Umbrella Model be used to predict the likely impact of interventions
designed to reduce vulnerability?
We can also now turn to looking at the influence of different interventions on overall vulnerability
as a way of applying the model to predictive analysis. This essentially requires us to construct
theoretical models about how certain interventions (e.g. assisting vulnerable households to have an
additional livelihood) could impact overall vulnerability. This can be considered for all vulnerable
households, and also for targeting specific sub-groups (such as vulnerable households with persons
with disabilities). To do this, we need to first look and see if there are linear relationships between
any specific demographic factors and on vulnerability. Note that a lack of LINEAR relationship does
not mean that there is NO relationship between two factors. Linear relationship is a statistical
12. estimate of the extent to which changes in one (independent) variable will affect the other
(dependent) variable. If we establish that there is a linear relationship between a certain factor
(let’s say the education status of the household head) and another variable (say, decision making)
we may then need to see whether that relationship is linked to other factors (for example, gender of
household head). Using various tests of fit, we examined whether there was any statistically
significant linear associations between certain independent demographic variables and dependent
variables such as asset profile or decision making. In the overall sample, no such statistically
significant linear associations were demonstrated for a variety of demographic profiles, including
presence of a person with disabilities, older persons, female headed household, land tenure and
education status of household head. Now, as we said before, this does not mean that there is NO
association between these demographic factors and issues such as asset profile; but that if there is a
relationship, it is not linear. In other words, there is no matching increase (or decrease) in asset
profile for every increase in the household head education score, for example. However, using other
tests (which we will look at when we look at sub-groups) we may be able to show how the profile of
a certain group (e.g. households with persons with disabilities) is different from others-but for now,
we can say that any such difference cannot be expressed as a linear relationship.
The model can also be used to look at the possible impact of certain interventions on the overall
numbers of those considered vulnerable. We will look in more detail in the following chapters at
the potential impact of specifically targeted interventions (for example, health care for older
persons). Here, we will briefly look at the projected impact of two community-level interventions:
improved water supply and food banks. WE assume that improved water supply would result in a
reduction in water/sanitation related vulnerability by reducing the proportions of people who
spend large amounts of their time (or income) in obtaining water. If we assume that the impact of
improved water supply will be that in the target population, the maximum time required for
obtaining water would be 60 minutes, we can then consider how many households would still be
classified as ‘vulnerable’ even if water supply was OK-and hence, we can work out how many would
move from ‘vulnerable’ status if water supply was improved. In this case, if we applied a rule that
the maximum time taken for water supply was 60 minutes, we would see that overall, the number
of vulnerable households is reduced from 1206 to 955- a reduction of 5% (from 24.24% to
19.19%). Likewise, if we provided food banks in villages so that no household reported more than
one out of five food insecurity indicators, the overall reduction in vulnerable households would be
4.1%, from 24.24% to 20.14%. The model allows analysis of different combinations of
interventions, so that the overall effect is not simply summative (meaning that, if we combined
water/sanitation AND food banks, the overall effect would NOT be a 9.1% reduction).
By analyzing a key contributory factor to poverty (vulnerability to natural disaster and economic
shocks), this research demonstrates a method to allow more detailed analysis of the ‘pathways to
poverty’. These data demonstrate the usefulness of applying the Umbrella model to measuring
household vulnerability. Applying the model to a general rural population enabled accurate
mapping of vulnerability profiles, and differentiation according to demographic characteristics. By
doing so, the relative increase in vulnerability rates experienced by different types of households
can be demonstrated.. Furthermore, application of this model enables more detailed analysis of the
underlying contributory factors to household vulnerability, enabling more accurate planning and
monitoring of interventions designed to reduce vulnerability and associated poverty.
The Umbrella model has potential value for application in poverty reduction projects, by enabling
detailed analysis of categories and causes of vulnerability at household level, and enabling more
targeted interventions based on a more robust understanding of underlying contributory factors to
vulnerability. Given the flexibility of the model, allowing for the use of different indicators to better
reflect local conditions, the model can be applied in a variety of settings. However, this limits the
13. extent to which data from one area or country is comparable with data from another, and the model
remains at best a predictor of relative vulnerability of a given household or group of households as
compared to others within that same area. Our sample highlighted the need to experiment further
with indicators which better capture differences between households. This is particularly true of
the indicators used for debt and food security, which showed heavy clustering at one end of the
scale. The model requires more robust field testing in a variety of settings, and further research to
identify a wider pool of suitable indicators. Finally, the model would benefit from longitudinal
analysis of accuracy in predicting vulnerability, and in particular, to explore and identity more
substantive connections between vulnerability measurements and poverty.
i Townsend RM (1995) Consumption Insurance: An Evaluation of Risk-Bearing Systems in Low-Income Economies The Journal of
Economic Perspectives, Vol. 9, No. 3, pp. 83-102
ii Jalan J, Ravallion M (1998) Determinants of Transient and Chronic Poverty: Evidence from Rural China, Washington D.C.: World Bank.
iii McCulloch N, Baulch B (200) Simulating the impact of policy upon chronic and transitory poverty in rural Pakistan. East Sussex:
Institute of Development Studies
iv Kreimer A, Arnold A (2000) Managing Disaster Risk in Emerging Economies. World Bank: Washington DC
v Hahn M, Reiderer AM, Foster SO (2009) The Livelihood Vulnerability Index: A pragmatic approach to assessing risks from climate
variability and change—A case study in Mozambique. Global Environmental Change. 678
vi Griffiths M, Woods L (2009) Vulnerability Analysis: the Building Blocks for Successful Livelihood Intervention. UNOPS: Yangon
vii World Bank, 1997. Survey of living conditions: Uttar Pradesh and Bihar. Household Questionnaire, December 1997–March 1998.
viii Moser C (1998) Reassessing urban poverty reduction strategies: The asset vulnerability framework. World Development 26, No 1, pp
1-19
ix UNDP (2006) Integrated Household Living Conditions Analysis. Yangon: UNDP
x DHS (Demographic Health Survey), 2006. Measure DHS: model questionnaire with commentary. Basic Documentation, Number 2.
xi Griffiths M (2007) Economic Vulnerability Score: applications for Community Based Rehabilitation. Internal.