Download to read offline
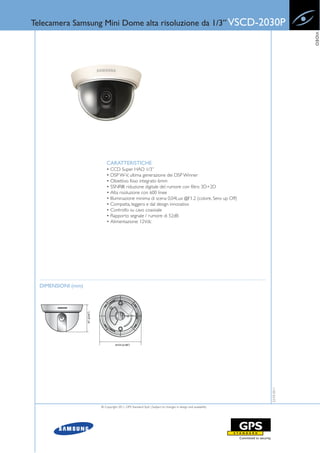
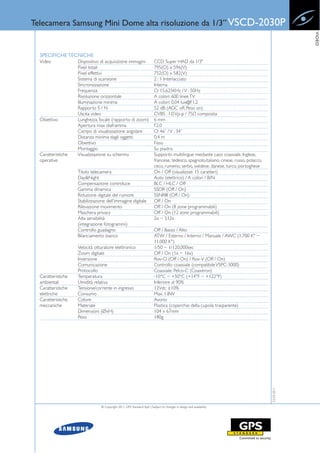

La telecamera Samsung mini dome VSC-D2030P è un dispositivo di alta risoluzione con un sensore CCD Super HAD da 1/3" e un obiettivo fisso da 6mm. Offre una risoluzione di 600 linee, illuminazione minima di 0,04 lux e numerose funzionalità come la riduzione digitale del rumore, rilevazione movimento e compensazione controluce. Compatibile con il controllo coassiale e operativa in diverse lingue, la telecamera ha dimensioni di 104x67 mm e un consumo massimo di 1,8W.


