![2. Related work: Visualization techniques & network modes
Visualization techniques
linear structures, hierarchies, networks, multi-dim. spaces, maps [Andrews 2002]
exploration environments for discovering relationships, data & document mining,
analyzing mass data-sets, creating visual awareness etc. [Fayyad et al. 2002]
Web 2.0: harnessing the collective intelligence of Digital Ecosystems (Facebook,
Google, Bing, Apple Stores, Mendeley, Flickr etc.)
Network modes
network visualization can “help users to
understand and manage the complexity of
large, structured hypermedia collections”
[Andrews 1998]
however, one-mode networks in most cases
(SNA, tag networks, citation networks etc.)
two-mode networks: bipartite graphs
e.g. ‘Deep South’ project [Davis et al. 1941]
21-23/11/2011 MEDES’11, San Francisco, 2011 4/11 , © role-project.eu](https://image.slidesharecdn.com/visualizingnetworkedcollaborationslides-120915164930-phpapp01/85/Visualizing-Networked-Collaboration-4-320.jpg)
![2. Related work: Pattern mining in networked structures
Network pattern: defined according to relations between nodes as well as
thresholds for metrics on nodes and edges (rules)
PALADIN [Klamma et al. 2006]: patterns in
social networks (roles like conversionalists
or trolls)
restricted to one-mode networks
gSpan [Yan & Han 2002]: performant
technique for graph-based substructure
pattern mining
not applicable for bipartite graphs
Blockmodeling approach [Dorejan et al. 2004]:
identifying patterns in k-partite graphs
very costly processing (not performant)
21-23/11/2011 MEDES’11, San Francisco, 2011 5/11 , © role-project.eu](https://image.slidesharecdn.com/visualizingnetworkedcollaborationslides-120915164930-phpapp01/85/Visualizing-Networked-Collaboration-5-320.jpg)
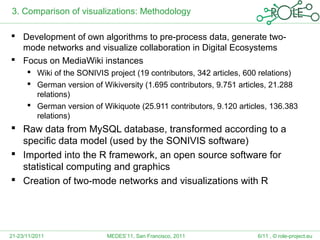

This document discusses using two-mode networks to analyze collaboration in digital ecosystems. It compares using one-mode vs two-mode networks, finding two-mode networks allow a more detailed analysis while avoiding information loss. The document applies this approach to wiki data, identifying collaboration patterns like "pioneers" and "community stars". It concludes two-mode networks can better define, identify, and visualize patterns of collaboration compared to one-mode networks.


![5G Explained! A High Level Overview [Introduction]](https://cdn.slidesharecdn.com/ss_thumbnails/5gexplainedahighleveloverview-260119165306-cc137a3e-thumbnail.jpg?width=640&height=640&fit=bounds)


