Title: Visualizing Machine Learning Models for Enhanced Financial Decision-Making and Risk Management
Authors: Ramakrishna Garine, Priyam Ganguly, Isha Mukherjee
Presented at: 2024 Third International Conference on Trends in Electrical, Electronics, and Computer Engineering (TEECCON)
Slide Summary:
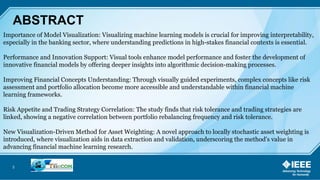
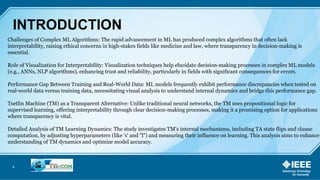
This presentation explores how visualization enhances the interpretability and reliability of machine learning (ML) models, especially in high-stakes environments like finance. The focus is on Tsetlin Machines (TM), an emerging ML algorithm that offers greater transparency through logical clause-based decisions. Key contributions include:
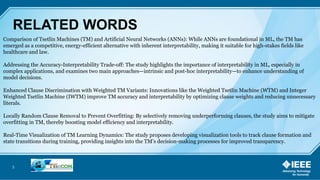
Interpretable AI for Financial Risk: The study introduces visualization tools that clarify how TMs make decisions, aiding trust and compliance in banking and financial sectors.
New Visualization-Driven Method: A novel clause-based approach is developed for stochastic asset weighting, improving portfolio management accuracy and insights.
Experiment on Noisy XOR Dataset: Achieved 100% accuracy using a TM model with 10 clauses per class, showcasing TM’s learning dynamics and hyperparameter sensitivity (s, T).
Performance Insights: Demonstrated how TM interpretability bridges the gap between training and real-world performance, making it suitable for financial forecasting and risk assessment.
Future Scope: Suggests enhancements like locally stochastic clause dropping to prevent overfitting and boost performance stability.
Impact & Relevance:
This research offers a transparent, efficient alternative to traditional neural networks, promoting ethical, explainable AI in finance. It aligns with Ramakrishna Garine’s broader body of work in AI-driven supply chain optimization and financial analytics—contributing to both academic research and industry transformation.


![9
REFERENCE
[1] M. G. P. Garcia, M. C. Medeiros, and G. F. R. Vasconcelos, “Real-time inflation forecasting with high-dimensional
models: The case of Brazil,” Int. J. Forecast., vol. 33, no. 3, pp. 679–693, Jul. 2017, doi: 10.1016/j.ijforecast.2017.02.002.
[2] J. Gui, Z. Sun, Y. Wen, D. Tao, and J. Ye, “A Review on Generative Adversarial Networks: Algorithms, Theory, and
Applications,” IEEE Trans. Knowl. Data Eng., 2021, doi: 10.1109/TKDE.2021.3130191.
[3] P. Orban et al., “Multisite generalizability of schizophrenia diagnosis classification based on functional brain
connectivity,” Schizophr. Res., vol. 192, pp. 167–171, Feb. 2018, doi: 10.1016/j.schres.2017.05.027.
[4] V. Feldman, A. McMillan, and K. Talwar, “Hiding among the Clones: A Simple and Nearly Optimal Analysis of Privacy
Amplification by Shuffling,” in Proceedings - Annual IEEE Symposium on Foundations of Computer Science, FOCS, IEEE Computer
Society, 2022, pp. 954–964. doi: 10.1109/FOCS52979.2021.00096.
[5] G. S. Kashyap, K. Malik, S. Wazir, and R. Khan, “Using Machine Learning to Quantify the Multimedia Risk Due to
Fuzzing,” Multimed. Tools Appl., vol. 81, no. 25, pp. 36685–36698, Oct. 2022, doi: 10.1007/s11042-021-11558-9.
[6] D. Forsberg, E. Sjöblom, and J. L. Sunshine, “Detection and Labeling of Vertebrae in MR Images Using Deep Learning
with Clinical Annotations as Training Data,” J. Digit. Imaging, vol. 30, no. 4, pp. 406–412, Aug. 2017, doi: 10.1007/s10278-017-9945-
x.
[7] X. E. Pantazi, D. Moshou, T. Alexandridis, R. L. Whetton, and A. M. Mouazen, “Wheat yield prediction using machine
learning and advanced sensing techniques,” Comput. Electron. Agric., vol. 121, pp. 57–65, 2016, doi: 10.1016/j.compag.2015.11.018.
[8] X. Zhong and D. Enke, “Predicting the daily return direction of the stock market using hybrid machine learning
algorithms,” Financ. Innov., vol. 5, no. 1, pp. 1–20, Dec. 2019, doi: 10.1186/s40854-019-0138-0.
[9] I. Eskinazi and B. J. Fregly, “Surrogate modeling of deformable joint contact using artificial neural networks,” Med.
Eng. Phys., vol. 37, no. 9, pp. 885–891, Sep. 2015, doi: 10.1016/j.medengphy.2015.06.006.
[10] Y. Jiang and C. Li, “MRMR-based feature selection for classification of cotton foreign matter using hyperspectral
imaging,” Comput. Electron. Agric., vol. 119, pp. 191–200, Nov. 2015, doi: 10.1016/j.compag.2015.10.017](https://image.slidesharecdn.com/teeconfinalpresentation-250418174613-d0e9fbed/85/Visualizing-Machine-Learning-Models-for-Enhanced-Financial-Decision-Making-and-Risk-Management-9-320.jpg)


![[DSC Adria 23]Davor Horvatic Human-Centric Explainable AI In Time Series Anal...](https://cdn.slidesharecdn.com/ss_thumbnails/davorhorvatichuman-centricexplainableaiintimeseriesanalysis-230530175842-db1ac2c3-thumbnail.jpg?width=640&height=640&fit=bounds)