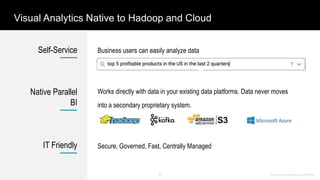
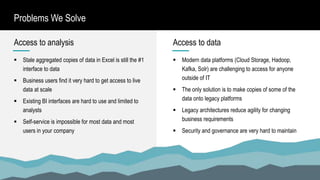
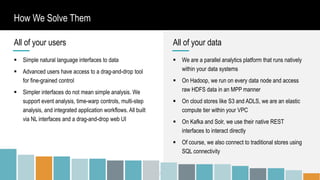
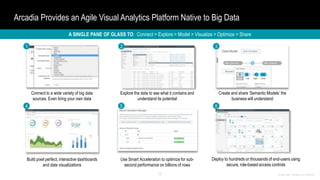
Arcadia Data. Proprietary and Confidential
Visualizing Geospatial Data at Scale
February 6, 2019
Arcadia Data. Proprietary and Confidential
2
Featured Speakers
Richard Tomlinson
Sr. Director, Product Management
Arcadia Data
Chris Toomey
Sales Engineer
Mapbox
Arcadia Data. Proprietary and Confidential
3
 If you have any questions along the way, please type them into the chat window.
 If you have audio problems, please chat us for help.
 A recording of this presentation will be sent to you in a few days.
 Please live tweet! @arcadiadata @Mapbox
Before We Begin Our Presentation
Arcadia Data. Proprietary and Confidential
4
Arcadia Data Mission: To Connect Business Users to Big Data
Founding team from Teradata Aster, HPE
3PAR, IBM DB2
Architected to solve challenges around big
data analytics
Growing customer base
in the Fortune 500
Investors
Strong Performer: Hadoop Native BI Wave Report.
“Put your BI where your data is”
Gartner names Arcadia Data a Cool Vendor for IoT Analytics.
Recent Awards
Customers
Dresner Advisory Services awards Arcadia Data the Tech Innovation Award for
top placement on Market Study report.
5 Arcadia Data. Proprietary and Confidential
Business users can easily analyze data
Works directly with data in your existing data platforms. Data never moves
into a secondary proprietary system.
Secure, Governed, Fast, Centrally Managed
Visual Analytics Native to Hadoop and Cloud
Self-Service
Native Parallel
BI
IT Friendly
Arcadia Data. Proprietary and Confidential6
 Stale aggregated copies of data in Excel is still the #1
interface to data
 Business users find it very hard to get access to live
data at scale
 Existing BI interfaces are hard to use and limited to
analysts
 Self-service is impossible for most data and most
users in your company
 Modern data platforms (Cloud Storage, Hadoop,
Kafka, Solr) are challenging to access for anyone
outside of IT
 The only solution is to make copies of some of the
data onto legacy platforms
 Legacy architectures reduce agility for changing
business requirements
 Security and governance are very hard to maintain
Problems We Solve
Access to analysis Access to data
Arcadia Data. Proprietary and Confidential7
 Simple natural language interfaces to data
 Advanced users have access to a drag-and-drop tool
for fine-grained control
 Simpler interfaces do not mean simple analysis. We
support event analysis, time-warp controls, multi-step
analysis, and integrated application workflows. All built
via NL interfaces and a drag-and-drop web UI
 We are a parallel analytics platform that runs natively
within your data systems
 On Hadoop, we run on every data node and access
raw HDFS data in an MPP manner
 On cloud stores like S3 and ADLS, we are an elastic
compute tier within your VPC
 On Kafka and Solr, we use their native REST
interfaces to interact directly
 Of course, we also connect to traditional stores using
SQL connectivity
How We Solve Them
All of your users All of your data
Arcadia Data. Proprietary and Confidential
Who is Mapbox?
Data Drives Market Disruption
Arcadia Data. Proprietary and Confidential99
Maps Search Navigation
Arcadia Data. Proprietary and Confidential10
 High Volume
 Multi-source
 Demand for Performance
 Narrative-driven
Mapbox for Data Visualization
10
Credit: The Pudding
Data Drives Market Disruption
Arcadia Data. Proprietary and Confidential11
Visualization Capabilities
- Data Driven Styling
- Customization
- Advanced Visuals
- Speed / Ease of Use
11
Arcadia Data. Proprietary and Confidential
Using Arcadia to Visualize “Big” Geospatial Data
Arcadia Data. Proprietary and Confidential13
Connect to a wide variety of big data
sources. Even bring your own data
Create and share ‘Semantic Models’ the
business will understand
Deploy to hundreds or thousands of end-users using
secure, role-based access controls
Use Smart Acceleration to optimize for sub-
second performance on billions of rows
Arcadia Provides an Agile Visual Analytics Platform Native to Big Data
Build pixel perfect, interactive dashboards
and data visualizations
A SINGLE PANE OF GLASS TO: Connect > Explore > Model > Visualize > Optimize > Share
Explore the data to see what it contains and
understand its potential
1 2 3
4 5 6
Arcadia Data. Proprietary and Confidential
Arcadia Connects Mapbox Directly to ‘Live’ Big Data
data
extract
s
data
extract
s
direct
querie
s
Legacy BI + Data Warehouse Legacy BI + Modern Data
Lake
Native BI + Modern Data
Lake
Extracts work well
with medium to
large data volumes
refreshed in batches
Arcadia runs directly where
the data resides. Can
process massive data
volumes in batch and real-
time
Legacy BI tools cannot
scale to massive data
volumes or real-time
creating an analytics
bottleneck
15 Arcadia Data. Proprietary and Confidential
Arcadia + Mapbox = Geospatial Data Visualization at High Scale
1st Class Technology Integration
 Connects Mapbox directly to ‘Live’
Big Data
 Visualize millions of shapes or
points, on petabytes of data
 Supports maps on real-time or
historical data
 Easy to integrate custom maps
from Mapbox Studio
 Fully interactive filtering, tool tips,
drill-down, etc
 Use local or remote Mapbox server
Arcadia Data. Proprietary and Confidential
Connected Drivers, Stores and Customers for Leading Pizza Restaurant
Chain
1. Connected Drivers
• Improve pizza sequencing
• Optimize delivery performance & fleet
management
• Improve driver safety and coaching
2. Connected Stores
• Improve demand shaping
• Share store learnings
• Active monitoring of holding areas – food &
safety
3. Connected Customers
• Deliver real-time and regional event marketing
• Improve marketing attribution
Arcadia Data. Proprietary and Confidential
Blending Real-Time and Historical Data to Optimize Pizza Delivery
17
Sales and Marketing Data Warehouse Customer 360 Data
Lake
Kafka Topics
Real-Time Store
& Driver Data
ARCADI
A
ARCADI
A
ARCADI
A
ARCADI
A
Real-Time &
Historical
Dashboards
Arcadia Data. Proprietary and Confidential
Geographic Micro-Segmentation for Leading Marketing Solutions Provider
18
 Use Case
 Allow customers to define and monitor micro-segments at postal
carrier route and census block level
 Approx. ~600K carrier routes and 11M census blocks in US
 Micro-segments based on consumer demographics and behavioral
metrics
 Ability to drill to full detail show history for any individual postal carrier
route or census block
 Solution
 Developed custom Mapbox styles based on large GeoJSON shape
files
 Use Hadoop and Arcadia engine to store and compute granular
demographic and behavioral metrics
 Display results on shaded Choropleth maps in Arcadia dashboards
with ability to select and group multiple shapes and drill down on any
individual shape
Arcadia Data. Proprietary and Confidential
Demo
Arcadia Data. Proprietary and Confidential
20
Thank You!
Be sure to also visit:
Try Arcadia Instant (free download).
https://www.arcadiadata.com/instant
Read Arcadia Data blog posts.
https://www.arcadiadata.com/blog
Sign up for a free Mapbox account.
https://www.mapbox.com/signup
Read about Mapbox’s
data visualization capabilities.
https://blog.mapbox.com/data-visualization/home
@arcadiadata @Mapbox

Visualizing Geospatial Data at Scale

  • 1.
    Arcadia Data. Proprietaryand Confidential Visualizing Geospatial Data at Scale February 6, 2019
  • 2.
    Arcadia Data. Proprietaryand Confidential 2 Featured Speakers Richard Tomlinson Sr. Director, Product Management Arcadia Data Chris Toomey Sales Engineer Mapbox
  • 3.
    Arcadia Data. Proprietaryand Confidential 3  If you have any questions along the way, please type them into the chat window.  If you have audio problems, please chat us for help.  A recording of this presentation will be sent to you in a few days.  Please live tweet! @arcadiadata @Mapbox Before We Begin Our Presentation
  • 4.
    Arcadia Data. Proprietaryand Confidential 4 Arcadia Data Mission: To Connect Business Users to Big Data Founding team from Teradata Aster, HPE 3PAR, IBM DB2 Architected to solve challenges around big data analytics Growing customer base in the Fortune 500 Investors Strong Performer: Hadoop Native BI Wave Report. “Put your BI where your data is” Gartner names Arcadia Data a Cool Vendor for IoT Analytics. Recent Awards Customers Dresner Advisory Services awards Arcadia Data the Tech Innovation Award for top placement on Market Study report.
  • 5.
    5 Arcadia Data.Proprietary and Confidential Business users can easily analyze data Works directly with data in your existing data platforms. Data never moves into a secondary proprietary system. Secure, Governed, Fast, Centrally Managed Visual Analytics Native to Hadoop and Cloud Self-Service Native Parallel BI IT Friendly
  • 6.
    Arcadia Data. Proprietaryand Confidential6  Stale aggregated copies of data in Excel is still the #1 interface to data  Business users find it very hard to get access to live data at scale  Existing BI interfaces are hard to use and limited to analysts  Self-service is impossible for most data and most users in your company  Modern data platforms (Cloud Storage, Hadoop, Kafka, Solr) are challenging to access for anyone outside of IT  The only solution is to make copies of some of the data onto legacy platforms  Legacy architectures reduce agility for changing business requirements  Security and governance are very hard to maintain Problems We Solve Access to analysis Access to data
  • 7.
    Arcadia Data. Proprietaryand Confidential7  Simple natural language interfaces to data  Advanced users have access to a drag-and-drop tool for fine-grained control  Simpler interfaces do not mean simple analysis. We support event analysis, time-warp controls, multi-step analysis, and integrated application workflows. All built via NL interfaces and a drag-and-drop web UI  We are a parallel analytics platform that runs natively within your data systems  On Hadoop, we run on every data node and access raw HDFS data in an MPP manner  On cloud stores like S3 and ADLS, we are an elastic compute tier within your VPC  On Kafka and Solr, we use their native REST interfaces to interact directly  Of course, we also connect to traditional stores using SQL connectivity How We Solve Them All of your users All of your data
  • 8.
    Arcadia Data. Proprietaryand Confidential Who is Mapbox?
  • 9.
    Data Drives MarketDisruption Arcadia Data. Proprietary and Confidential99 Maps Search Navigation
  • 10.
    Arcadia Data. Proprietaryand Confidential10  High Volume  Multi-source  Demand for Performance  Narrative-driven Mapbox for Data Visualization 10 Credit: The Pudding
  • 11.
    Data Drives MarketDisruption Arcadia Data. Proprietary and Confidential11 Visualization Capabilities - Data Driven Styling - Customization - Advanced Visuals - Speed / Ease of Use 11
  • 12.
    Arcadia Data. Proprietaryand Confidential Using Arcadia to Visualize “Big” Geospatial Data
  • 13.
    Arcadia Data. Proprietaryand Confidential13 Connect to a wide variety of big data sources. Even bring your own data Create and share ‘Semantic Models’ the business will understand Deploy to hundreds or thousands of end-users using secure, role-based access controls Use Smart Acceleration to optimize for sub- second performance on billions of rows Arcadia Provides an Agile Visual Analytics Platform Native to Big Data Build pixel perfect, interactive dashboards and data visualizations A SINGLE PANE OF GLASS TO: Connect > Explore > Model > Visualize > Optimize > Share Explore the data to see what it contains and understand its potential 1 2 3 4 5 6
  • 14.
    Arcadia Data. Proprietaryand Confidential Arcadia Connects Mapbox Directly to ‘Live’ Big Data data extract s data extract s direct querie s Legacy BI + Data Warehouse Legacy BI + Modern Data Lake Native BI + Modern Data Lake Extracts work well with medium to large data volumes refreshed in batches Arcadia runs directly where the data resides. Can process massive data volumes in batch and real- time Legacy BI tools cannot scale to massive data volumes or real-time creating an analytics bottleneck
  • 15.
    15 Arcadia Data.Proprietary and Confidential Arcadia + Mapbox = Geospatial Data Visualization at High Scale 1st Class Technology Integration  Connects Mapbox directly to ‘Live’ Big Data  Visualize millions of shapes or points, on petabytes of data  Supports maps on real-time or historical data  Easy to integrate custom maps from Mapbox Studio  Fully interactive filtering, tool tips, drill-down, etc  Use local or remote Mapbox server
  • 16.
    Arcadia Data. Proprietaryand Confidential Connected Drivers, Stores and Customers for Leading Pizza Restaurant Chain 1. Connected Drivers • Improve pizza sequencing • Optimize delivery performance & fleet management • Improve driver safety and coaching 2. Connected Stores • Improve demand shaping • Share store learnings • Active monitoring of holding areas – food & safety 3. Connected Customers • Deliver real-time and regional event marketing • Improve marketing attribution
  • 17.
    Arcadia Data. Proprietaryand Confidential Blending Real-Time and Historical Data to Optimize Pizza Delivery 17 Sales and Marketing Data Warehouse Customer 360 Data Lake Kafka Topics Real-Time Store & Driver Data ARCADI A ARCADI A ARCADI A ARCADI A Real-Time & Historical Dashboards
  • 18.
    Arcadia Data. Proprietaryand Confidential Geographic Micro-Segmentation for Leading Marketing Solutions Provider 18  Use Case  Allow customers to define and monitor micro-segments at postal carrier route and census block level  Approx. ~600K carrier routes and 11M census blocks in US  Micro-segments based on consumer demographics and behavioral metrics  Ability to drill to full detail show history for any individual postal carrier route or census block  Solution  Developed custom Mapbox styles based on large GeoJSON shape files  Use Hadoop and Arcadia engine to store and compute granular demographic and behavioral metrics  Display results on shaded Choropleth maps in Arcadia dashboards with ability to select and group multiple shapes and drill down on any individual shape
  • 19.
    Arcadia Data. Proprietaryand Confidential Demo
  • 20.
    Arcadia Data. Proprietaryand Confidential 20 Thank You! Be sure to also visit: Try Arcadia Instant (free download). https://www.arcadiadata.com/instant Read Arcadia Data blog posts. https://www.arcadiadata.com/blog Sign up for a free Mapbox account. https://www.mapbox.com/signup Read about Mapbox’s data visualization capabilities. https://blog.mapbox.com/data-visualization/home @arcadiadata @Mapbox

Editor's Notes

  • #9 Update all slides with title case on titles, other style guide updates.
  • #10 Mapbox is a location platform that helps developers build with location data, on any platform, at scale. At the the highest level, we provide SDKs and APIs around three core capabilities Maps: This includes data to power maps, like our globally curated set of political, statistical, and administrative boundaries; our GL rendering engine for smooth maps on any device; and Studio, our photoshop for map design Search: Forward and Reverse Geocoding across the world from countries down to POIs Navigation: Traffic aware routing, trip optimization, isochrones, and matrix calculations
  • #11 These days, it’s become cliche to say that data volumes have exploded. But the fact remains that the amount of data available to individuals and companies is staggering. Not only is it large, it’s growing The number of sources that are generating this information are diversifying, and we all need tools to interact with it For better or worse, in the data analytics and visualization space - performance is king. We all need to make decisions in our daily lives, business need to know what products to sell, which ads to show; individuals want to know which routes to take home or where the next hottest restaurant is. But we need to know that all at the speed of thought. Furthermore, analytics is becoming more narrative driven. Not just stories - but context. Bringing these multiple sources of data together to find insight where there wasn’t before. And increasingly, the core shared context is location. Here’s a great example from from the storytellers at The Pudding here is simply aggregating the number of people who live around the world - that’s 6 billion people rendered into a zoom-based grid, so you can SEE and explore the world around you and how it has changed over time. All built with Mapbox. Let me talk a little more about these capabilities.
  • #12 When it comes to Mapbox, we hang our hat on some core capabilities First: Data driven styling. We want your maps and applications to be tightly coupled with your data, and make it easy for you to bring it to life. Every data update and interaction in Mapbox is tied to your visualization, so your data is front-and-center. A great example of this is from the NYT. They created the most detailed look at the 2016 election ever done, and brought it to life with data driven styling. Second: customization: Mapbox provides you with a tool called Mapbox studio, which allows you to hone your map style, combining our data with your data to make base maps that are on brand and optimized for your visualizations. Then in less than 5 lines of code you can begin adding more data, adding tooltips, and even other location-enabled features to visualize and add context into your visualizations. Take the FCC - this map is the results of the national broadband survey. It’s built on a data-viz-designed baseman, and data down to the census block. It allows you to search, using the Mapbox geocoder, and find your own census block to discover how many or how few broadband providers are where you live. It’s a high volume, high-impact application - that while using a basic choropleth visualization, brings a great deal of context and focus to an important analysis. Third: Advanced visuals. All maps can do dots and polygons, but Mapbox allows you to extend that into clusters, heat maps, or even more advanced grids and 3d extrusions. All out of the box. The example we saw before uses a custom-designed grid that Mapbox renders on the fly - or even something as advanced as a live wind map. And across all of them is performance - your maps will render at 60 frames per second. While Mapbox provides you all of these capabilities, one of the challenges is how to bring that data to the map, how to process it so it can be visualized, but without pre-aggregating or writing complex APIs and queries. And that’s where Arcadia comes in, and now is when I hand it off to Richard so he can tell you more about the Arcadia platform.
  • #13 Update all slides with title case on titles, other style guide updates.
  • #17 Cool Forrester Enterprise
  • #20 Update all slides with title case on titles, other style guide updates.