Downloaded 17 times


![Creating a chart
Apply
it
to
a
DOM
element
var
mySedng
=
{
width:
300,
height:
300,
Canvas
:
chart
{
type:'StackedAreaChart',
…
},
chart:
data
{
model:
[
{label:
'Column
A'},
…
],
data:
strata
[
[
{initValue:
100,
label:
'Bar
A'}
],
…
],
strata:
stream
{
stream:
provider:
'generator',
refresh:
10000/4}
},
sedimenta-on
{
sedimentaFon:
token:
{
size:
{
original:
6,
minimum:
2
}},
aggregaFon:
{
type:'stacked’
},
suspension:
{
decay:
{power:
1.01
}},
flocculaFon:
{...}
},
};
var
myChart
=
$("#myDivChartContainer”).vs(mySedng);
22](https://image.slidesharecdn.com/visual-sedimentationv15-131022071643-phpapp02/85/Visual-sedimentation-IEEE-VIS-2013-Atlanta-22-320.jpg)


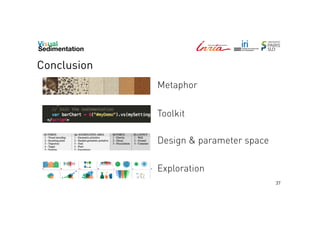


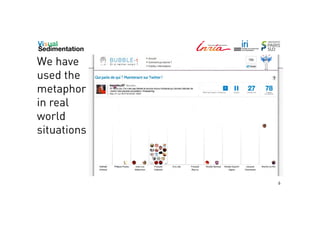
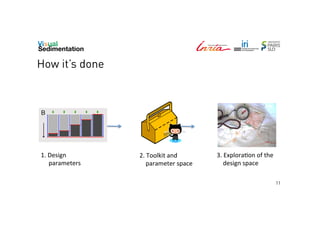
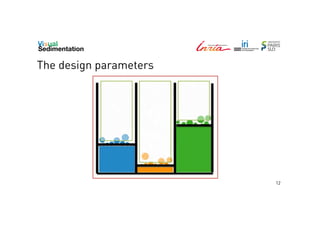
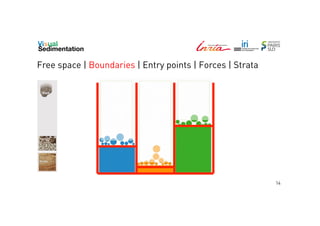
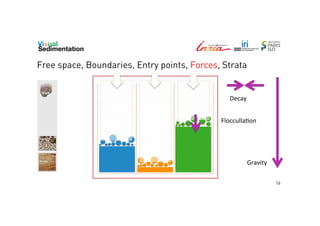
The document discusses the challenges of visualizing streaming data, including how to represent incoming data and manage update rates. It introduces a metaphor of visual sedimentation to enhance data representation and describes a toolkit developed for creating visualizations using this concept. The document emphasizes the importance of design parameters and the usability of the open-source toolkit available on GitHub.