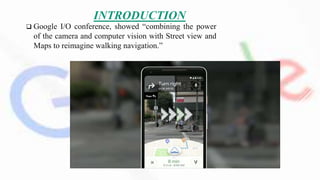
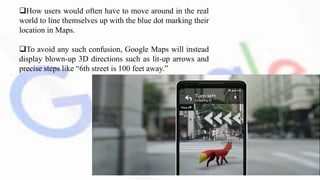
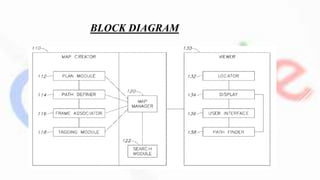
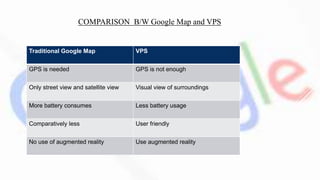
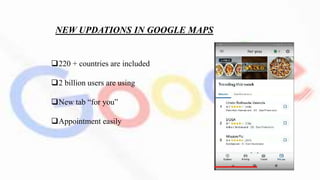
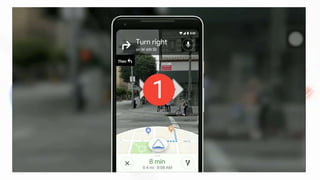
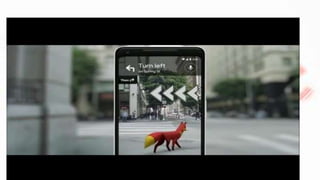
This document summarizes Google's new Visual Positioning System (VPS) navigation feature for Google Maps. It works by using the camera and computer vision to display augmented reality directions like lit-up arrows instead of relying solely on GPS. The summary compares traditional Google Maps navigation to VPS, noting that VPS does not require GPS, uses less battery, and provides a more user-friendly visual view of surroundings. It also provides a brief history of Google Maps and how the new feature works by pointing the camera where you need to go to see relevant navigation information.
Project Loon is a research and development project being developed by Google
Project loon is a network of balloon Travelling on edge of space , designed to connect with the people In Rural and Remote areas.
Google Glass is a wearable computer with an optical head-mounted display (OHMD) that is being developed by Google in the Project Glass research and development project.
It includes voice-controlled Android device that resembles a pair of eyeglasses and displays information directly in the user's field of vision.It offers an augmented reality experience by using visual, audio and location-based inputs to provide relevant information.
Global Positioning System (GPS) is the only system today able to show one’s own position on the earth any time in any weather, anywhere. This paper addresses this satellite based navigation system at length. The different segments of GPS viz. space segment, control segment, user segment are discussed. In addition, how this amazing system GPS works, is clearly described. The various errors that degrade the performance of GPS are also included. DIFFERENTIAL GPS, which is used to improve the accuracy of measurements, is also studied. The need, working and implementation of DGPS are discussed at length. Finally, the paper ends with advanced application of GPS.
Pill camera is an application of nanotechnology used in medicine to diagnose the disease particularly the small intestine and it is an alternative to endoscopy.
Augmented reality is a live, copy, view of a physical, real-world environment whose elements are augmented by computer-generated sensory input such as sound, video, graphics or GPS data.
Digital image processing focuses on two major tasks
-Improvement of pictorial information for human interpretation
-Processing of image data for storage, transmission and representation for autonomous machine perception
Emergency medical response in India is lagging behind other countries. This is partially because of lack of technology implementation at ground zero. To address the issue, we are introducing smart ambulance system. It would take India to competitive position in emergency services around the globe. Over the last few years there is a revolutionary development in the field of Internet of Things (IoT).
Google Maps is a web mapping service developed by Google. Google Maps began as a C++ desktop program designed by Lars and Jens Eilstrup Rasmussen at Where 2 Technologies. More information the visit :- https://abhiandroid.com/programming/googlemaps
The web offers many free tools for basic geographic analysis and visualization. Steve Schild, GIS Manager at the Rutland Regional Planning Commission, highlights the best in this slideshow.
The web offers many free tools for basic GIS analysis and visualization. Steve Schild, GIS Manager at the Rutland Regional Planning Commission, highlights the best in this slideshow.
SII-PIV 54 Spatial and Environmental Injury Surveillance, based on Cape Town, South Africa. So what is the project about? It is about seeing if we can use the geospatial web to work with trauma surgeons, nurses, health officials, to represent trauma injury data in a useful way. It is very informal due to working with coarse data, poor and dangerous neighbourhoods. We focus on ‘one on one’ interactions between the user and the application. And lastly, we hope that these tools will be practical in the health world.
What are Google maps and Way use anyway
History behind the Google maps
What difference dose it make to us Advantages and loose of using Google Maps
Trends in the usage of googol map API
Basic concept of an API
Some practical examples of Google maps real time , time reversal , cause
References
A Comparison of Online Map Services, Map development, and some Web & GPS tools.
Topics: Classic vs. the New Google Maps and other online map services, developing custom maps with Google Maps JavaScript API, mashups, and a few related Google services tidbits like how to host web pages directly from Google Drive. More info: http://bit.ly/1FDNF99
Lepton Software is a Premier Google Maps partner in India, Middle East and Singapore who has supported 500+ companies in their growth journey since its inception. Lepton is leader in Location Analytics, Map Data and Geospatial consulting practise across multiple business verticals such as Telecom, FMCG, Logistics & Transportation, Govt. , Retail, IT and Automotive etc.
JMeter webinar - integration with InfluxDB and GrafanaRTTS
Watch this recorded webinar about real-time monitoring of application performance. See how to integrate Apache JMeter, the open-source leader in performance testing, with InfluxDB, the open-source time-series database, and Grafana, the open-source analytics and visualization application.
In this webinar, we will review the benefits of leveraging InfluxDB and Grafana when executing load tests and demonstrate how these tools are used to visualize performance metrics.
Length: 30 minutes
Session Overview
-------------------------------------------
During this webinar, we will cover the following topics while demonstrating the integrations of JMeter, InfluxDB and Grafana:
- What out-of-the-box solutions are available for real-time monitoring JMeter tests?
- What are the benefits of integrating InfluxDB and Grafana into the load testing stack?
- Which features are provided by Grafana?
- Demonstration of InfluxDB and Grafana using a practice web application
To view the webinar recording, go to:
https://www.rttsweb.com/jmeter-integration-webinar
Transcript: Selling digital books in 2024: Insights from industry leaders - T...BookNet Canada
The publishing industry has been selling digital audiobooks and ebooks for over a decade and has found its groove. What’s changed? What has stayed the same? Where do we go from here? Join a group of leading sales peers from across the industry for a conversation about the lessons learned since the popularization of digital books, best practices, digital book supply chain management, and more.
Link to video recording: https://bnctechforum.ca/sessions/selling-digital-books-in-2024-insights-from-industry-leaders/
Presented by BookNet Canada on May 28, 2024, with support from the Department of Canadian Heritage.
Neuro-symbolic is not enough, we need neuro-*semantic*Frank van Harmelen
Neuro-symbolic (NeSy) AI is on the rise. However, simply machine learning on just any symbolic structure is not sufficient to really harvest the gains of NeSy. These will only be gained when the symbolic structures have an actual semantics. I give an operational definition of semantics as “predictable inference”.
All of this illustrated with link prediction over knowledge graphs, but the argument is general.
DevOps and Testing slides at DASA ConnectKari Kakkonen
My and Rik Marselis slides at 30.5.2024 DASA Connect conference. We discuss about what is testing, then what is agile testing and finally what is Testing in DevOps. Finally we had lovely workshop with the participants trying to find out different ways to think about quality and testing in different parts of the DevOps infinity loop.
Key Trends Shaping the Future of Infrastructure.pdfCheryl Hung
Keynote at DIGIT West Expo, Glasgow on 29 May 2024.
Cheryl Hung, ochery.com
Sr Director, Infrastructure Ecosystem, Arm.
The key trends across hardware, cloud and open-source; exploring how these areas are likely to mature and develop over the short and long-term, and then considering how organisations can position themselves to adapt and thrive.
UiPath Test Automation using UiPath Test Suite series, part 4DianaGray10
Welcome to UiPath Test Automation using UiPath Test Suite series part 4. In this session, we will cover Test Manager overview along with SAP heatmap.
The UiPath Test Manager overview with SAP heatmap webinar offers a concise yet comprehensive exploration of the role of a Test Manager within SAP environments, coupled with the utilization of heatmaps for effective testing strategies.
Participants will gain insights into the responsibilities, challenges, and best practices associated with test management in SAP projects. Additionally, the webinar delves into the significance of heatmaps as a visual aid for identifying testing priorities, areas of risk, and resource allocation within SAP landscapes. Through this session, attendees can expect to enhance their understanding of test management principles while learning practical approaches to optimize testing processes in SAP environments using heatmap visualization techniques
What will you get from this session?
1. Insights into SAP testing best practices
2. Heatmap utilization for testing
3. Optimization of testing processes
4. Demo
Topics covered:
Execution from the test manager
Orchestrator execution result
Defect reporting
SAP heatmap example with demo
Speaker:
Deepak Rai, Automation Practice Lead, Boundaryless Group and UiPath MVP
State of ICS and IoT Cyber Threat Landscape Report 2024 previewPrayukth K V
The IoT and OT threat landscape report has been prepared by the Threat Research Team at Sectrio using data from Sectrio, cyber threat intelligence farming facilities spread across over 85 cities around the world. In addition, Sectrio also runs AI-based advanced threat and payload engagement facilities that serve as sinks to attract and engage sophisticated threat actors, and newer malware including new variants and latent threats that are at an earlier stage of development.
The latest edition of the OT/ICS and IoT security Threat Landscape Report 2024 also covers:
State of global ICS asset and network exposure
Sectoral targets and attacks as well as the cost of ransom
Global APT activity, AI usage, actor and tactic profiles, and implications
Rise in volumes of AI-powered cyberattacks
Major cyber events in 2024
Malware and malicious payload trends
Cyberattack types and targets
Vulnerability exploit attempts on CVEs
Attacks on counties – USA
Expansion of bot farms – how, where, and why
In-depth analysis of the cyber threat landscape across North America, South America, Europe, APAC, and the Middle East
Why are attacks on smart factories rising?
Cyber risk predictions
Axis of attacks – Europe
Systemic attacks in the Middle East
Download the full report from here:
https://sectrio.com/resources/ot-threat-landscape-reports/sectrio-releases-ot-ics-and-iot-security-threat-landscape-report-2024/
Accelerate your Kubernetes clusters with Varnish CachingThijs Feryn
A presentation about the usage and availability of Varnish on Kubernetes. This talk explores the capabilities of Varnish caching and shows how to use the Varnish Helm chart to deploy it to Kubernetes.
This presentation was delivered at K8SUG Singapore. See https://feryn.eu/presentations/accelerate-your-kubernetes-clusters-with-varnish-caching-k8sug-singapore-28-2024 for more details.
Connector Corner: Automate dynamic content and events by pushing a buttonDianaGray10
Here is something new! In our next Connector Corner webinar, we will demonstrate how you can use a single workflow to:
Create a campaign using Mailchimp with merge tags/fields
Send an interactive Slack channel message (using buttons)
Have the message received by managers and peers along with a test email for review
But there’s more:
In a second workflow supporting the same use case, you’ll see:
Your campaign sent to target colleagues for approval
If the “Approve” button is clicked, a Jira/Zendesk ticket is created for the marketing design team
But—if the “Reject” button is pushed, colleagues will be alerted via Slack message
Join us to learn more about this new, human-in-the-loop capability, brought to you by Integration Service connectors.
And...
Speakers:
Akshay Agnihotri, Product Manager
Charlie Greenberg, Host
GraphRAG is All You need? LLM & Knowledge GraphGuy Korland
Guy Korland, CEO and Co-founder of FalkorDB, will review two articles on the integration of language models with knowledge graphs.
1. Unifying Large Language Models and Knowledge Graphs: A Roadmap.
https://arxiv.org/abs/2306.08302
2. Microsoft Research's GraphRAG paper and a review paper on various uses of knowledge graphs:
https://www.microsoft.com/en-us/research/blog/graphrag-unlocking-llm-discovery-on-narrative-private-data/
LF Energy Webinar: Electrical Grid Modelling and Simulation Through PowSyBl -...DanBrown980551
Do you want to learn how to model and simulate an electrical network from scratch in under an hour?
Then welcome to this PowSyBl workshop, hosted by Rte, the French Transmission System Operator (TSO)!
During the webinar, you will discover the PowSyBl ecosystem as well as handle and study an electrical network through an interactive Python notebook.
PowSyBl is an open source project hosted by LF Energy, which offers a comprehensive set of features for electrical grid modelling and simulation. Among other advanced features, PowSyBl provides:
- A fully editable and extendable library for grid component modelling;
- Visualization tools to display your network;
- Grid simulation tools, such as power flows, security analyses (with or without remedial actions) and sensitivity analyses;
The framework is mostly written in Java, with a Python binding so that Python developers can access PowSyBl functionalities as well.
What you will learn during the webinar:
- For beginners: discover PowSyBl's functionalities through a quick general presentation and the notebook, without needing any expert coding skills;
- For advanced developers: master the skills to efficiently apply PowSyBl functionalities to your real-world scenarios.
Epistemic Interaction - tuning interfaces to provide information for AI supportAlan Dix
Paper presented at SYNERGY workshop at AVI 2024, Genoa, Italy. 3rd June 2024
https://alandix.com/academic/papers/synergy2024-epistemic/
As machine learning integrates deeper into human-computer interactions, the concept of epistemic interaction emerges, aiming to refine these interactions to enhance system adaptability. This approach encourages minor, intentional adjustments in user behaviour to enrich the data available for system learning. This paper introduces epistemic interaction within the context of human-system communication, illustrating how deliberate interaction design can improve system understanding and adaptation. Through concrete examples, we demonstrate the potential of epistemic interaction to significantly advance human-computer interaction by leveraging intuitive human communication strategies to inform system design and functionality, offering a novel pathway for enriching user-system engagements.
3. INTRODUCTION
Google I/O conference, showed “combining the power
of the camera and computer vision with Street view and
Maps to reimagine walking navigation.”
4. How users would often have to move around in the real
world to line themselves up with the blue dot marking their
location in Maps.
To avoid any such confusion, Google Maps will instead
display blown-up 3D directions such as lit-up arrows and
precise steps like “6th street is 100 feet away.”
5. HISTORY
Google Maps first started as a C++ program
designed by two Danish brothers, Lars and Jens
Eilstrup Rasmussen.
The application was first announced on the
Google Blog on February 8, 2005 and was located
at Google.
In September 2005 , Google Maps quickly
updated its satellite imagery to allow users to view
the extent of the flooding in various parts of that
city.
6. In October 2009 their team introduced US version of Maps and use their
own data.
On January 29, 2013, Google Maps was updated to include a map of North
Korea
On June 27, 2016, Google rolled out new satellite imagery worldwide
sourced from Landsat 8, comprising over 700 trillion pixels of new data
May 2018 Google announced major changes to the API structure
Aparna Chennapragada introduced one of the best new features: visual
guidance and Visual Positioning System in Google Maps Navigation.
7. HOW IT WORKS
Tap a button to activate visual view .
It just point your camera where you
need to go to see relevant info.
Arrows pointing you in the direction
you need to go, with a small map at the
bottom to remind you where you are
headed.
8. Finally, the Maps team has also been experimenting with a digital
avatar
That can help further guide users, with a cartoon fox shown off as
an example.
A smaller version of the traditional Maps experience will be
displayed on the lower half of the screen, should it be needed.
It would automatically highlight points of interest nearby, such as
cafés or retail stores.
The data retrieve under the Google lens technology ‘smart
selection’ .
10. Traditional Google Map VPS
GPS is needed GPS is not enough
Only street view and satellite view Visual view of surroundings
More battery consumes Less battery usage
Comparatively less User friendly
No use of augmented reality Use augmented reality
COMPARISON B/W Google Map and VPS
11. NEW UPDATIONS IN GOOGLE MAPS
220 + countries are included
2 billion users are using
New tab “for you”
Appointment easily
14. CONCLUSION
Technology is deeply influenced in our daily life. Visual
positioning system replace the Google maps. Google is
“combining the power of the camera and computer vision with
Street view and Maps to re imagine walking navigation.” and
also use the benefits of augmented reality.