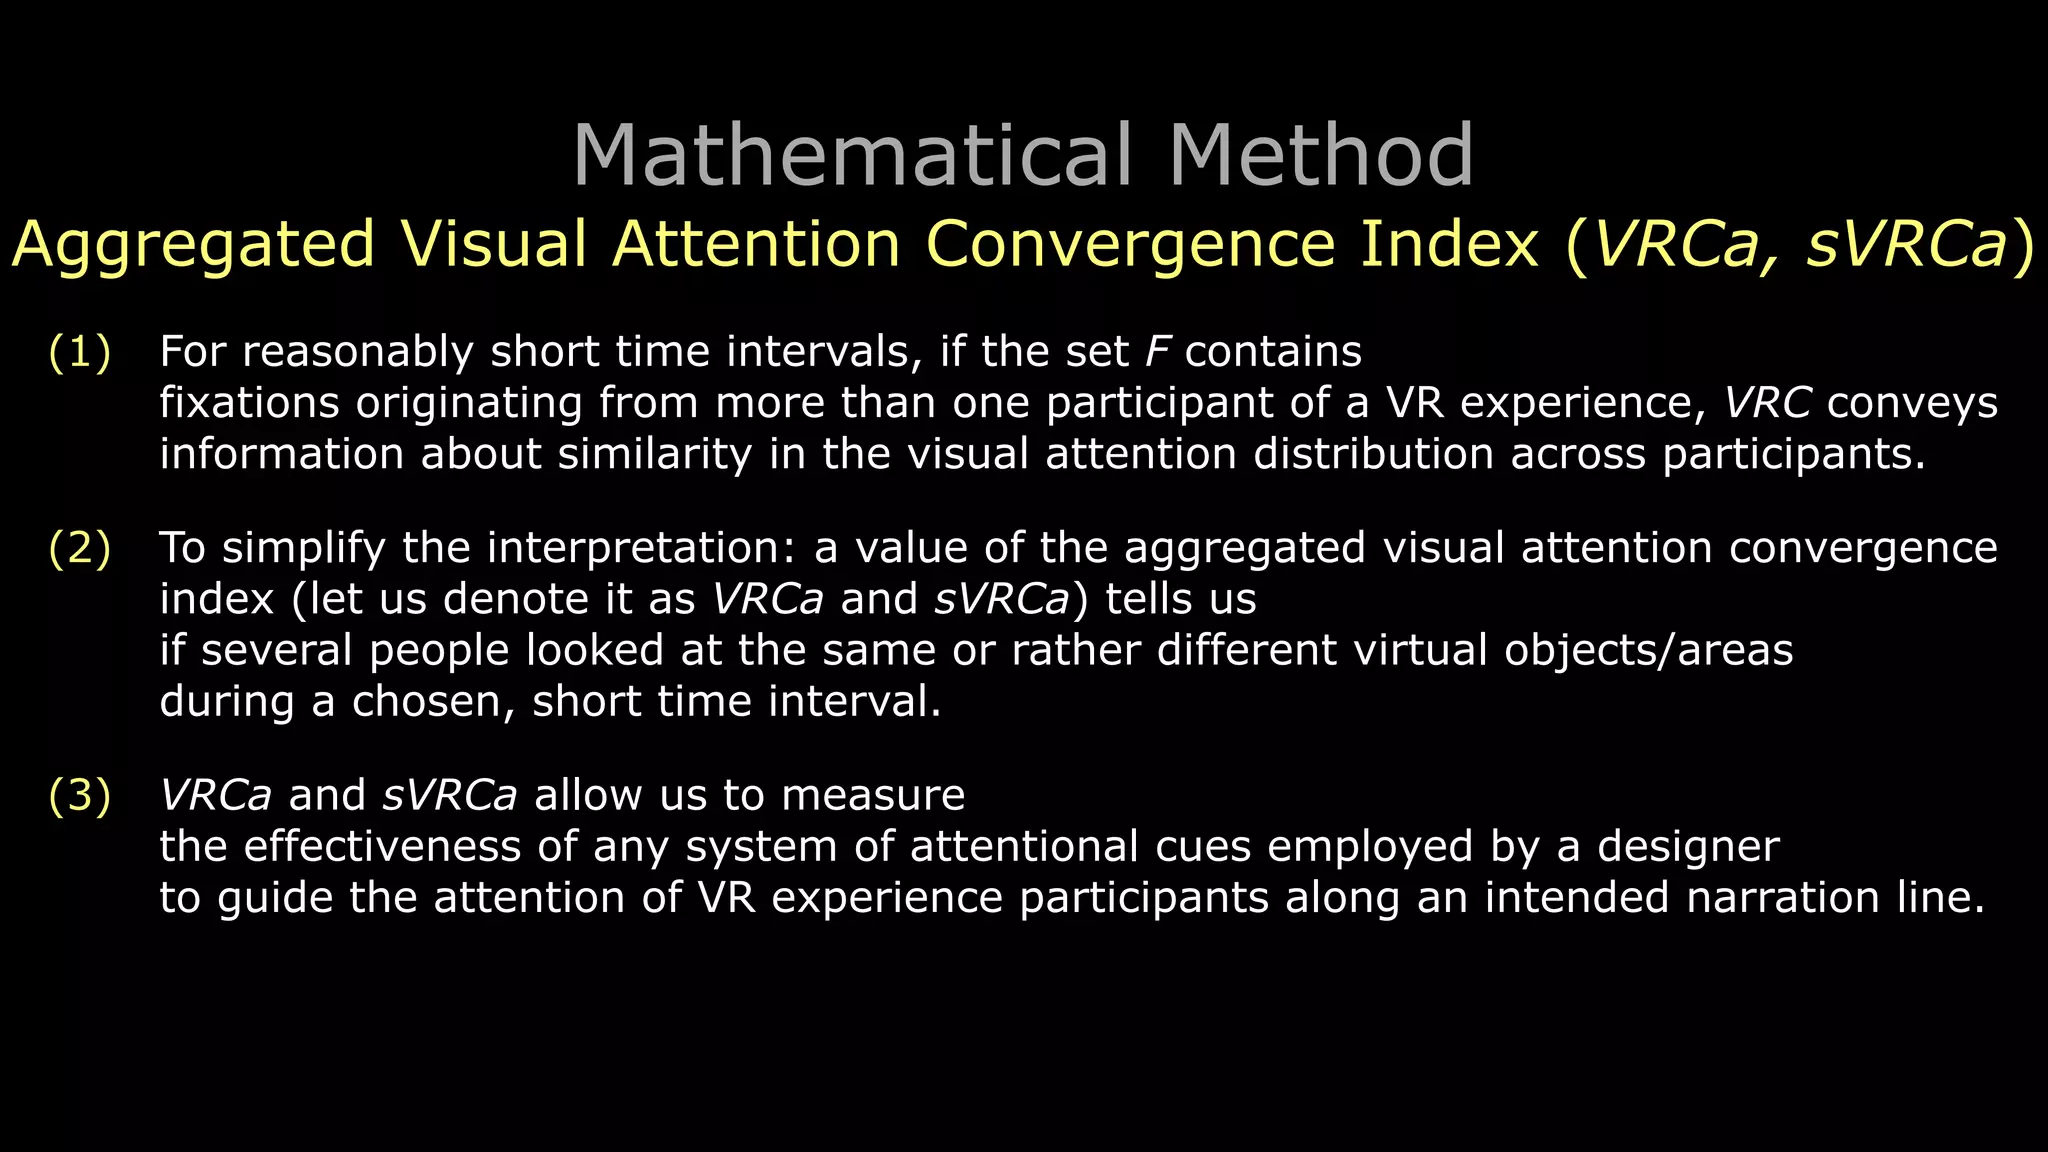
Download to read offline
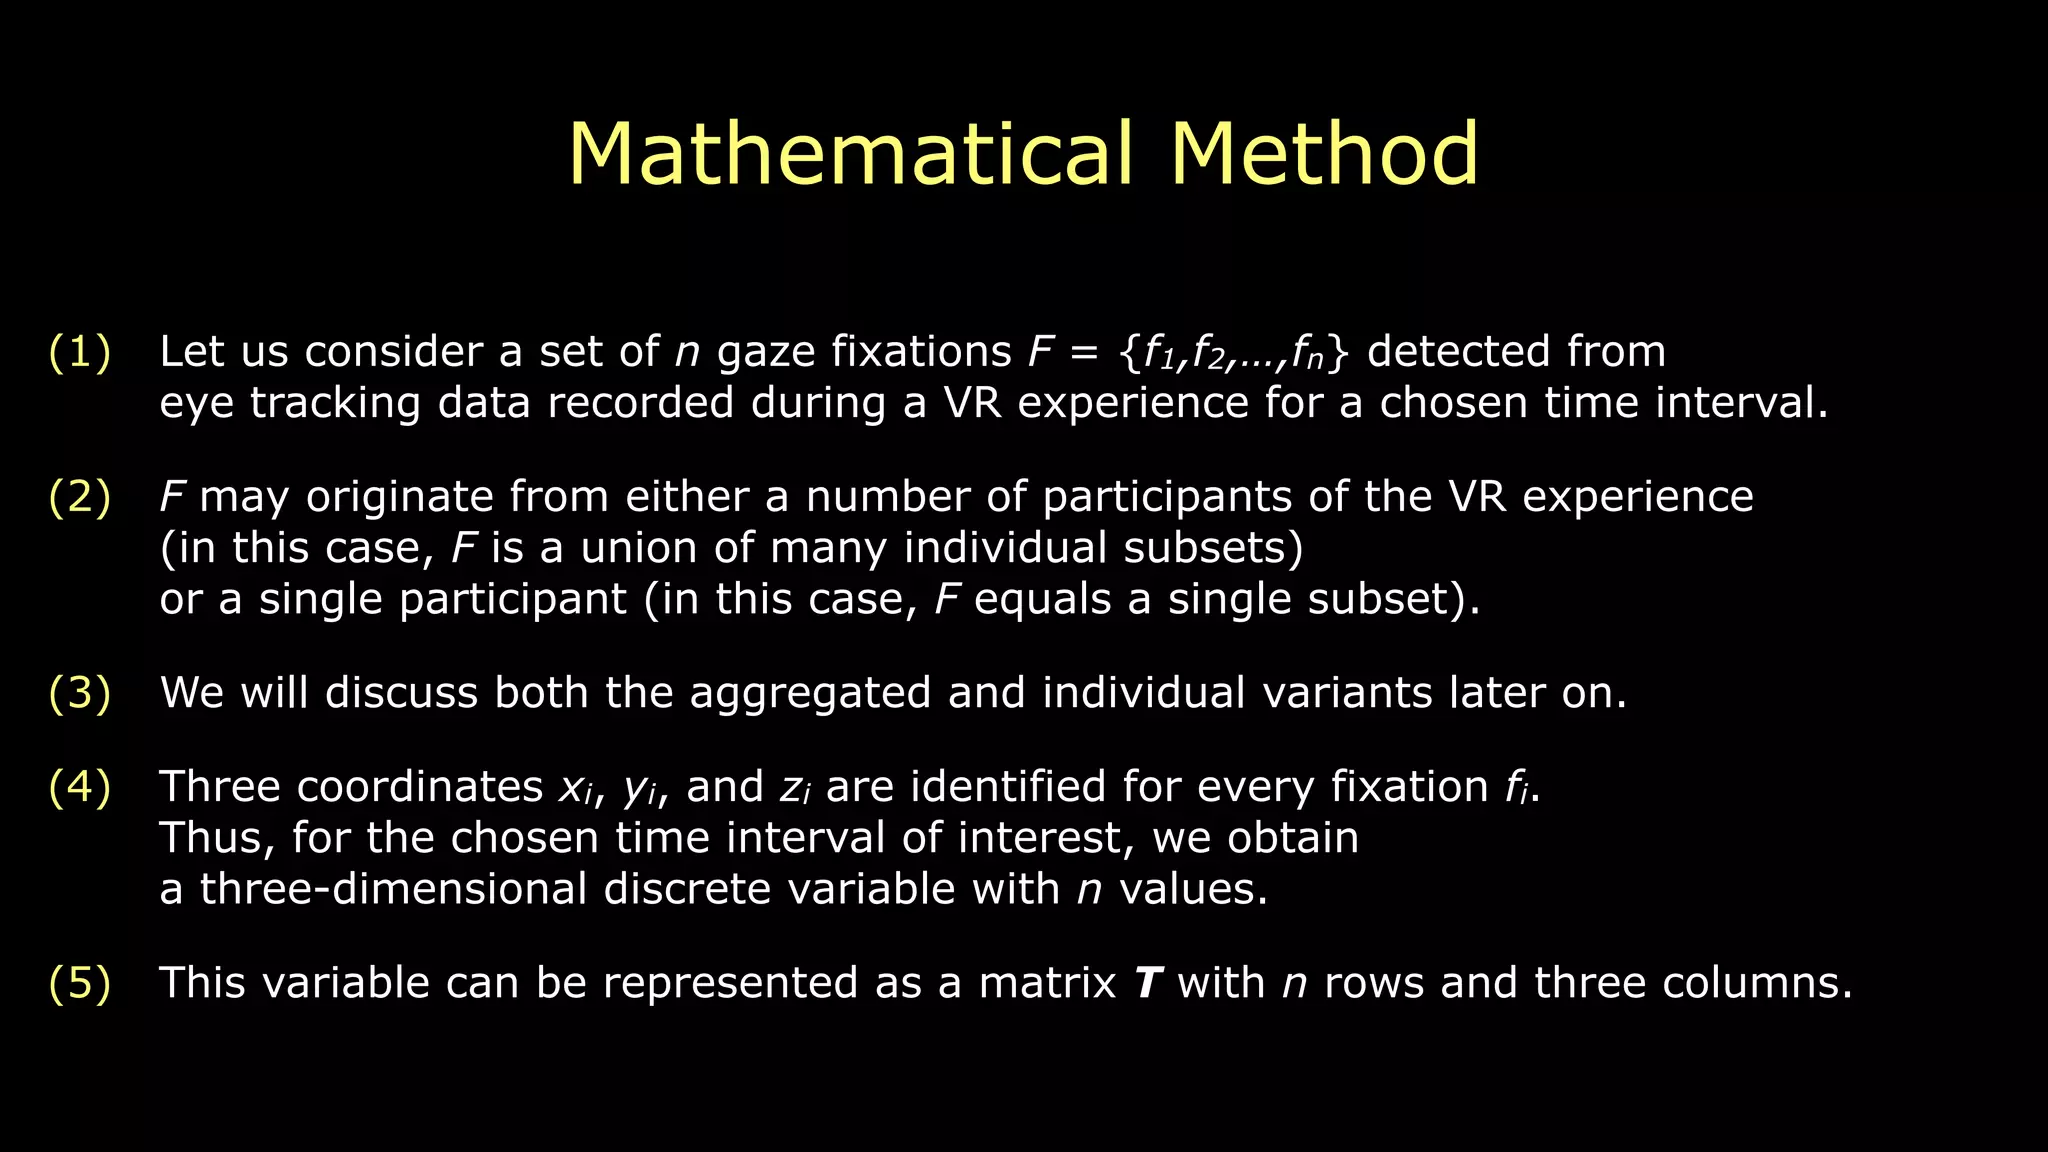
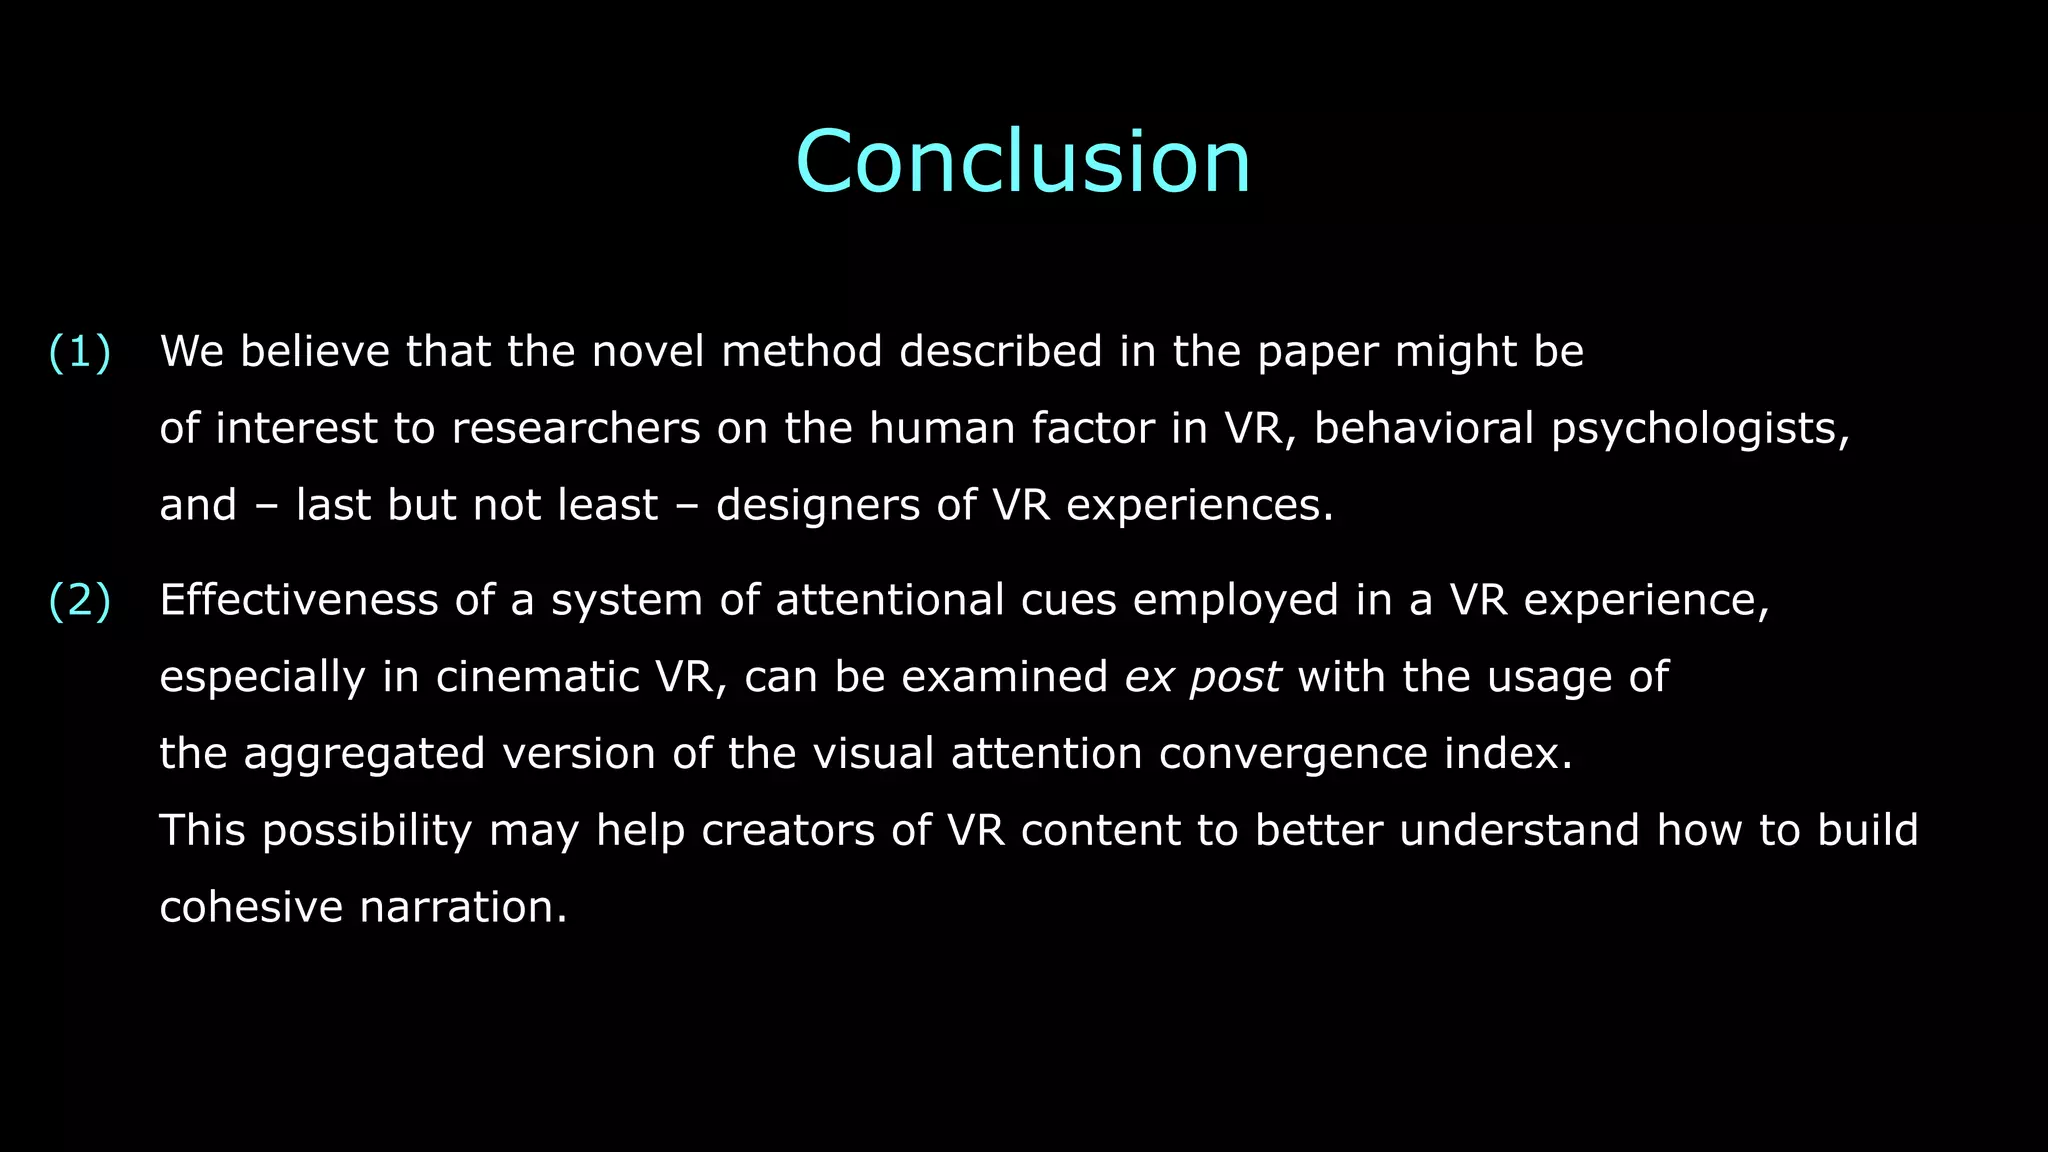
![Mathematical Method
Distance Variance Coefficient (dVar)
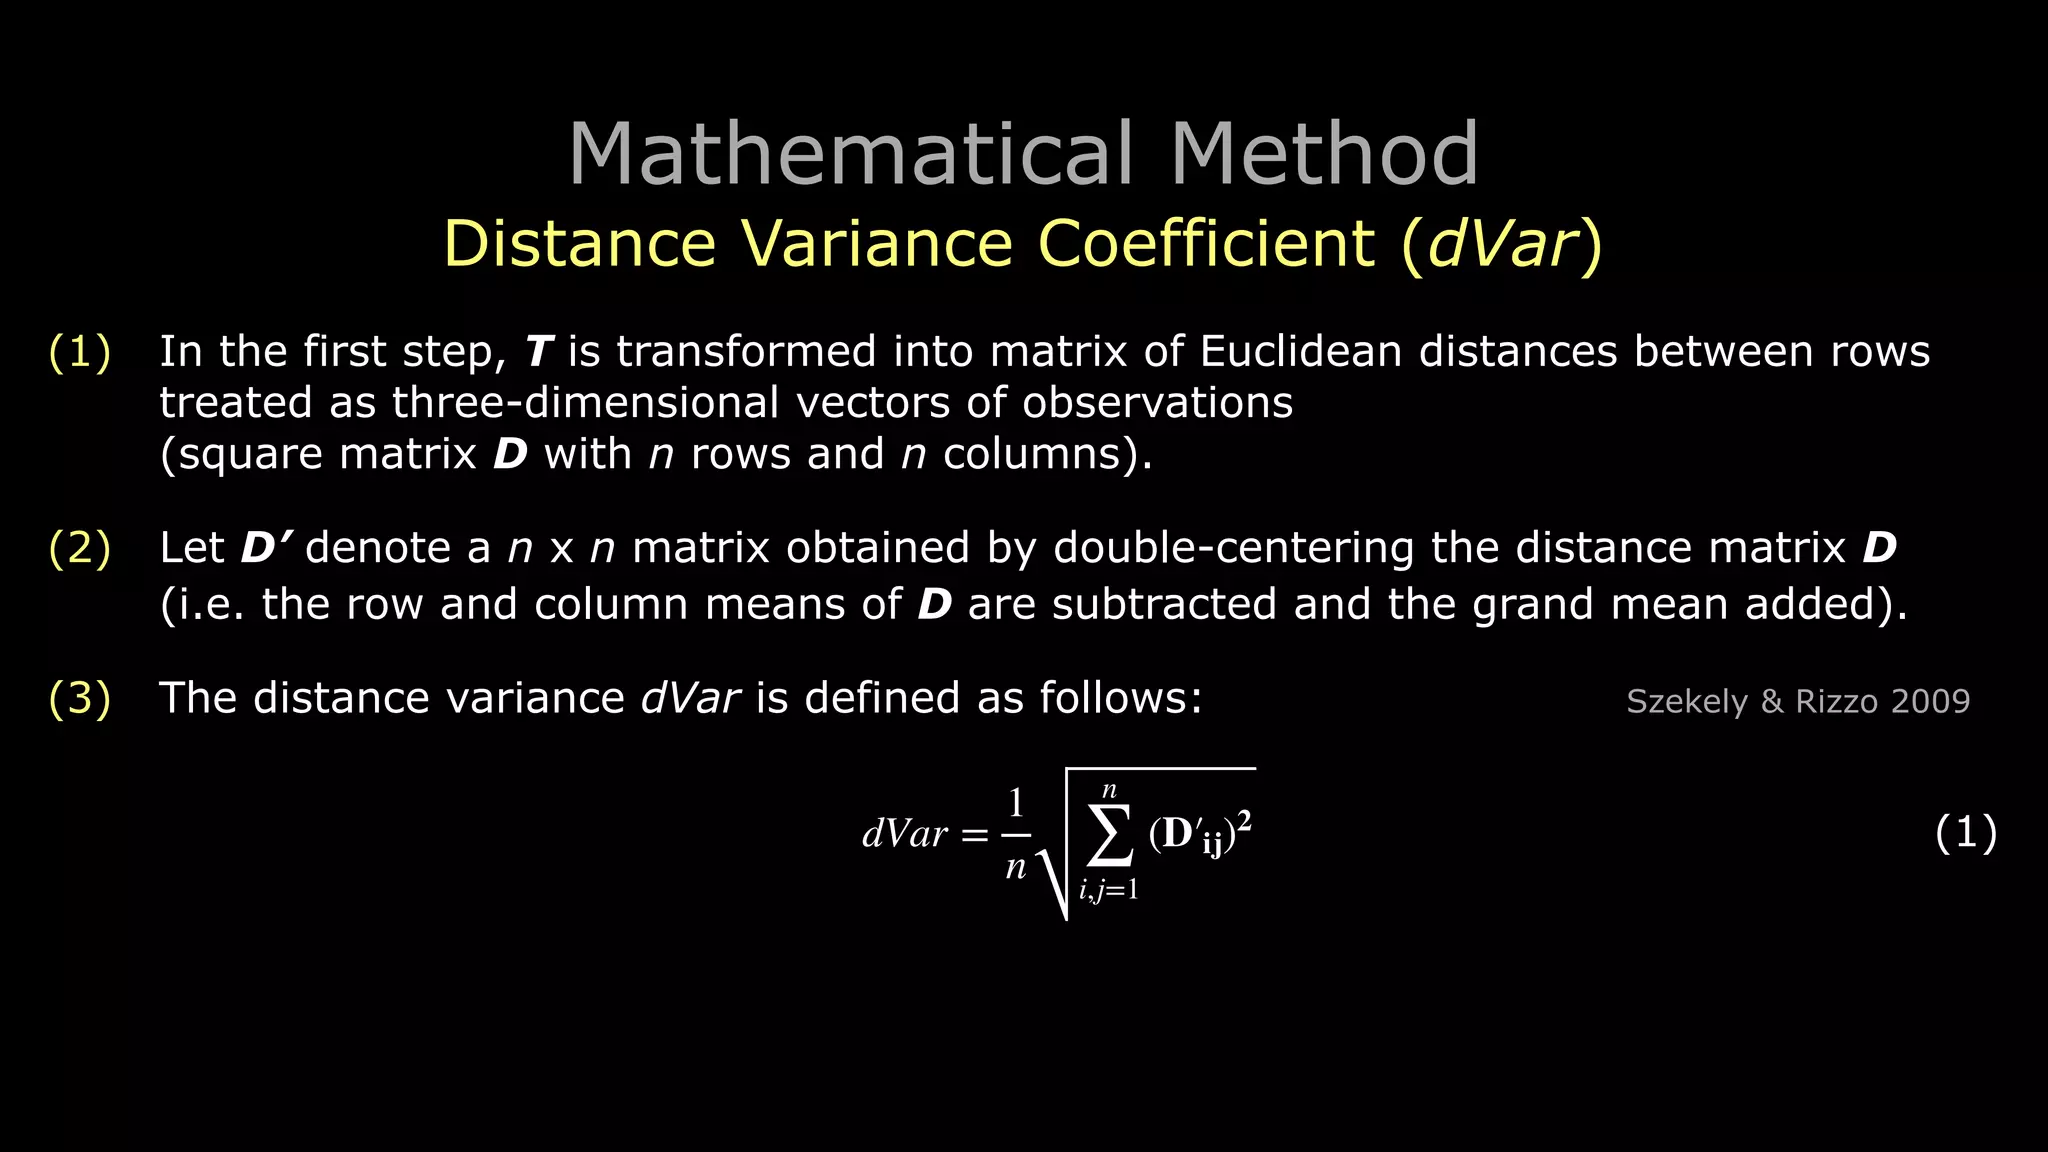
(4) dVar constitutes the basis for further calculations.
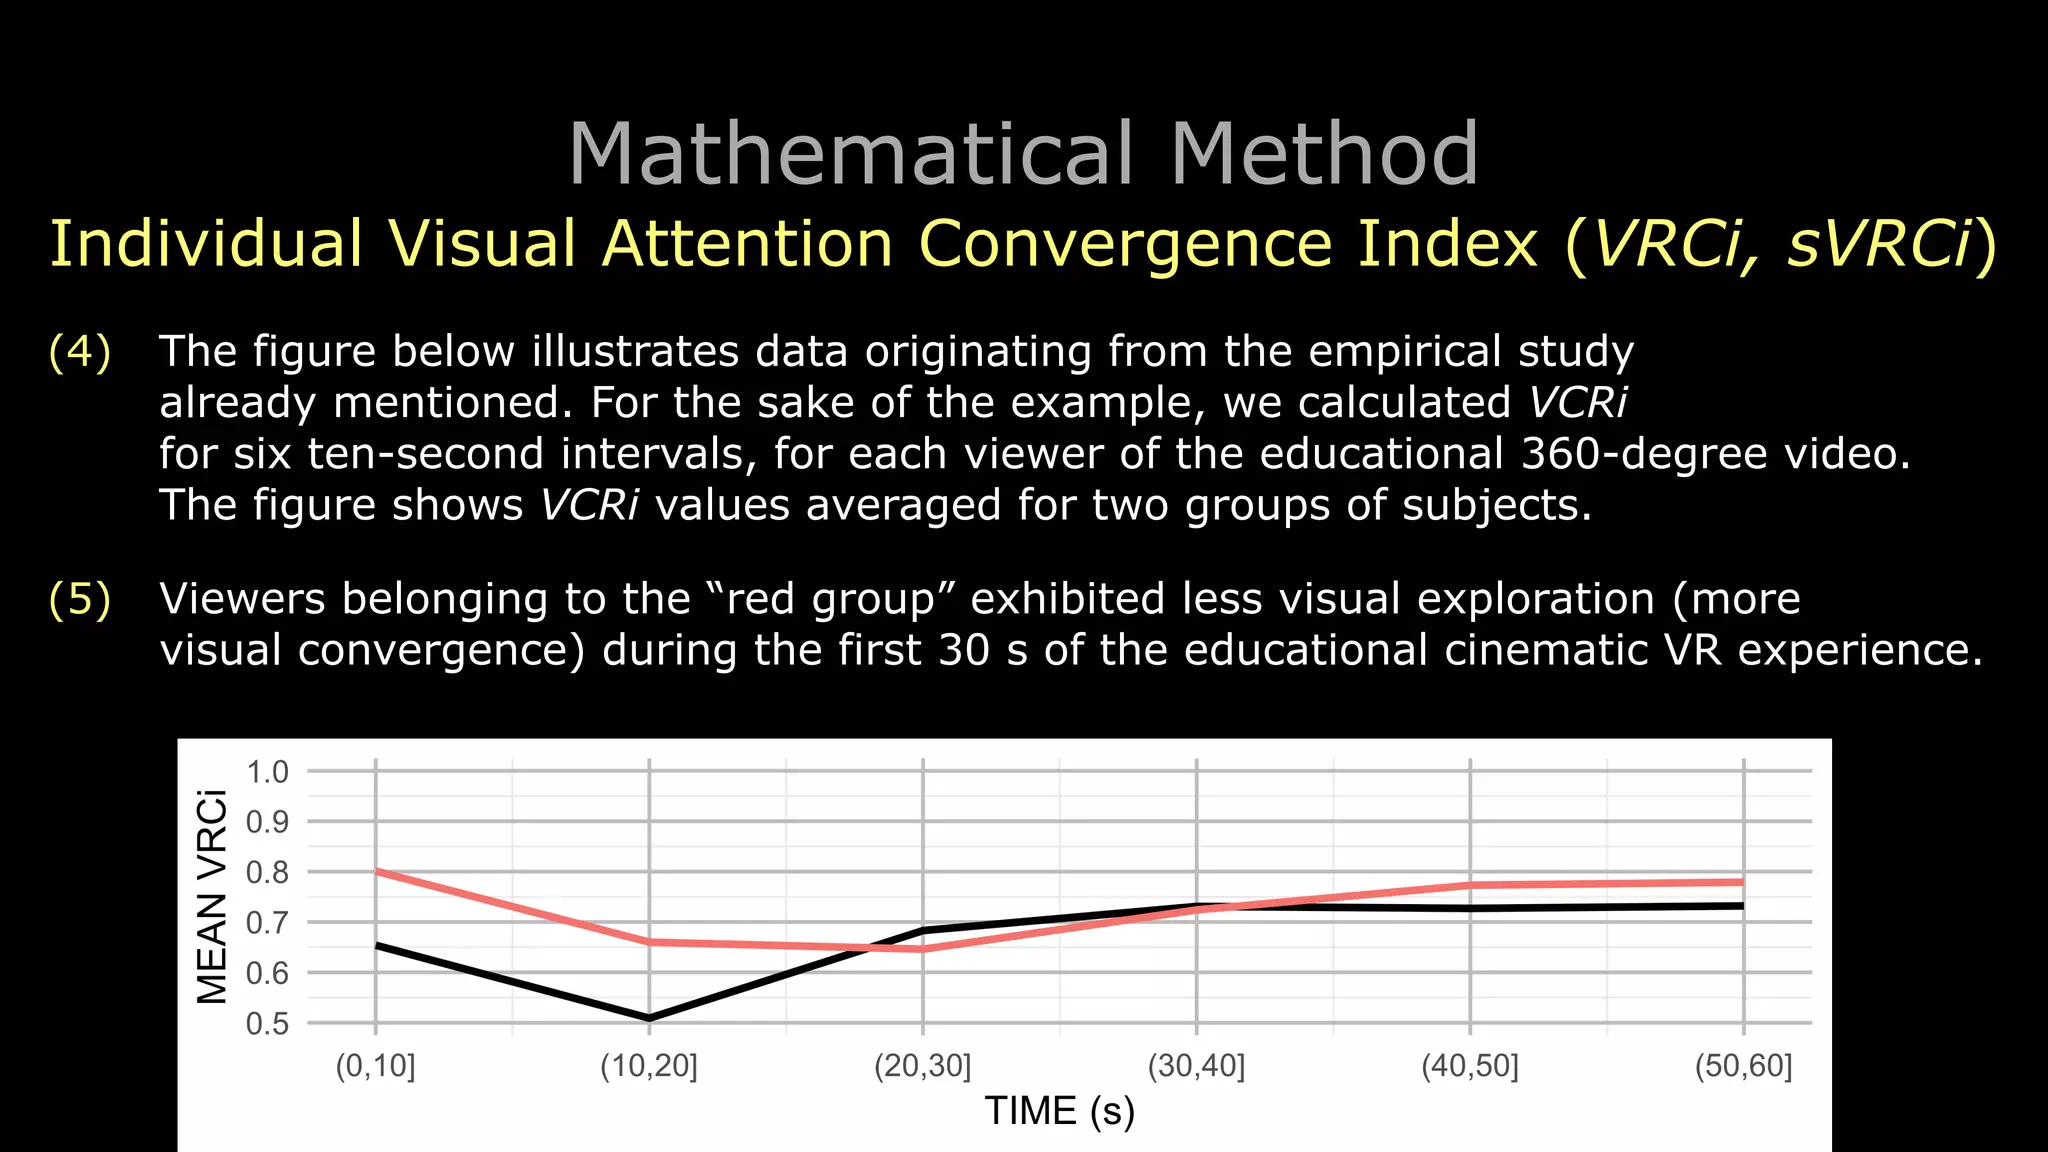
(5) dVar is nonnegative.
(6) dVarmin = 0 represents a situation in which
the spatial coordinates for all fixations fi ∈ F are equal:
! (2)
(7) The more the coordinate vectors differ from each other,
the greater the value of dVar.
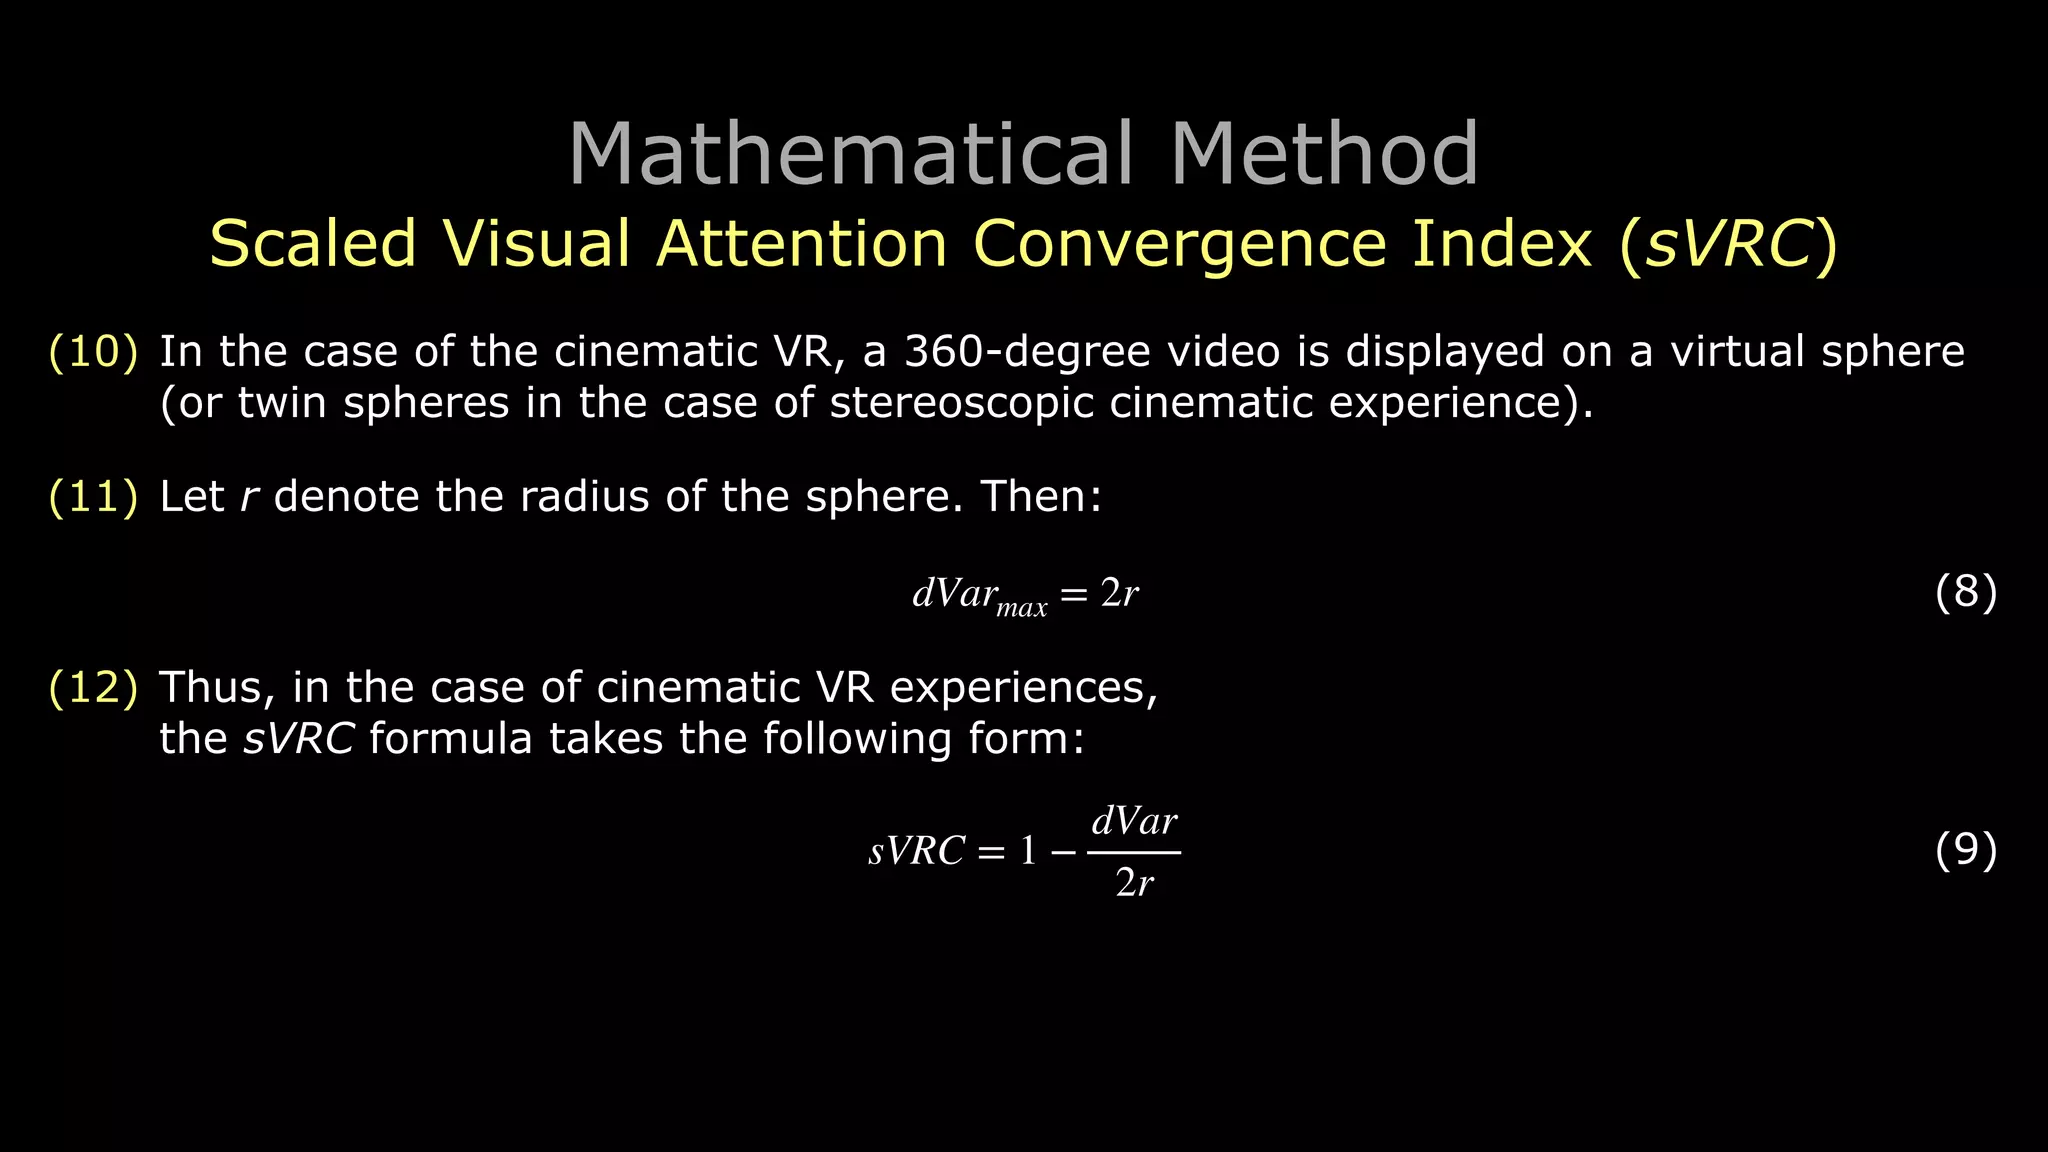
(8) dVar can be easily calculated with the usage of the R package energy. Rizzo & Szekely 2018
[
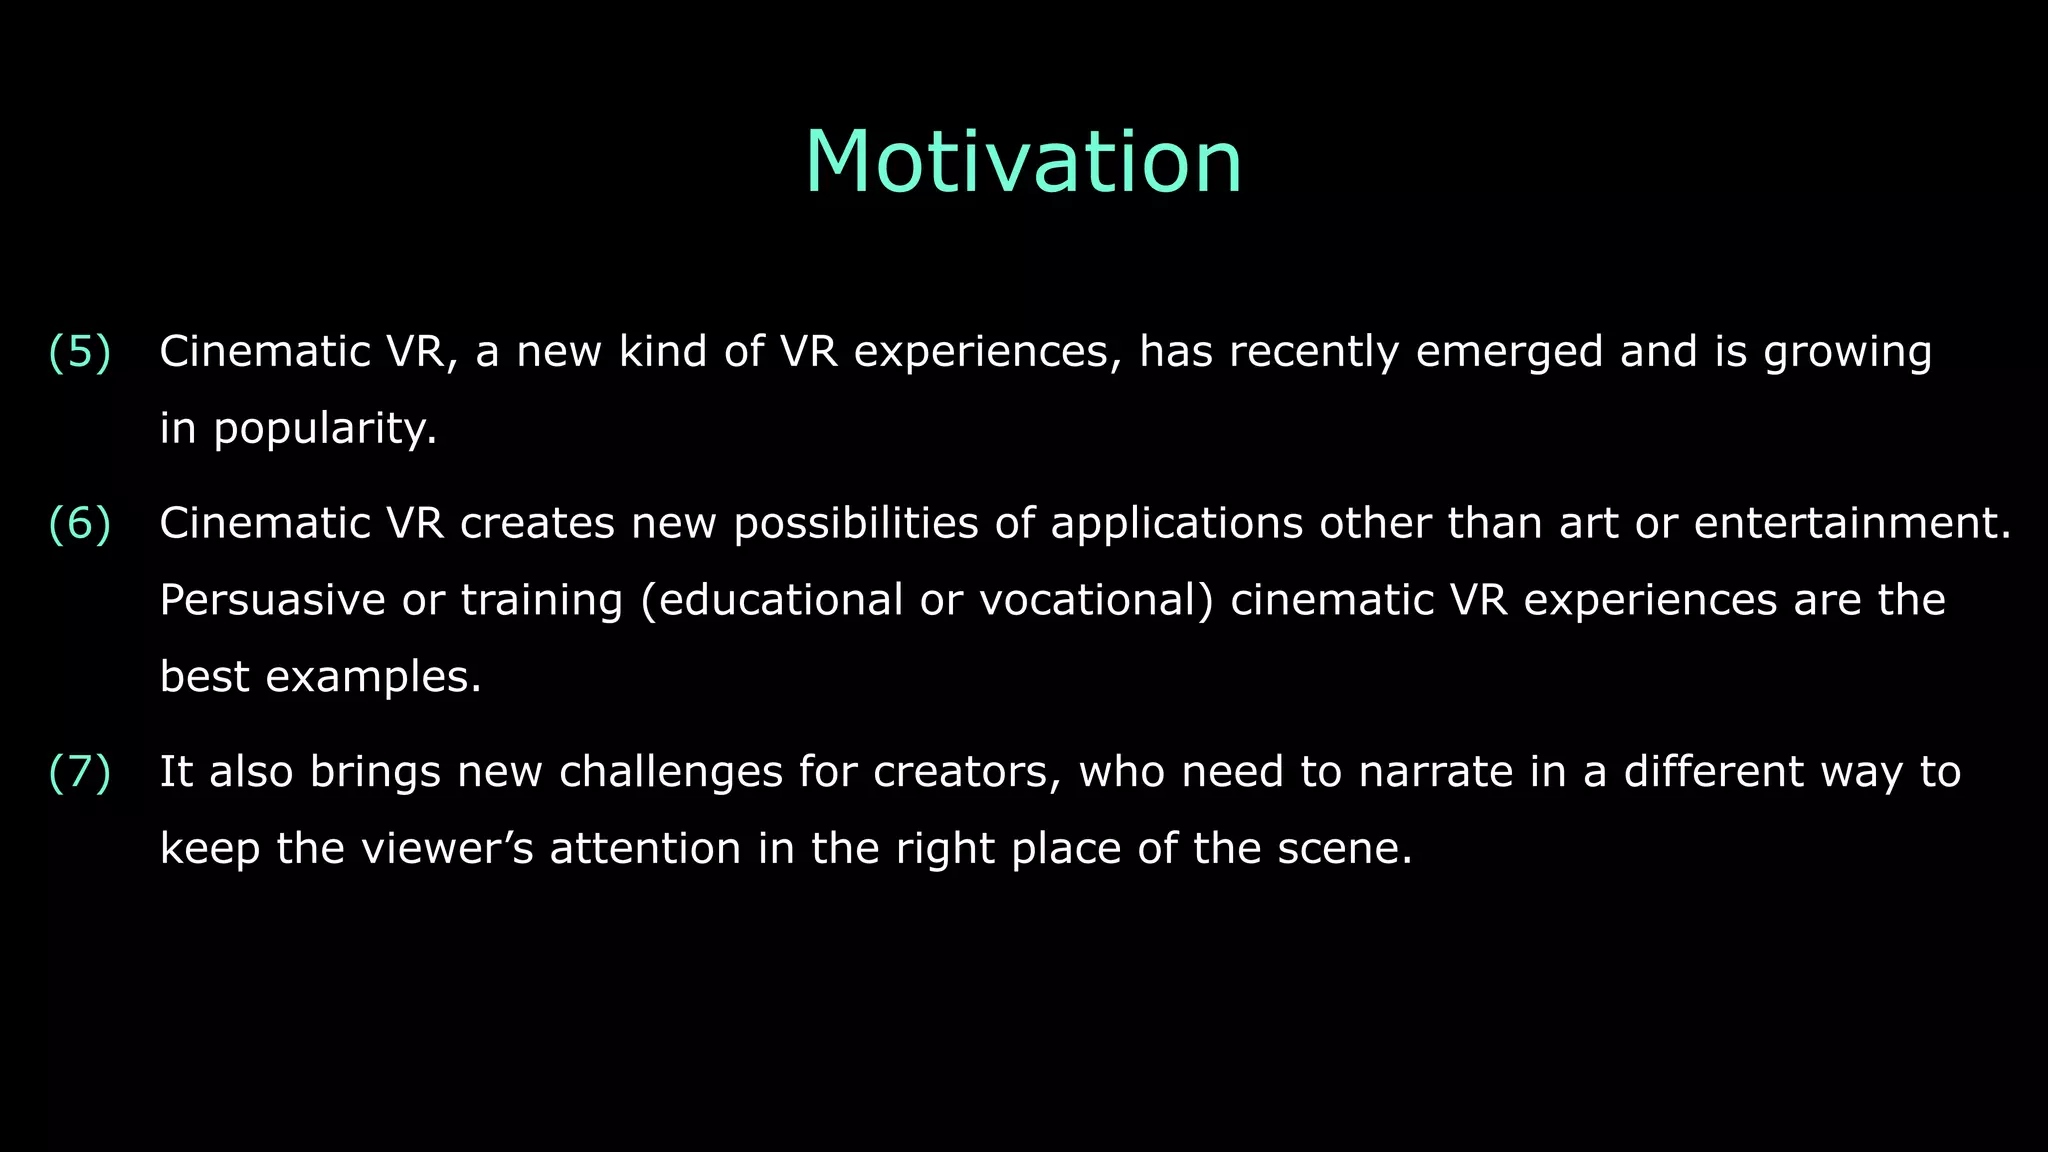
x1
y1
z1
]
=
[
x2
y2
z2
]
= ⋅ ⋅ ⋅ =
xn
yn
zn](https://image.slidesharecdn.com/ihiet2019presentationkobylinskishort2019-08-29-15-04-190829131515/75/Visual-Attention-Convergence-Index-for-Virtual-Reality-Experiences-10-2048.jpg)
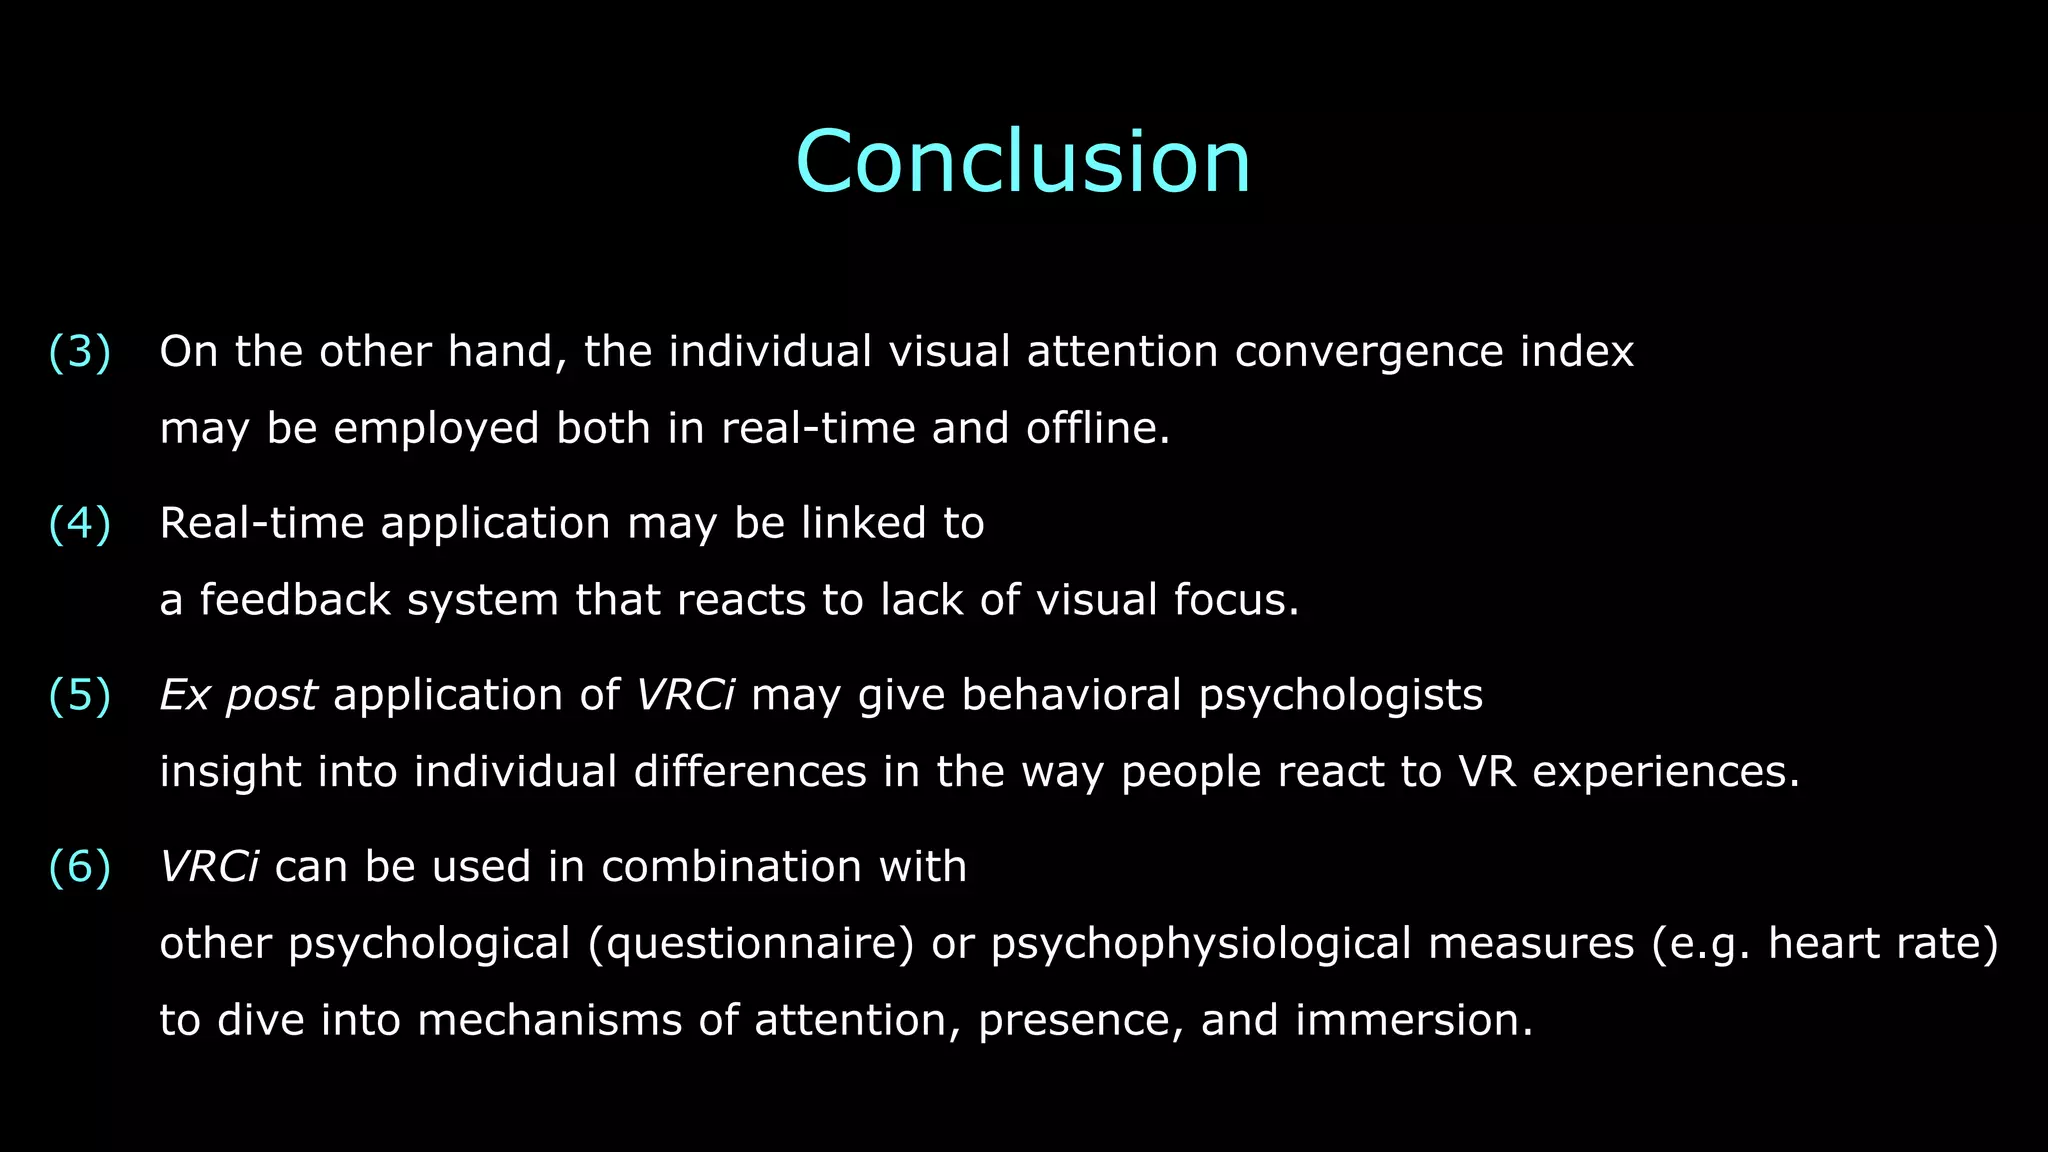
![Mathematical Method
Scaled Visual Attention Convergence Index (sVRC)
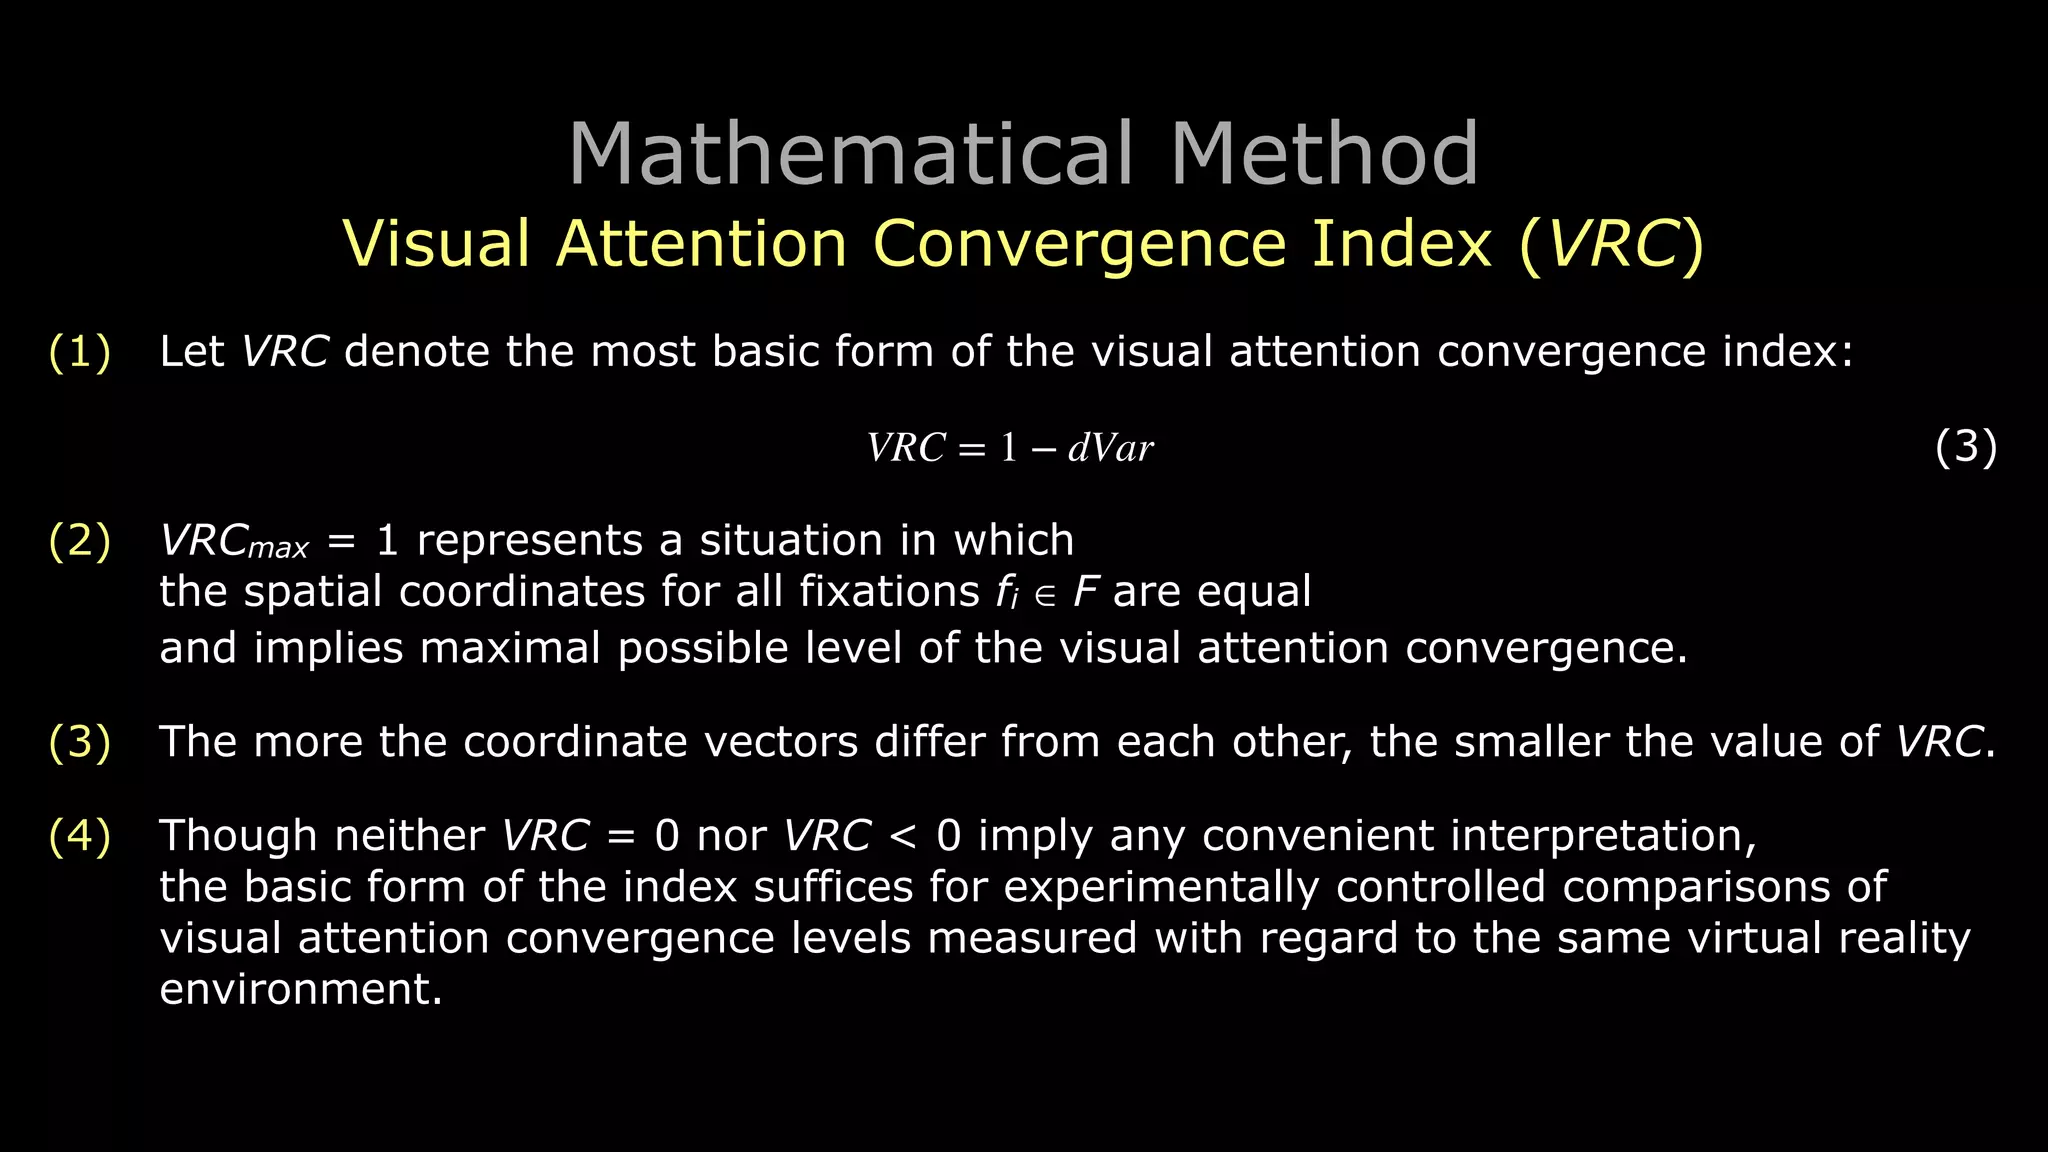
(1) Let sVRC denote a scaled version of the visual attention convergence index:
! (4)
(2) sVRC ∈ [0,1], so interpretation of its values becomes convenient.
(3) sVRCmax = 1 implies maximal possible level of the visual attention convergence.
(4) Depending on the choice between theoretical and empirical value of dVarmax,
sVRCmin = 0 implies either minimal theoretically possible
or minimal empirically observed level of the visual attention convergence.
(5) In the first and preferred case scenario, sVRC can be used to compare
visual attention convergence levels also between virtual reality environments.
sVRC = 1 −
dVar
dVarmax](https://image.slidesharecdn.com/ihiet2019presentationkobylinskishort2019-08-29-15-04-190829131515/75/Visual-Attention-Convergence-Index-for-Virtual-Reality-Experiences-12-2048.jpg)
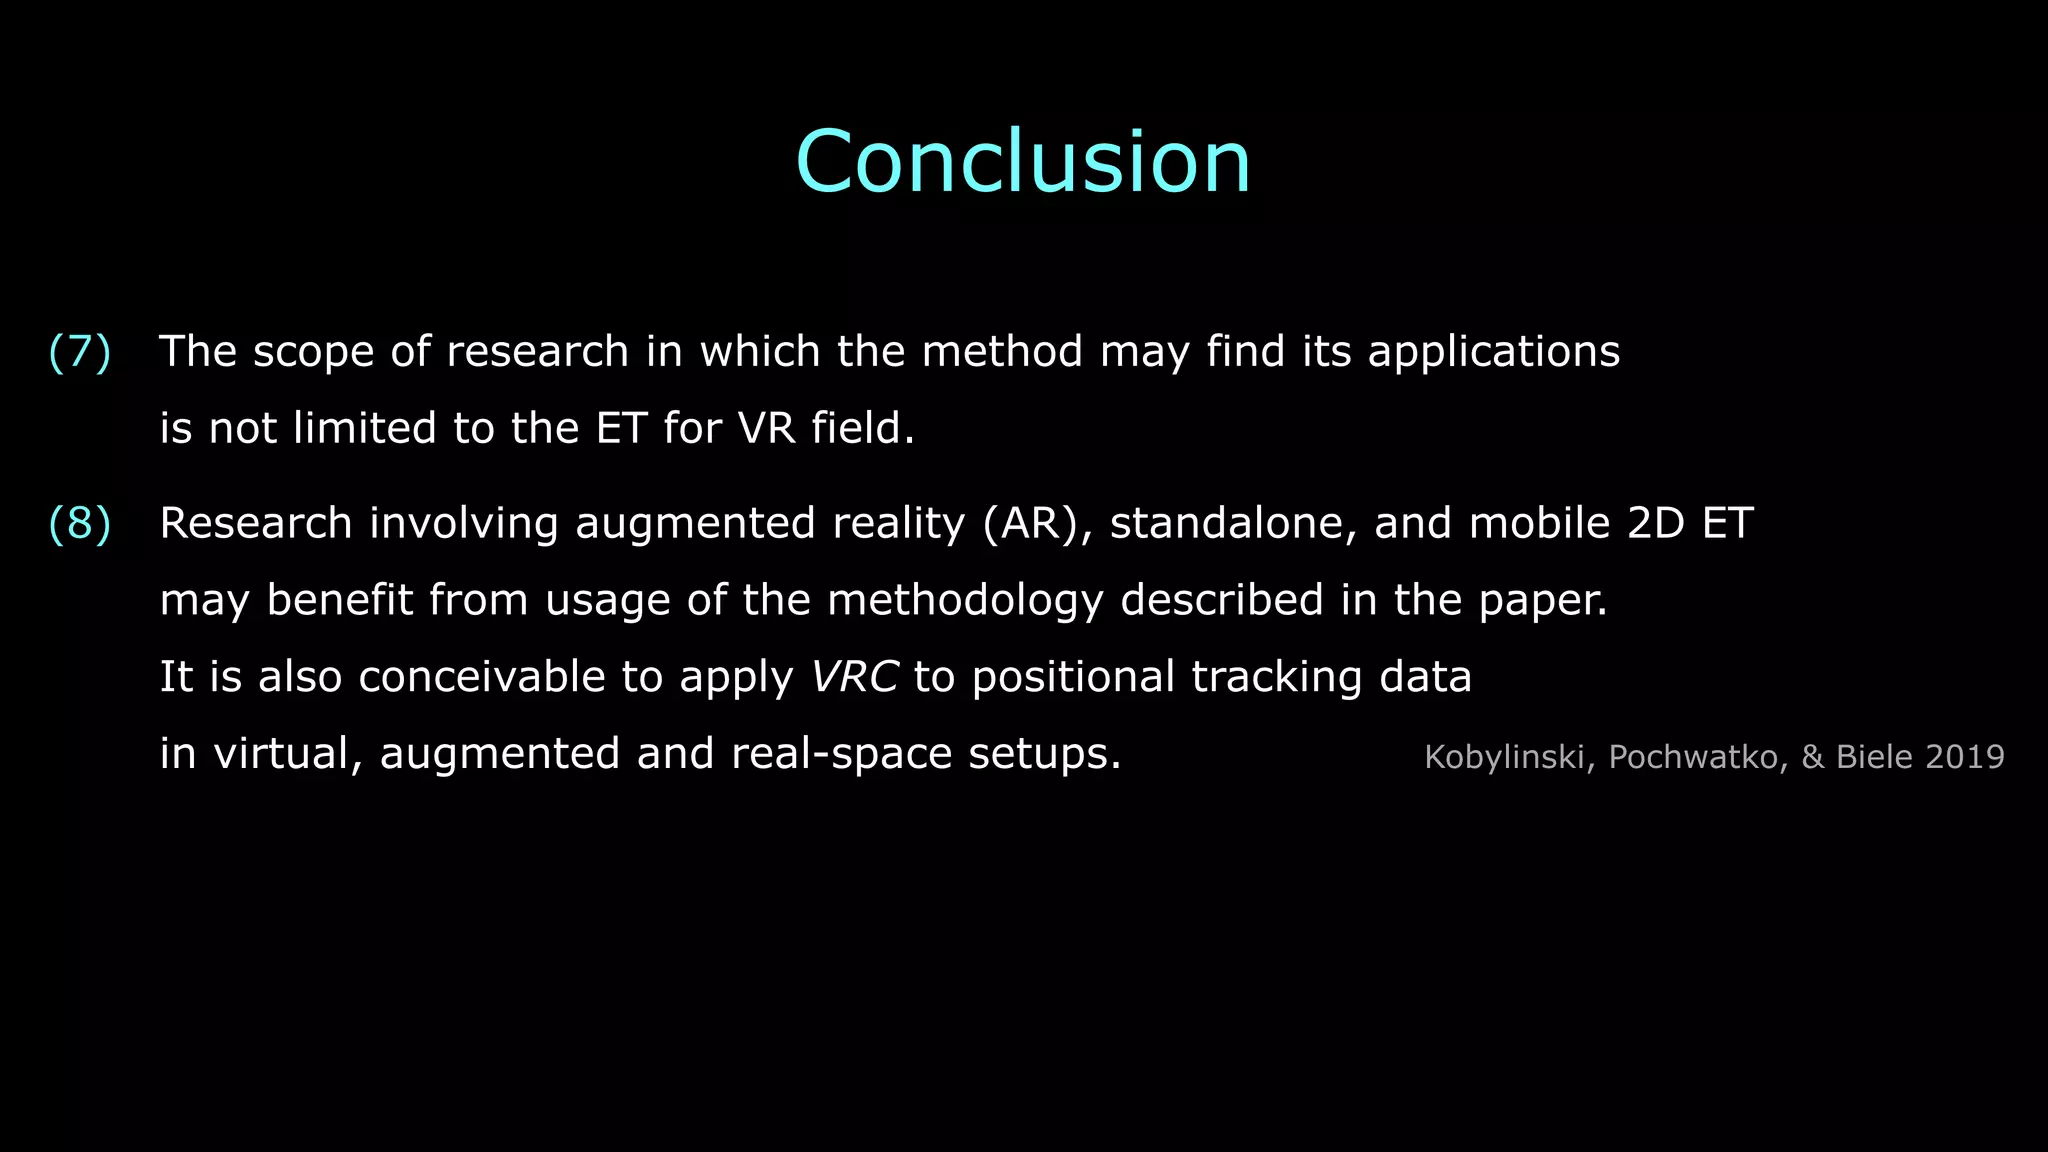
![Mathematical Method
Scaled Visual Attention Convergence Index (sVRC)
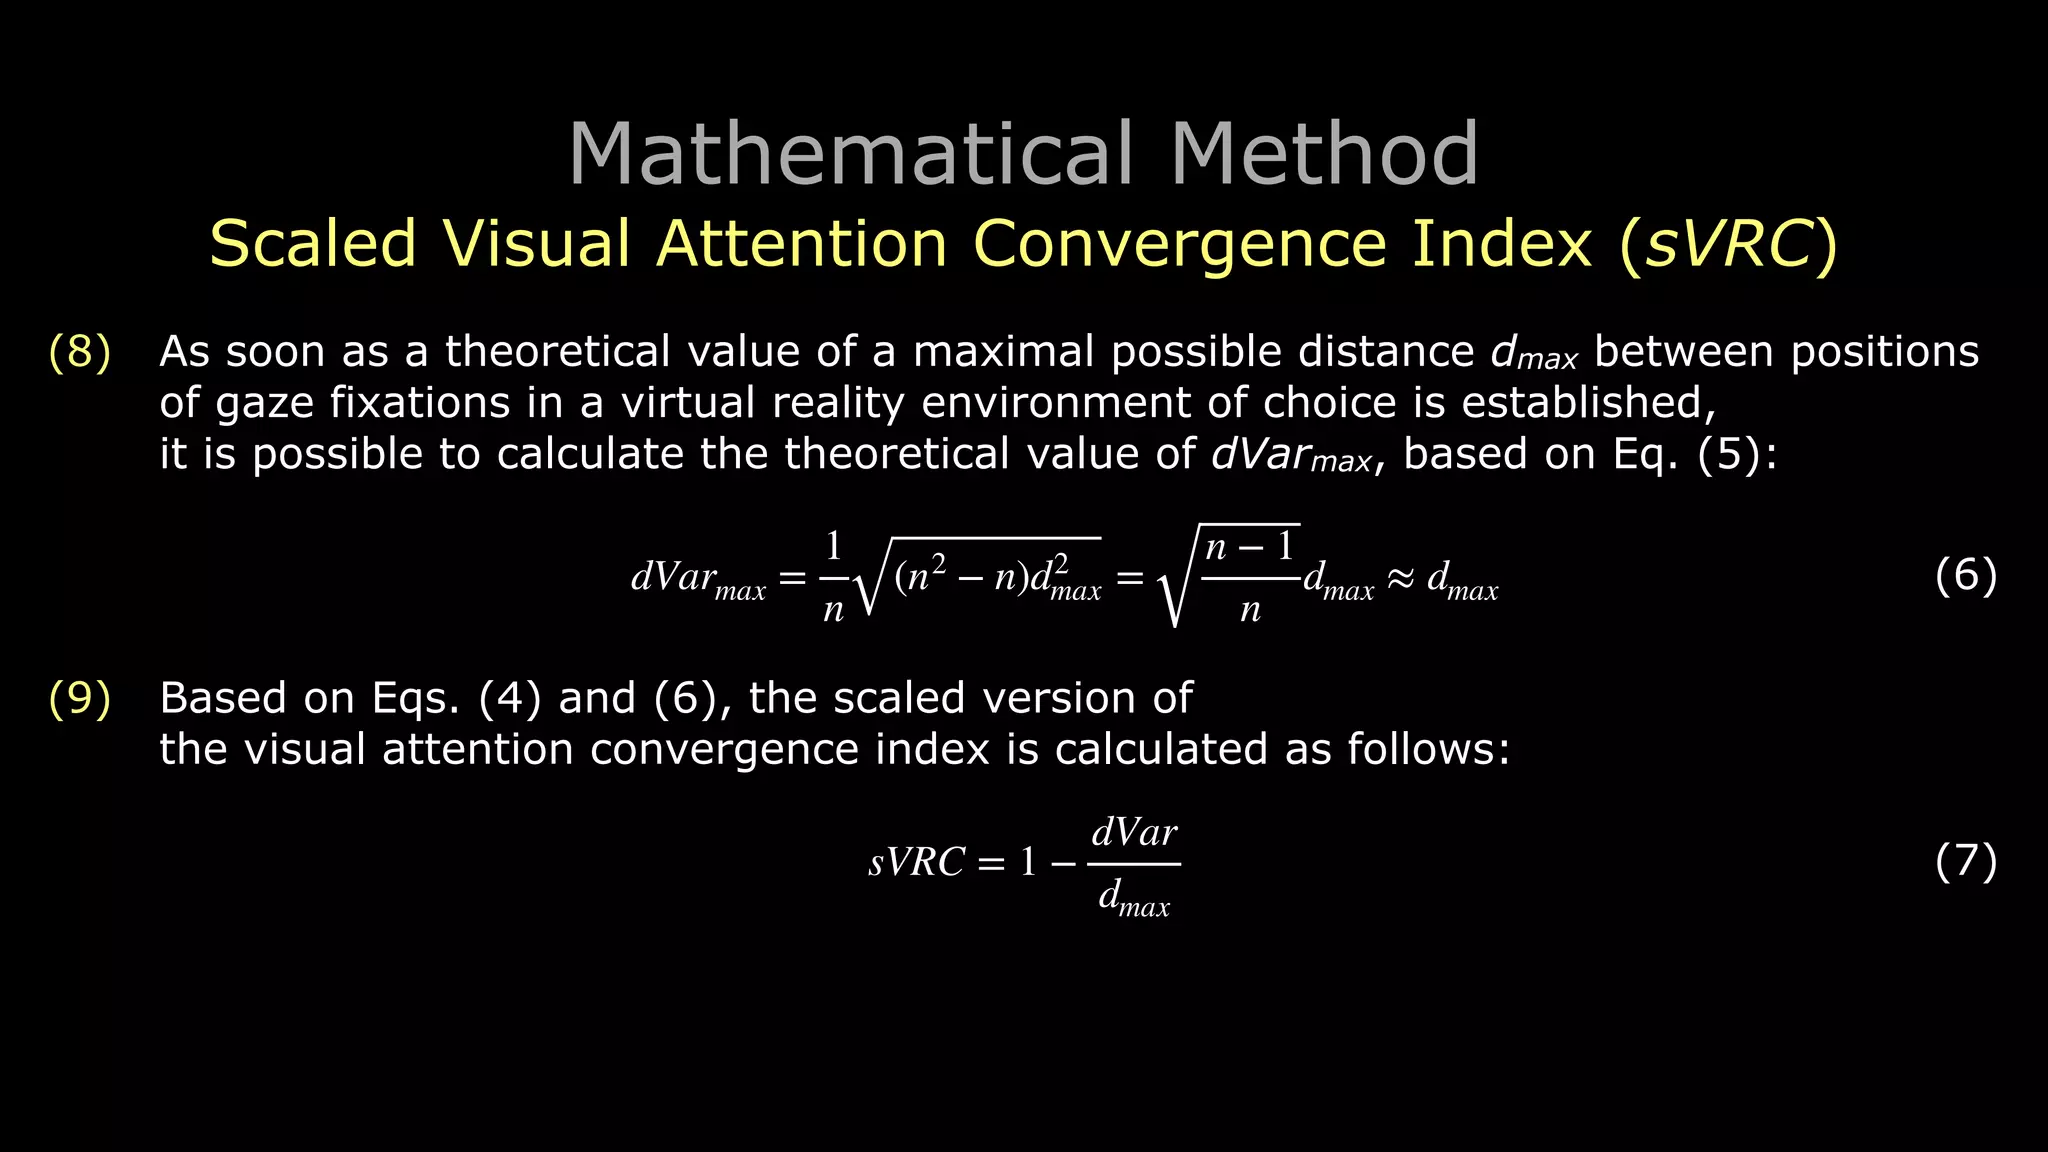
(6) The basic form of the visual attention convergence index (VRC)
requires double-centering the distance matrix D, which is a way to
deal with the central tendency in the set of distances between the gaze fixations.
(7) This complication is however unnecessary when
we choose to explicitly scale the values of the index into the [0,1]︎ interval.
Thus, in the case of the scaled index, the dVar formula takes the following form:
! (5)dVar =
1
n
n
∑
i,j=1
(Dij)2](https://image.slidesharecdn.com/ihiet2019presentationkobylinskishort2019-08-29-15-04-190829131515/75/Visual-Attention-Convergence-Index-for-Virtual-Reality-Experiences-13-2048.jpg)

The paper introduces the Visual Attention Convergence Index (VRC) for analyzing eye tracking in virtual reality (VR), which measures how users focus on the same or different virtual objects. It presents mathematical tools for calculating both aggregated and individual variations of VRC, enabling insights into the effectiveness of narrative cues in VR experiences. The methodology has potential applications in behavioral psychology, VR design, and research involving augmented reality.


![[DL輪読会]Generative Models of Visually Grounded Imagination](https://cdn.slidesharecdn.com/ss_thumbnails/20170602-170602005505-thumbnail.jpg?width=640&height=640&fit=bounds)


![[DSC Europe 25] Dusan Nesic - Securing Tomorrow’s Infrastructure: Why Cyber-P...](https://cdn.slidesharecdn.com/ss_thumbnails/qikbszfftyowjm2q6duw-1-251211083848-8f2ead6b-thumbnail.jpg?width=640&height=640&fit=bounds)

![[DSC Europe 25] Kaja Kandare - LLM as a judge.pptx](https://cdn.slidesharecdn.com/ss_thumbnails/arxyccaxsdsd1ba99wjw-7-251212104007-2b4e3f64-thumbnail.jpg?width=640&height=640&fit=bounds)
![[DSC Europe 25] Branko Dzakula - From Defense to Attack: How AI Redefines Cyb...](https://cdn.slidesharecdn.com/ss_thumbnails/80bdzdxpr3ky2g0qvyk9-8-251211083048-ce5fc1ee-thumbnail.jpg?width=640&height=640&fit=bounds)
![[DSC Europe 25] Ivan Peric - Intelligence Swarm Logic and Techno-Functional M...](https://cdn.slidesharecdn.com/ss_thumbnails/7my7c97fsduiccadgavw-2-251212103249-5a03f7c6-thumbnail.jpg?width=640&height=640&fit=bounds)


![[DSC Europe 25] Behzad Hosseini - AI Agents in the Wild: Deploying Models tha...](https://cdn.slidesharecdn.com/ss_thumbnails/3qtejajvsjqrzwfept2c-10-251212103250-7f2b1068-thumbnail.jpg?width=640&height=640&fit=bounds)

![[DSC Europe 25] Katherine Forrest - AI NOW: Understanding the Velocity of Cha...](https://cdn.slidesharecdn.com/ss_thumbnails/wvvbruqfrci0sfq9xwgb-4-251212104007-e5ad1987-thumbnail.jpg?width=640&height=640&fit=bounds)


![[DSC Europe 25] Jon Dajci - Bridging TradFi and DeFi: Building the Future of ...](https://cdn.slidesharecdn.com/ss_thumbnails/fqmhfvlbqhkihjvqvhmu-7-251211083849-6af7e325-thumbnail.jpg?width=640&height=640&fit=bounds)