Download to read offline


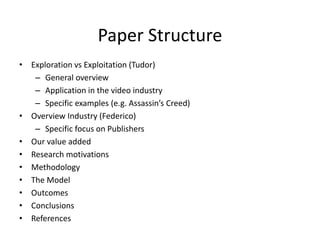

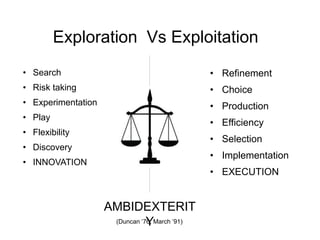
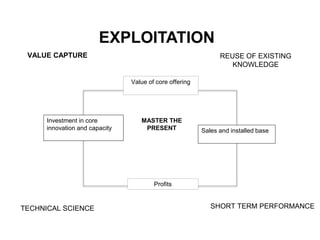
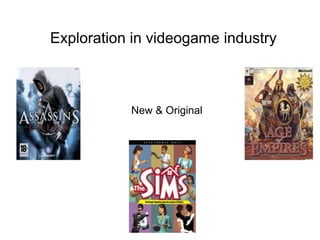
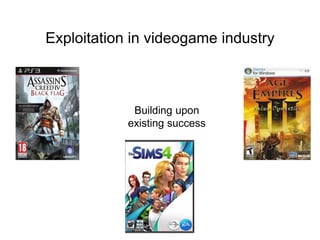
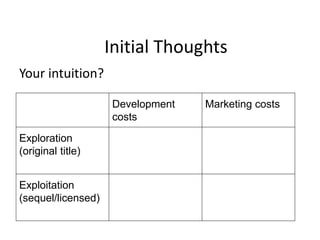
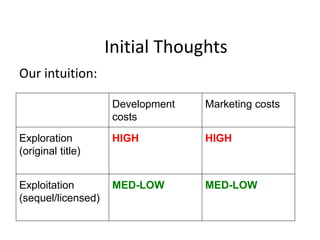
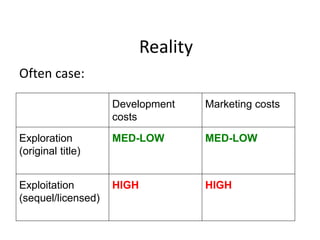
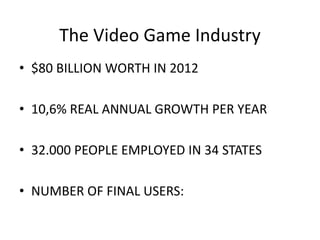
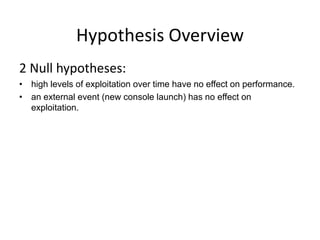
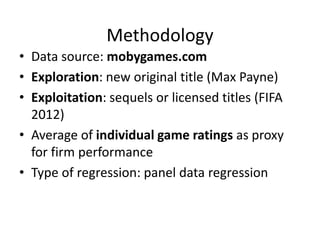
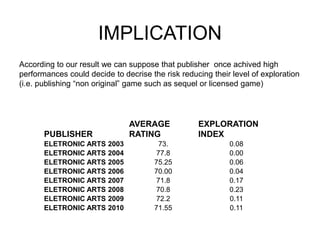
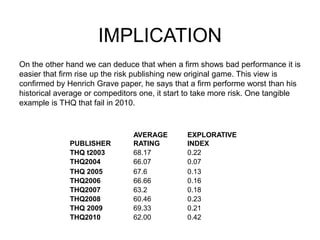
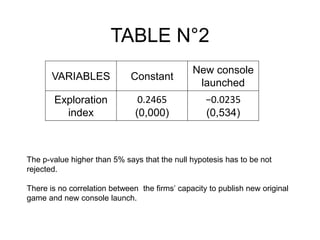
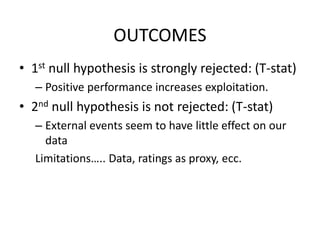


This document summarizes a research paper about balancing exploration and exploitation in the video game industry. It provides an overview of the paper structure, definitions of exploration and exploitation, and initial thoughts on how development costs and marketing costs relate to exploration and exploitation. It then details the methodology used, including the data source and variables. The results found that high performance leads to increased exploitation, while poor performance increases exploration, supporting an existing theory. It was also found that new console launches did not significantly impact the level of exploration.