Download to read offline

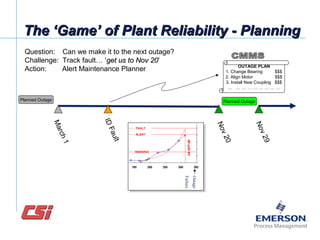
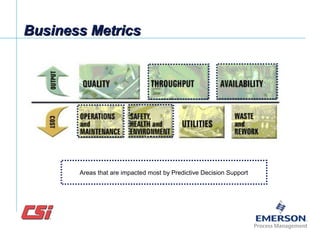
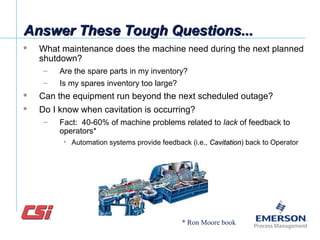
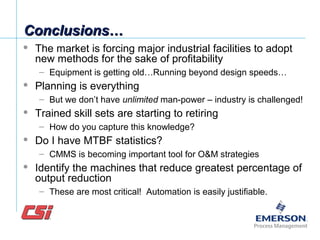
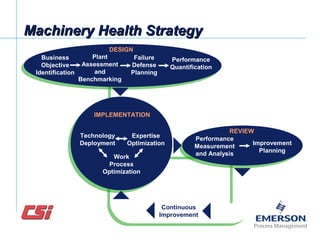
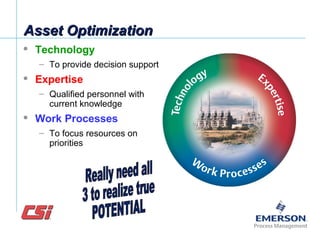
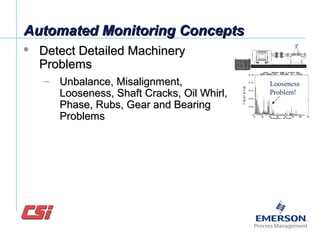
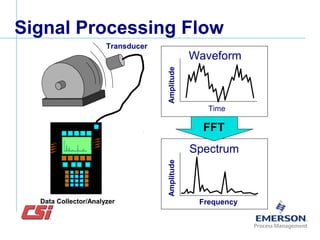

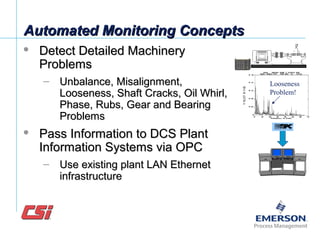
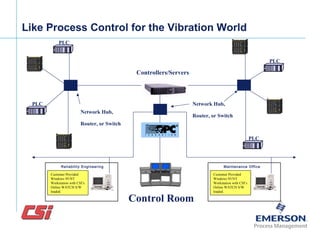
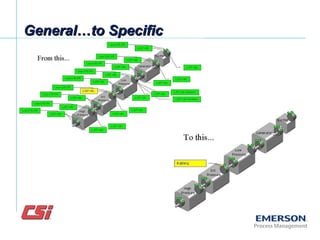
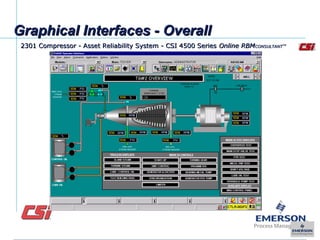
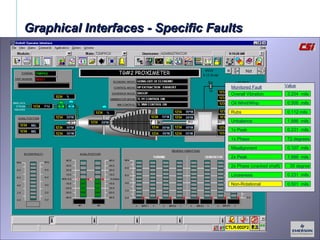
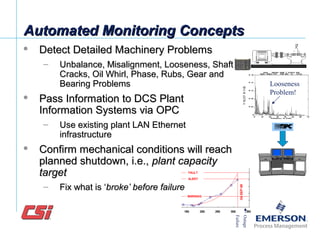
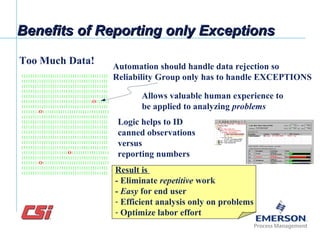
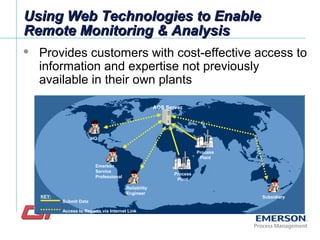
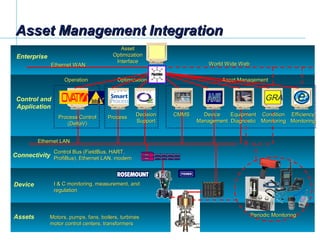
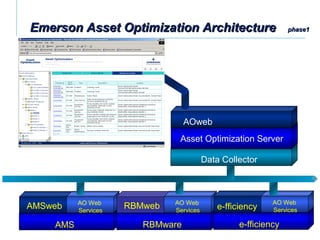
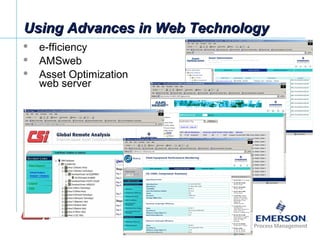
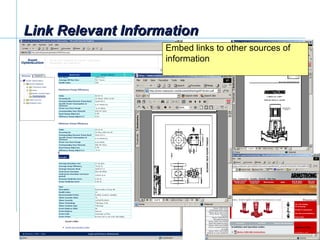
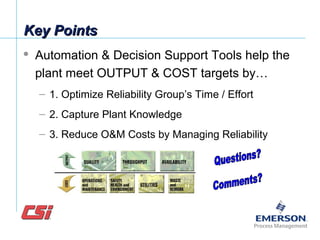

This document discusses automated machinery maintenance and reliability. It outlines industry trends like aging equipment running beyond design capacity that increase the need for predictive maintenance. A machinery health strategy is proposed using technology, expertise, and optimized work processes to improve asset optimization. Automating decision support can detect detailed machinery problems through vibration monitoring and pass information to plant systems. Graphical interfaces provide overall and specific fault monitoring to help address challenges around planned maintenance and equipment reliability.


![002 Maintenance M Overview 20 06 06[1]](https://cdn.slidesharecdn.com/ss_thumbnails/002-maintenance-m-overview-20-06-061-1221944333735887-9-thumbnail.jpg?width=640&height=640&fit=bounds)