Downloaded 127 times
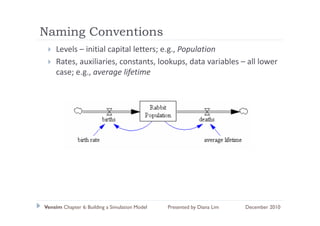
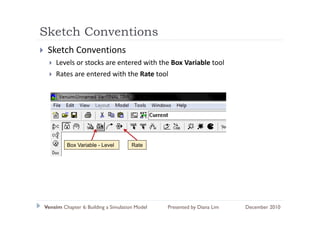
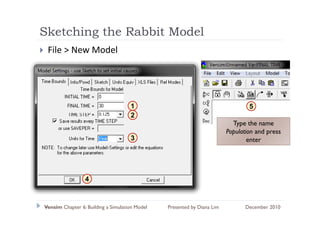
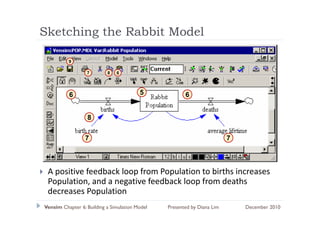
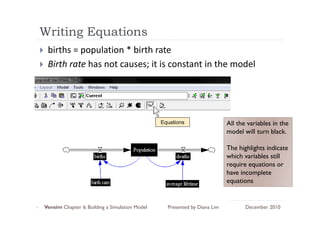
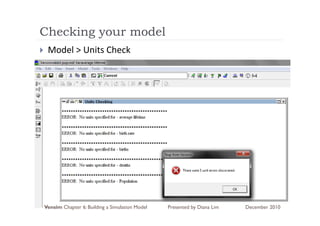
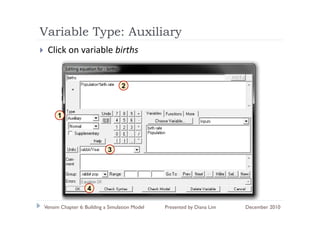
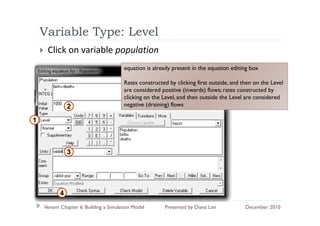
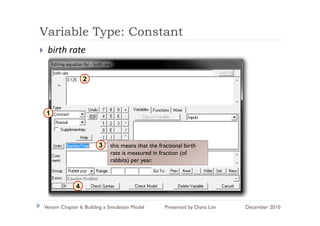
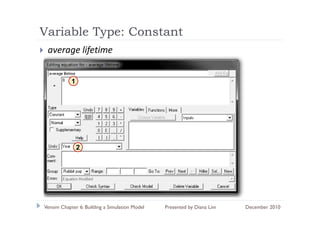
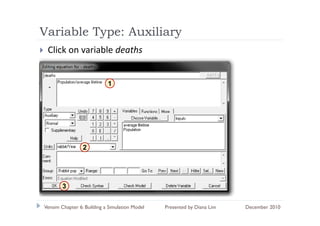
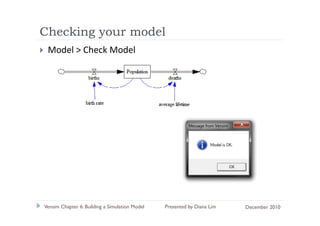
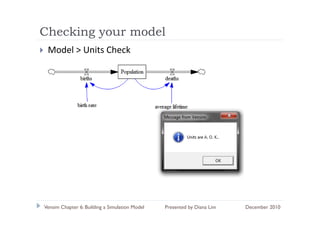
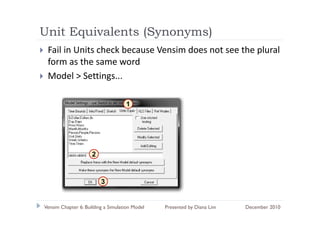
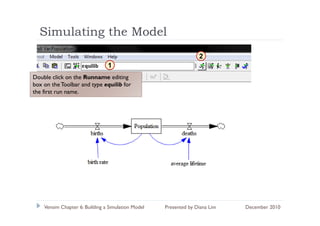
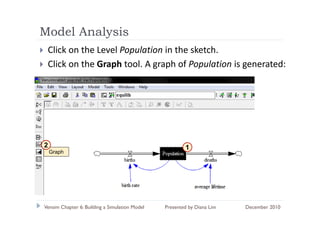
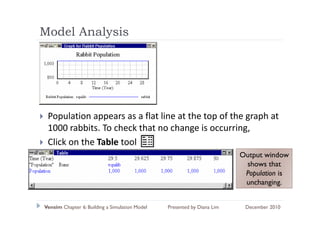
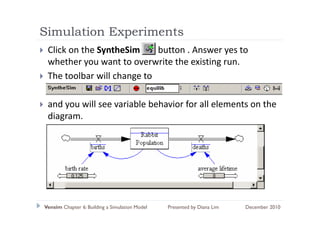
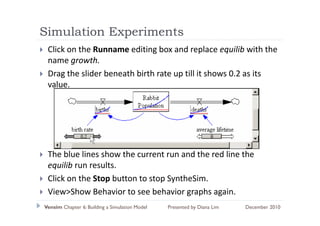
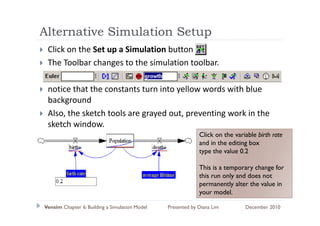
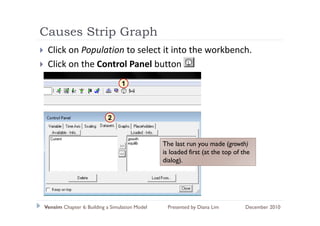
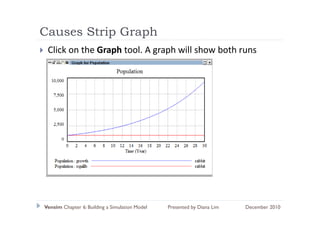
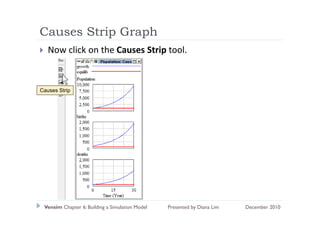
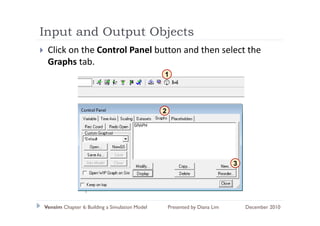
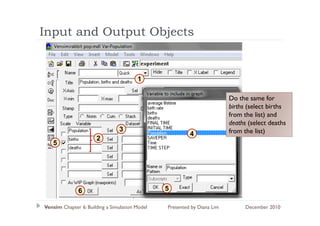
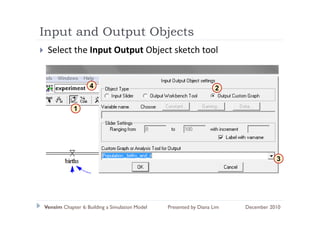
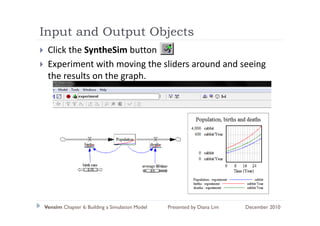

The document provides an overview of building a simulation model in Vensim. It discusses naming conventions, sketching a rabbit population model, writing equations, checking the model, simulating experiments by changing constants, and adding input and output objects to manipulate variables. Key steps include sketching levels and rates, writing equations, checking for units and completeness, running simulations by adjusting constants, and analyzing results using graphs and comparison tools.


