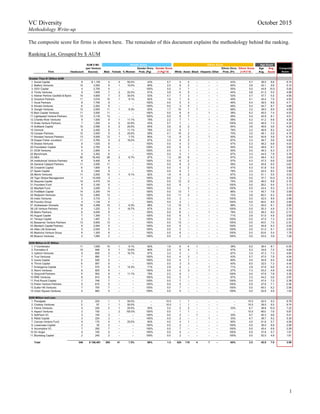
SlideShare a Scribd company logo
1 of 12
Download to read offline
 
	
   1
VC Diversity October 2015
Methodology Write-up
The composite score for firms is shown here. The remainder of this document explains the methodology behind the ranking.
Ranking List, Grouped by $ AUM
AUM$$$Mil. Gender$Score Ethnic$Score Age$Score
(per$Venture Gender$Divrs. Gender$Score Ethnic$Divrs. Ethnic$Score Age Avg. Composite
Firm Headcount Source) Male Female %$Women Prob.$(Pg) (1GPg)*10 White Asian Black Hispanic Other Prob.$(Pr) (1GPr)*10 Avg. Score Score
Greater$Than$$1$Billion$AUM
– 1. Social*Capital 8 $*1,155 4 4 50.0% 43% 5.7 4 4 – – – 43% 5.7 38.5 8.8 6.74
– 2. Battery*Ventures 10 4,500 9 1 10.0% 80% 2.0 8 2 – – – 64% 3.6 42.1 9.8 5.10
– 3. GGV*Capital 4 2,705 4 – – 100% 0.0 3 1 – – – 50% 5.0 44.8 10.0 5.00
– 4. Trinity*Ventures 9 1,500 7 2 22.2% 61% 3.9 4 5 – – – 44% 5.6 51.3 5.5 4.99
– 5. Kleiner*Perkins*Caufield*&*Byers 10 4,600 7 3 30.0% 53% 4.7 7 3 – – – 53% 4.7 47.7 5.5 4.95
– 6. Greylock*Partners 11 3,016 10 1 9.1% 82% 1.8 7 4 – – – 49% 5.1 45.4 7.9 4.93
– 7. Accel*Partners 8 7,790 8 – – 100% 0.0 5 3 – – – 46% 5.4 39.5 8.8 4.71
– 8. Khosla*Ventures 8 2,263 8 – – 100% 0.0 3 5 – – – 46% 5.4 44.7 8.7 4.68
– 9. Google*Ventures 12 2,000 11 1 8.3% 83% 1.7 10 1 1 – – 68% 3.2 38.0 8.9 4.58
– 10.Bain*Capital*Ventures 11 3,000 11 – – 100% 0.0 6 4 – 1 – 38% 6.2 45.0 7.4 4.53
– 11.Lightspeed*Venture*Partners 13 3,135 13 – – 100% 0.0 6 7 – – – 46% 5.4 42.9 8.1 4.51
– 12.Charles*River*Ventures 9 1,500 8 1 11.1% 78% 2.2 7 1 – 1 – 58% 4.2 41.2 6.8 4.38
– 13.Scale*Venture*Partners 7 1,200 4 3 42.9% 43% 5.7 7 – – – – 100% 0.0 46.9 7.3 4.32
– 14.Softbank*Capital 10 2,596 8 2 20.0% 64% 3.6 8 2 – – – 64% 3.6 46.6 5.6 4.25
– 15.Venrock 9 2,450 8 1 11.1% 78% 2.2 8 1 – – – 78% 2.2 46.8 8.2 4.21
– 16.Canaan*Partners 12 3,500 9 3 25.0% 59% 4.1 10 2 – – – 70% 3.0 49.1 5.5 4.19
– 17.Norwest*Venture*Partners 13 5,000 12 1 7.7% 85% 1.5 9 3 – 1 – 50% 5.0 50.8 5.9 4.16
– 18.Draper*Fisher*Jurvetson 11 5,760 9 2 18.2% 67% 3.3 9 2 – – – 67% 3.3 49.7 5.6 4.04
– 19.Shasta*Ventures 6 1,025 6 – – 100% 0.0 4 2 – – – 47% 5.3 48.2 6.8 4.03
– 20.Foundation*Capital 9 2,782 9 – – 100% 0.0 6 3 – – – 50% 5.0 48.6 6.7 3.90
– 21.DCM*Ventures 4 2,800 4 – – 100% 0.0 3 1 – – – 50% 5.0 49.3 6.3 3.77
– 22.Benchmark 6 3,302 6 – – 100% 0.0 5 1 – – – 67% 3.3 44.5 7.9 3.76
– 23.NEA 30 16,442 28 2 6.7% 87% 1.3 24 6 – – – 67% 3.3 48.4 6.3 3.64
– 24.Institutional*Venture*Partners 8 5,400 8 – – 100% 0.0 6 2 – – – 57% 4.3 47.3 6.6 3.62
– 25.General*Catalyst*Partners 11 3,000 11 – – 100% 0.0 8 3 – – – 56% 4.4 45.6 6.5 3.62
– 26.Crosslink*Capital 6 1,600 6 – – 100% 0.0 4 2 – – – 47% 5.3 51.8 5.5 3.60
– 27.Spark*Capital 9 1,825 9 – – 100% 0.0 8 1 – – – 78% 2.2 42.4 8.5 3.58
– 28.Menlo*Ventures 11 2,000 10 1 9.1% 82% 1.8 9 2 – – – 67% 3.3 51.1 5.5 3.53
– 29.Tiger*Global*Management 3 10,000 3 – – 100% 0.0 3 – – – – 100% 0.0 37.7 10.0 3.33
– 30.Sequoia*Capital 14 4,470 14 – – 100% 0.0 12 2 – – – 74% 2.6 46.0 6.8 3.16
– 31.Founders*Fund 6 2,160 6 – – 100% 0.0 6 – – – – 100% 0.0 38.2 9.4 3.13
– 32.Mayfield*Fund 5 3,000 5 – – 100% 0.0 – 5 – – – 100% 0.0 43.4 9.3 3.10
– 33.FirstMark*Capital 14 2,200 14 – – 100% 0.0 13 1 – – – 86% 1.4 45.7 7.8 3.09
– 34.Redpoint*Ventures 13 3,800 13 – – 100% 0.0 11 2 – – – 72% 2.8 46.3 6.3 3.05
– 35.Index*Ventures 3 3,733 3 – – 100% 0.0 3 – – – – 100% 0.0 42.0 8.9 2.98
– 36.Foundry*Group 4 1,128 4 – – 100% 0.0 4 – – – – 100% 0.0 46.0 8.5 2.84
– 37. Andreessen*Horowitz 16 4,289 15 1 6.3% 88% 1.3 15 1 – – – 88% 1.3 50.0 6.1 2.85
– 38.US*Venture*Partners 6 1,225 5 1 16.7% 67% 3.3 6 – – – – 100% 0.0 50.3 4.9 2.74
– 39.Matrix*Partners 9 5,050 9 – – 100% 0.0 8 – – 1 – 78% 2.2 49.2 6.0 2.73
– 40.August*Capital 7 1,300 7 – – 100% 0.0 6 1 – – – 71% 2.9 51.0 4.9 2.59
– 41.Tenaya*Capital 5 1,487 5 – – 100% 0.0 5 – – – – 100% 0.0 47.0 7.3 2.43
– 42.Bessemer*Venture*Partners 13 5,600 13 – – 100% 0.0 13 – – – – 100% 0.0 45.0 7.0 2.33
– 43.Meritech*Capital*Partners 6 2,064 6 – – 100% 0.0 6 – – – – 100% 0.0 45.8 6.3 2.09
– 44.Atlas*Life*Sciences 5 2,545 5 – – 100% 0.0 5 – – – – 100% 0.0 51.0 6.1 2.02
– 45.Madrona*Venture*Group 6 1,300 6 – – 100% 0.0 6 – – – – 100% 0.0 53.8 5.4 1.79
– 46.Bluerun*Ventures 2 1,065 2 – – 100% 0.0 2 – – – – 100% 0.0 53.0 3.9 1.29
$250$Million$to$$1$Billion
– 1. Y*Combinator 11 1,000 10 1 9.1% 82% 1.8 6 4 1 – – 38% 6.2 36.4 8.1 5.35
– 2. Formation*8 10 948 9 1 10.0% 80% 2.0 6 4 – – – 47% 5.3 34.6 7.2 4.84
– 3. Upfront*Ventures 6 658 5 1 16.7% 67% 3.3 5 – 1 – – 67% 3.3 47.3 7.3 4.65
– 4. True*Ventures 7 890 7 – – 100% 0.0 4 3 – – – 43% 5.7 47.0 7.9 4.54
– 5. Iconiq*Capital 5 528 5 – – 100% 0.0 4 1 – – – 60% 4.0 40.8 9.4 4.46
– 6. Thrive*Capital 6 597 6 – – 100% 0.0 3 3 – – – 40% 6.0 32.5 7.3 4.44
– 7. Emergence*Capital 7 575 6 1 14.3% 71% 2.9 6 – – 1 – 71% 2.9 47.6 6.6 4.12
– 8. Storm*Ventures 6 825 6 – – 100% 0.0 2 3 – 1 – 27% 7.3 53.2 4.8 4.05
– 9. Greycroft*Partners 9 593 8 1 11.1% 78% 2.2 9 – – – – 100% 0.0 47.6 7.8 3.35
– 10.RRE*Ventures 6 810 6 – – 100% 0.0 5 1 – – – 67% 3.3 54.2 5.6 2.97
– 11.First*Round*Capital 7 748 7 – – 100% 0.0 7 – – – – 100% 0.0 47.4 7.2 2.38
– 12.Pelion*Venture*Partners 5 610 5 – – 100% 0.0 5 – – – – 100% 0.0 47.6 7.1 2.38
– 13.Sutter*Hill*Ventures 7 700 7 – – 100% 0.0 7 – – – – 100% 0.0 49.3 6.2 2.06
– 14.Union*Square*Ventures 5 883 5 – – 100% 0.0 5 – – – – 100% 0.0 52.8 4.6 1.53
$250$Million$and$Less
– 1. Floodgate 2 224 1 1 50.0% – 10.0 1 1 – – – – 10.0 42.5 9.3 9.78
– 2. Cowboy*Ventures 2 97 1 1 50.0% – 10.0 1 1 – – – – 10.0 39.0 9.2 9.74
– 3. Felicis*Ventures 4 245 3 1 25.0% 50% 5.0 2 2 – – – 33% 6.7 38.8 10.0 7.22
– 4. Aspect*Ventures 2 150 – 2 100.0% 100% 0.0 1 1 – – – – 10.0 48.0 7.6 5.87
– 5. SoftTech*VC 3 155 3 – – 100% 0.0 2 – 1 – – 33% 6.7 40.3 9.6 5.41
– 6. Ribbit*Capital 3 224 3 – – 100% 0.0 2 – – 1 – 33% 6.7 39.7 9.2 5.30
– 7. Canvas*Venture*Fund 5 175 4 1 20.0% 60% 4.0 4 1 – – – 60% 4.0 51.6 5.7 4.58
– 8. Lowercase*Capital 2 30 2 – – 100% 0.0 2 – – – – 100% 0.0 36.0 8.8 2.95
– 9. Accomplice*VC 7 200 7 – – 100% 0.0 7 – – – – 100% 0.0 45.4 6.9 2.29
– 10.SV*Angel 5 100 5 – – 100% 0.0 5 – – – – 100% 0.0 37.8 5.7 1.91
– 11.Blumberg*Capital 2 240 2 – – 100% 0.0 2 – – – – 100% 0.0 52.0 4.8 1.61
Total 546 $$166,467 505 41 7.5% 86% 1.4 425 110 4 7 – 65% 3.5 45.9 7.0 3.98


   2
Ranking List, Grouped by Headcount of Senior Investment Team Members
AUM$$$Mil. Gender$Score Ethnic$Score Age$Score
(per$Venture Gender$Divrs. Gender$Score Ethnic$Divrs. Ethnic$Score Age Avg. Composite
Firm Headcount Source) Male Female %$Women Prob.$(Pg) (1GPg)*10 White Asian Black Hispanic Other Prob.$(Pr) (1GPr)*10 Avg. Score Score
Greater$than$10$People
– 1. Y%Combinator 11 $%1,000 10 1 9.1% 82% 1.8 6 4 1 – – 38% 6.2 36.4 8.1 5.35
– 2. Greylock%Partners 11 3,016 10 1 9.1% 82% 1.8 7 4 – – – 49% 5.1 45.4 7.9 4.93
– 3. Google%Ventures 12 2,000 11 1 8.3% 83% 1.7 10 1 1 – – 68% 3.2 38.0 8.9 4.58
– 4. Bain%Capital%Ventures 11 3,000 11 – – 100% 0.0 6 4 – 1 – 38% 6.2 45.0 7.4 4.53
– 5. Lightspeed%Venture%Partners 13 3,135 13 – – 100% 0.0 6 7 – – – 46% 5.4 42.9 8.1 4.51
– 6. Canaan%Partners 12 3,500 9 3 25.0% 59% 4.1 10 2 – – – 70% 3.0 49.1 5.5 4.19
– 7. Norwest%Venture%Partners 13 5,000 12 1 7.7% 85% 1.5 9 3 – 1 – 50% 5.0 50.8 5.9 4.16
– 8. Draper%Fisher%Jurvetson 11 5,760 9 2 18.2% 67% 3.3 9 2 – – – 67% 3.3 49.7 5.6 4.04
– 9. NEA 30 16,442 28 2 6.7% 87% 1.3 24 6 – – – 67% 3.3 48.4 6.3 3.64
– 10.General%Catalyst%Partners 11 3,000 11 – – 100% 0.0 8 3 – – – 56% 4.4 45.6 6.5 3.62
– 11.Menlo%Ventures 11 2,000 10 1 9.1% 82% 1.8 9 2 – – – 67% 3.3 51.1 5.5 3.53
– 12.Sequoia%Capital 14 4,470 14 – – 100% 0.0 12 2 – – – 74% 2.6 46.0 6.8 3.16
– 13.FirstMark%Capital 14 2,200 14 – – 100% 0.0 13 1 – – – 86% 1.4 45.7 7.8 3.09
– 14.Redpoint%Ventures 13 3,800 13 – – 100% 0.0 11 2 – – – 72% 2.8 46.3 6.3 3.05
– 15.Andreessen%Horowitz 16 4,289 15 1 6.3% 88% 1.3 15 1 – – – 88% 1.3 50.0 6.1 2.85
– 16.Bessemer%Venture%Partners 13 5,600 13 – – 100% 0.0 13 – – – – 100% 0.0 45.0 7.0 2.33
6$to$10$People
– 1. Social%Capital 8 1,155 4 4 50.0% 43% 5.7 4 4 – – – 43% 5.7 38.5 8.8 6.74
– 2. Battery%Ventures 10 4,500 9 1 10.0% 80% 2.0 8 2 – – – 64% 3.6 42.1 9.8 5.10
– 3. Trinity%Ventures 9 1,500 7 2 22.2% 61% 3.9 4 5 – – – 44% 5.6 51.3 5.5 4.99
– 4. Kleiner%Perkins%Caufield%&%Byers 10 4,600 7 3 30.0% 53% 4.7 7 3 – – – 53% 4.7 47.7 5.5 4.95
– 5. Formation%8 10 948 9 1 10.0% 80% 2.0 6 4 – – – 47% 5.3 34.6 7.2 4.84
– 6. Accel%Partners 8 7,790 8 – – 100% 0.0 5 3 – – – 46% 5.4 39.5 8.8 4.71
– 7. Khosla%Ventures 8 2,263 8 – – 100% 0.0 3 5 – – – 46% 5.4 44.7 8.7 4.68
– 8. Upfront%Ventures 6 658 5 1 16.7% 67% 3.3 5 – 1 – – 67% 3.3 47.3 7.3 4.65
– 9. True%Ventures 7 890 7 – – 100% 0.0 4 3 – – – 43% 5.7 47.0 7.9 4.54
– 10.Scale%Venture%Partners 7 1,200 4 3 42.9% 43% 5.7 7 – – – – 100% 0.0 46.7 7.7 4.48
– 11.Thrive%Capital 6 597 6 – – 100% 0.0 3 3 – – – 40% 6.0 32.5 7.3 4.44
– 12.Charles%River%Ventures 9 1,500 8 1 11.1% 78% 2.2 7 1 – 1 – 58% 4.2 41.2 6.8 4.38
– 13.Softbank%Capital 10 2,596 8 2 20.0% 64% 3.6 8 2 – – – 64% 3.6 46.6 5.6 4.25
– 14.Emergence%Capital 7 575 6 1 14.3% 71% 2.9 6 – – 1 – 71% 2.9 47.6 6.6 4.12
– 15.Storm%Ventures 6 825 6 – – 100% 0.0 2 3 – 1 – 27% 7.3 53.2 4.8 4.05
– 16.Shasta%Ventures 6 1,025 6 – – 100% 0.0 4 2 – – – 47% 5.3 48.2 6.8 4.03
– 17.Venrock 9 2,450 8 1 11.1% 78% 2.2 8 1 – – – 78% 2.2 47.9 7.5 3.99
– 18.Foundation%Capital 9 2,782 9 – – 100% 0.0 6 3 – – – 50% 5.0 48.6 6.7 3.90
– 19.Benchmark 6 3,302 6 – – 100% 0.0 5 1 – – – 67% 3.3 44.5 7.9 3.76
– 20.Institutional%Venture%Partners 8 5,400 8 – – 100% 0.0 6 2 – – – 57% 4.3 47.3 6.6 3.62
– 21.Crosslink%Capital 6 1,600 6 – – 100% 0.0 4 2 – – – 47% 5.3 51.8 5.5 3.60
– 22.Spark%Capital 9 1,825 9 – – 100% 0.0 8 1 – – – 78% 2.2 42.4 8.5 3.58
– 23.Greycroft%Partners 9 593 8 1 11.1% 78% 2.2 9 – – – – 100% 0.0 47.6 7.8 3.35
– 24.Founders%Fund 6 2,160 6 – – 100% 0.0 6 – – – – 100% 0.0 38.2 9.4 3.13
– 25.RRE%Ventures 6 810 6 – – 100% 0.0 5 1 – – – 67% 3.3 54.2 5.6 2.97
– 26.US%Venture%Partners 6 1,225 5 1 16.7% 67% 3.3 6 – – – – 100% 0.0 50.3 4.9 2.74
– 27.Matrix%Partners 9 5,050 9 – – 100% 0.0 8 – – 1 – 78% 2.2 49.2 6.0 2.73
– 28.August%Capital 7 1,300 7 – – 100% 0.0 6 1 – – – 71% 2.9 51.0 4.9 2.59
– 29.First%Round%Capital 7 748 7 – – 100% 0.0 7 – – – – 100% 0.0 47.4 7.2 2.38
– 30.Accomplice%VC 7 200 7 – – 100% 0.0 7 – – – – 100% 0.0 45.4 6.9 2.29
– 31. Meritech%Capital%Partners 6 2,064 6 – – 100% 0.0 6 – – – – 100% 0.0 45.8 6.3 2.09
– 32.Sutter%Hill%Ventures 7 700 7 – – 100% 0.0 7 – – – – 100% 0.0 49.3 6.2 2.06
– 33.Madrona%Venture%Group 6 1,300 6 – – 100% 0.0 6 – – – – 100% 0.0 53.8 5.4 1.79
5$or$Less$People
– 1. Floodgate 2 224 1 1 50.0% – 10.0 1 1 – – – – 10.0 42.5 9.3 9.78
– 2. Cowboy%Ventures 2 97 1 1 50.0% – 10.0 1 1 – – – – 10.0 39.0 9.2 9.74
– 3. Felicis%Ventures 4 245 3 1 25.0% 50% 5.0 2 2 – – – 33% 6.7 38.8 10.0 7.22
– 4. Aspect%Ventures 2 150 – 2 100.0% 100% 0.0 1 1 – – – – 10.0 48.0 7.6 5.87
– 5. SoftTech%VC 3 155 3 – – 100% 0.0 2 – 1 – – 33% 6.7 40.3 9.6 5.41
– 6. Ribbit%Capital 3 224 3 – – 100% 0.0 2 – – 1 – 33% 6.7 39.7 9.2 5.30
– 7. GGV%Capital 4 2,705 4 – – 100% 0.0 3 1 – – – 50% 5.0 44.8 10.0 5.00
– 8. Canvas%Venture%Fund 5 175 4 1 20.0% 60% 4.0 4 1 – – – 60% 4.0 51.6 5.7 4.58
– 9. Iconiq%Capital 5 528 5 – – 100% 0.0 4 1 – – – 60% 4.0 40.8 9.4 4.46
– 10.DCM%Ventures 4 2,800 4 – – 100% 0.0 3 1 – – – 50% 5.0 49.3 6.3 3.77
– 11.Tiger%Global%Management 3 10,000 3 – – 100% 0.0 3 – – – – 100% 0.0 37.7 10.0 3.33
– 12.Mayfield%Fund 5 3,000 5 – – 100% 0.0 – 5 – – – 100% 0.0 43.4 9.3 3.10
– 13.Index%Ventures 3 3,733 3 – – 100% 0.0 3 – – – – 100% 0.0 42.0 8.9 2.98
– 14.Lowercase%Capital 2 30 2 – – 100% 0.0 2 – – – – 100% 0.0 36.0 8.8 2.95
– 15.Foundry%Group 4 1,128 4 – – 100% 0.0 4 – – – – 100% 0.0 46.0 8.5 2.84
– 16.Tenaya%Capital 5 1,487 5 – – 100% 0.0 5 – – – – 100% 0.0 47.0 7.3 2.43
– 17.Pelion%Venture%Partners 5 610 5 – – 100% 0.0 5 – – – – 100% 0.0 47.6 7.1 2.38
– 18.Atlas%Life%Sciences 5 2,545 5 – – 100% 0.0 5 – – – – 100% 0.0 51.0 6.1 2.02
– 19.SV%Angel 5 100 5 – – 100% 0.0 5 – – – – 100% 0.0 37.8 5.7 1.91
– 20.Blumberg%Capital 2 240 2 – – 100% 0.0 2 – – – – 100% 0.0 52.0 4.8 1.61
– 21.Union%Square%Ventures 5 883 5 – – 100% 0.0 5 – – – – 100% 0.0 52.8 4.6 1.53
– 22.Bluerun%Ventures 2 1,065 2 – – 100% 0.0 2 – – – – 100% 0.0 53.0 3.9 1.29
Total 546 $$166,467 505 41 7.5% 86% 1.4 425 110 4 7 – 65% 3.5 45.9 7.0 3.98


   3
Ranking List Overall of Senior Investment Team Members
AUM$$$Mil. Gender$Score Ethnic$Score Age$Score
(per$Venture Gender$Divrs. Gender$Score Ethnic$Divrs. Ethnic$Score Age Avg. Composite
Firm Headcount Source) Male Female %$Women Prob.$(Pg) (1GPg)*10 White Asian Black Hispanic Other Prob.$(Pr) (1GPr)*10 Avg. Score Score
Overall$Scores
– 1. Floodgate 2 $.224 1 1 50.0% – 10.0 1 1 – – – – 10.0 42.5 9.3 9.78
– 2. Cowboy.Ventures 2 97 1 1 50.0% – 10.0 1 1 – – – – 10.0 39.0 9.2 9.74
– 3. Felicis.Ventures 4 245 3 1 25.0% 50% 5.0 2 2 – – – 33% 6.7 38.8 10.0 7.22
– 4. Social.Capital 8 1,155 4 4 50.0% 43% 5.7 4 4 – – – 43% 5.7 38.5 8.8 6.74
– 5. Aspect.Ventures 2 150 – 2 100.0% 100% 0.0 1 1 – – – – 10.0 48.0 7.6 5.87
– 6. SoftTech.VC 3 155 3 – – 100% 0.0 2 – 1 – – 33% 6.7 40.3 9.6 5.41
– 7. Y.Combinator 11 1,000 10 1 9.1% 82% 1.8 6 4 1 – – 38% 6.2 36.4 8.1 5.35
– 8. Ribbit.Capital 3 224 3 – – 100% 0.0 2 – – 1 – 33% 6.7 39.7 9.2 5.30
– 9. Battery.Ventures 10 4,500 9 1 10.0% 80% 2.0 8 2 – – – 64% 3.6 42.1 9.8 5.10
– 10. GGV.Capital 4 2,705 4 – – 100% 0.0 3 1 – – – 50% 5.0 44.8 10.0 5.00
– 11. Trinity.Ventures 9 1,500 7 2 22.2% 61% 3.9 4 5 – – – 44% 5.6 51.3 5.5 4.99
– 12. Kleiner.Perkins.Caufield.&.Byers 10 4,600 7 3 30.0% 53% 4.7 7 3 – – – 53% 4.7 47.7 5.5 4.95
– 13. Greylock.Partners 11 3,016 10 1 9.1% 82% 1.8 7 4 – – – 49% 5.1 45.4 7.9 4.93
– 14. Formation.8 10 948 9 1 10.0% 80% 2.0 6 4 – – – 47% 5.3 34.6 7.2 4.84
– 15. Accel.Partners 8 7,790 8 – – 100% 0.0 5 3 – – – 46% 5.4 39.5 8.8 4.71
– 16. Khosla.Ventures 8 2,263 8 – – 100% 0.0 3 5 – – – 46% 5.4 44.7 8.7 4.68
– 17. Upfront.Ventures 6 658 5 1 16.7% 67% 3.3 5 – 1 – – 67% 3.3 47.3 7.3 4.65
– 18. Google.Ventures 12 2,000 11 1 8.3% 83% 1.7 10 1 1 – – 68% 3.2 38.0 8.9 4.58
– 19. Canvas.Venture.Fund 5 175 4 1 20.0% 60% 4.0 4 1 – – – 60% 4.0 51.6 5.7 4.58
– 20. True.Ventures 7 890 7 – – 100% 0.0 4 3 – – – 43% 5.7 47.0 7.9 4.54
– 21. Bain.Capital.Ventures 11 3,000 11 – – 100% 0.0 6 4 – 1 – 38% 6.2 45.0 7.4 4.53
– 22. Lightspeed.Venture.Partners 13 3,135 13 – – 100% 0.0 6 7 – – – 46% 5.4 42.9 8.1 4.51
– 23. Scale.Venture.Partners 7 1,200 4 3 42.9% 43% 5.7 7 – – – – 100% 0.0 46.7 7.7 4.48
– 24. Iconiq.Capital 5 528 5 – – 100% 0.0 4 1 – – – 60% 4.0 40.8 9.4 4.46
– 25. Thrive.Capital 6 597 6 – – 100% 0.0 3 3 – – – 40% 6.0 32.5 7.3 4.44
– 26. Charles.River.Ventures 9 1,500 8 1 11.1% 78% 2.2 7 1 – 1 – 58% 4.2 41.2 6.8 4.38
– 27. Softbank.Capital 10 2,596 8 2 20.0% 64% 3.6 8 2 – – – 64% 3.6 46.6 5.6 4.25
– 28. Canaan.Partners 12 3,500 9 3 25.0% 59% 4.1 10 2 – – – 70% 3.0 49.1 5.5 4.19
– 29. Norwest.Venture.Partners 13 5,000 12 1 7.7% 85% 1.5 9 3 – 1 – 50% 5.0 50.8 5.9 4.16
– 30. Emergence.Capital 7 575 6 1 14.3% 71% 2.9 6 – – 1 – 71% 2.9 47.6 6.6 4.12
– 31. Storm.Ventures 6 825 6 – – 100% 0.0 2 3 – 1 – 27% 7.3 53.2 4.8 4.05
– 32. Draper.Fisher.Jurvetson 11 5,760 9 2 18.2% 67% 3.3 9 2 – – – 67% 3.3 49.7 5.6 4.04
– 33. Shasta.Ventures 6 1,025 6 – – 100% 0.0 4 2 – – – 47% 5.3 48.2 6.8 4.03
– 34. Venrock 9 2,450 8 1 11.1% 78% 2.2 8 1 – – – 78% 2.2 47.9 7.5 3.99
– 35. Foundation.Capital 9 2,782 9 – – 100% 0.0 6 3 – – – 50% 5.0 48.6 6.7 3.90
– 36. DCM.Ventures 4 2,800 4 – – 100% 0.0 3 1 – – – 50% 5.0 49.3 6.3 3.77
– 37. Benchmark 6 3,302 6 – – 100% 0.0 5 1 – – – 67% 3.3 44.5 7.9 3.76
– 38. NEA 30 16,442 28 2 6.7% 87% 1.3 24 6 – – – 67% 3.3 48.4 6.3 3.64
– 39. Institutional.Venture.Partners 8 5,400 8 – – 100% 0.0 6 2 – – – 57% 4.3 47.3 6.6 3.62
– 40. General.Catalyst.Partners 11 3,000 11 – – 100% 0.0 8 3 – – – 56% 4.4 45.6 6.5 3.62
– 41. Crosslink.Capital 6 1,600 6 – – 100% 0.0 4 2 – – – 47% 5.3 51.8 5.5 3.60
– 42. Spark.Capital 9 1,825 9 – – 100% 0.0 8 1 – – – 78% 2.2 42.4 8.5 3.58
– 43. Menlo.Ventures 11 2,000 10 1 9.1% 82% 1.8 9 2 – – – 67% 3.3 51.1 5.5 3.53
– 44. Greycroft.Partners 9 593 8 1 11.1% 78% 2.2 9 – – – – 100% 0.0 47.6 7.8 3.35
– 45. Tiger.Global.Management 3 10,000 3 – – 100% 0.0 3 – – – – 100% 0.0 37.7 10.0 3.33
– 46. Sequoia.Capital 14 4,470 14 – – 100% 0.0 12 2 – – – 74% 2.6 46.0 6.8 3.16
– 47. Founders.Fund 6 2,160 6 – – 100% 0.0 6 – – – – 100% 0.0 38.2 9.4 3.13
– 48. Mayfield.Fund 5 3,000 5 – – 100% 0.0 – 5 – – – 100% 0.0 43.4 9.3 3.10
– 49. FirstMark.Capital 14 2,200 14 – – 100% 0.0 13 1 – – – 86% 1.4 45.7 7.8 3.09
– 50. Redpoint.Ventures 13 3,800 13 – – 100% 0.0 11 2 – – – 72% 2.8 46.3 6.3 3.05
– 51. Index.Ventures 3 3,733 3 – – 100% 0.0 3 – – – – 100% 0.0 42.0 8.9 2.98
– 52. RRE.Ventures 6 810 6 – – 100% 0.0 5 1 – – – 67% 3.3 54.2 5.6 2.97
– 53. Lowercase.Capital 2 30 2 – – 100% 0.0 2 – – – – 100% 0.0 36.0 8.8 2.95
– 54. Andreessen.Horowitz 16 4,289 15 1 6.3% 88% 1.3 15 1 – – – 88% 1.3 50.0 6.1 2.85
– 55. Foundry.Group 4 1,128 4 – – 100% 0.0 4 – – – – 100% 0.0 46.0 8.5 2.84
– 56. US.Venture.Partners 6 1,225 5 1 16.7% 67% 3.3 6 – – – – 100% 0.0 50.3 4.9 2.74
– 57. Matrix.Partners 9 5,050 9 – – 100% 0.0 8 – – 1 – 78% 2.2 49.2 6.0 2.73
– 58. August.Capital 7 1,300 7 – – 100% 0.0 6 1 – – – 71% 2.9 51.0 4.9 2.59
– 59. Tenaya.Capital 5 1,487 5 – – 100% 0.0 5 – – – – 100% 0.0 47.0 7.3 2.43
– 60. First.Round.Capital 7 748 7 – – 100% 0.0 7 – – – – 100% 0.0 47.4 7.2 2.38
– 61. Pelion.Venture.Partners 5 610 5 – – 100% 0.0 5 – – – – 100% 0.0 47.6 7.1 2.38
– 62. Bessemer.Venture.Partners 13 5,600 13 – – 100% 0.0 13 – – – – 100% 0.0 45.0 7.0 2.33
– 63. Accomplice.VC 7 200 7 – – 100% 0.0 7 – – – – 100% 0.0 45.4 6.9 2.29
– 64. Meritech.Capital.Partners 6 2,064 6 – – 100% 0.0 6 – – – – 100% 0.0 45.8 6.3 2.09
– 65. Sutter.Hill.Ventures 7 700 7 – – 100% 0.0 7 – – – – 100% 0.0 49.3 6.2 2.06
– 66. Atlas.Life.Sciences 5 2,545 5 – – 100% 0.0 5 – – – – 100% 0.0 51.0 6.1 2.02
– 67. SV.Angel 5 100 5 – – 100% 0.0 5 – – – – 100% 0.0 37.8 5.7 1.91
– 68. Madrona.Venture.Group 6 1,300 6 – – 100% 0.0 6 – – – – 100% 0.0 53.8 5.4 1.79
– 69. Blumberg.Capital 2 240 2 – – 100% 0.0 2 – – – – 100% 0.0 52.0 4.8 1.61
– 70. Union.Square.Ventures 5 883 5 – – 100% 0.0 5 – – – – 100% 0.0 52.8 4.6 1.53
– 71. Bluerun.Ventures 2 1,065 2 – – 100% 0.0 2 – – – – 100% 0.0 53.0 3.9 1.29
Total 546 $$166,467 505 41 7.5% 86% 1.4 425 110 4 7 – 65% 3.5 45.9 7.0 3.98
%"of"total 92.5% 7.5% 77.8% 20.1% 0.7% 1.3% –


   4
This methodology walk-through addresses the following areas:
(i)   Firm selection
(ii)   People selection
(iii)   Demographic variable estimation
(iv)   Ranking methodology
(v)   Appendix: Supplementary schedules are included at the end
I. Firm Selection
To compose a study of VC demographics, we wanted to select a representative number of funds with the following
characteristics:
(i)   Firms based in the US: We are focusing on the diversity decisions of US firms, so international firms were
excluded
(ii)   Traditional technology VC firms: We are focused on VC firms that invest mainly in technology-related startups;
notably this excludes biomedical / life science-focused VC firms or firms (though we include life sciences team
members if within a broader fund); we oriented around firms that have a Series A / Series B practice but
included any investors in growth stage products if broken out (e.g. DFJ, Sequoia)
(iii)   Largest Firms: Using a combination of VentureSource and Mattermark, we force-ranked VC firms by AUM
and only looked at funds above $275M of AUM – we wanted to capture the firms which on a $ capital basis
represented a sizable portion of the market.
(iv)   Active Firms: We did not include any firms that are less active which we estimated as either not having raised a
new fund in the last 5 years or that were not building their portfolio with new investments; this was based on
public signals or VentureSource
(v)   High Mindshare: We included certain firms that commanded a high mindshare score from Mattermark to the
extent they weren’t already included (e.g. if below $275M AUM)
This resulted in a list of 71 firms representing over $160B in AUM, per VentureSource (see p. 1). We consider this a starting
point and can add additional peer firms as time goes on.
II. People Selection
For each of the firms, we wanted to measure the diversity of the “investment team leadership”. We are defining “investment
team leadership” as anyone holding the title of General Partner, Partner, Managing Director, and any other variation of the
senior investment titles on the investment team. We also include active Venture Partners and Board Partners to the extent
they are actively involved on the investment team. For A16Z, KPCB, Sequoia and Y-Combinator who designate all their
team members as “Partner”, we approximated the leadership team based on tenure, experience, leading deals and taking
board seats.
We do not include any junior investment team members (e.g. Associates, Vice Presidents or Principals) or other teams
(operating or growth teams, finance team, or other non-investment team functions). We also excluded people based in
international offices of US VC firms as we are focusing on team diversity within the US.
This gave us a list of 546 investment team leaders across the 71 firms.
There are a few reasons to focus on “investment team leaders”:
(i)   Leaders drive the direction of the firm: These individuals most directly make decisions that affect the direction
of the firm, have investment-decision power and represent the firm on boards
(ii)   Total would paint a different picture: People have already caught on that the few women hired in VC tend to be
hired in non-senior positions and/or non-investment team roles1
; Appendix 1 has our results on this disparity
(iii)   Data is stable and consistent: Firms more consistently disclose the leaders on the website versus other team
members, so data availability is an issue for a total view. In addition, turnover is significantly higher at the
junior level, even on the investment team, as firms have different policies (e.g. 2-year programs).
III. Demographic Variable Estimation
For each of the individuals, we measured the following:
(i)   Gender
(ii)   Race / Ethnicity: We used the same definitions as the 2010 US census, which the large public tech firms also
follow in their diversity monitoring. Categories are the following:


1 CNBC (http://www.cnbc.com/2015/03/27/waiting-for-pao-verdict-where-are-women-at-top-vc-funds.html);
Fortune (http://fortune.com/2014/02/06/venture-capitals-stunning-lack-of-female-decision-makers/)
 
	
   5
a.   “White” refers to a person having origins in any of the original peoples of Europe, the Middle East, or
North Africa
b.   “Black or African American” refers to a person having origins in any of the Black racial groups of Africa
c.   “Asian” refers to a person having origins in any of the original peoples of the Far East, Southeast Asia, or
the Indian subcontinent
d.   “Hispanic” refers to people who identify their origin as Hispanic, Latino or Spanish
e.   “Other” includes Native Hawaiian, Other Pacific Islander, American Indian or Alaskan Native
(iii)   Age: We calculated age based on publicly available date-of-birth information. In instances where the date-of-
birth wasn’t available, we estimated age with LinkedIn by taking high school graduation year minus 18 or
college graduation year minus 22 and used 6/30 as the month/day. NOTE: We were only able to find a data
point for age for 532 individuals (97% of total).
IV. Ranking Methodology
The ranking methodology combines 3 variables:
(i)   A gender diversity score
(ii)   A race diversity score
(iii)   An age score
For the gender diversity score and the ethnic diversity score, we use a diversity index based on probability to measure the
degree of concentration when individuals are classified into types. Simply stated, we create a diversity score based on the
probability that two investment team leaders taken at random from a VC firm will represent the same type. This approach
uses the same principal as the Simpson index (ecology) and Herfindahl index (economics)2
and has already been used in
population diversity studies3
.
Gender Diversity Score
The gender diversity score is calculated using the probability that any two individuals selected at random will be the same
gender. This is calculated as follows:
𝑃" = 	
  
1
𝑁(𝑁 − 1)
× 𝑀 𝑀 − 1 + 𝑊 𝑊 − 1
Pg = probability that two people randomly selected are the same (i.e. randomly select two men or two women)
N = total senior investment team members at a firm
M = number of men
W = number of women
Therefore, for a firm with 2 men and 2 women, the probability of randomly picking two people that are the same is:
𝑃" = 	
  
1
4(4 − 1)
× 2 2 − 1 + 2 2 − 1 = 33.3%
The gender score is simply 1 – this calculated probability, multiplied by 10 (for a scale of 0 to 10), or in the above example,
6.7.
𝐺𝑒𝑛𝑑𝑒𝑟	
   𝐷 𝑖𝑣𝑒𝑟𝑠𝑖𝑡𝑦	
   𝑆 𝑐𝑜𝑟𝑒 = 1 − 𝑃" ×10
The benefit of this methodology is that absolute diversity (i.e. agnostic to gender) is valued. In other words, a firm with only
men will receive a probability of picking 2 people at random that are the same of 100% which would translate into a gender
score of 0, but a firm with only women would also receive a gender score of 0. The higher the score, the better the diversity
profile.
Ethnic Diversity Score
The ethnicity score is based on the same principle as the gender score, only expanded to all the racial/ethnic categories:
White, Asian, Black, Latino/Hispanic, Other.
𝑃B = 	
  
1
𝑁(𝑁 − 1)
× 𝑊 𝑊 − 1 + 𝐴 𝐴 − 1 + 𝐵 𝐵 − 1 + 𝐻 𝐻 − 1 + 𝑂 𝑂 − 1


2 Diversity Index: https://en.wikipedia.org/wiki/Diversity_index#Simpson_index
3 USAToday: http://usatoday30.usatoday.com/news/nation/census/county-by-county-diversity.htm 	


   6
Pr = probability that two people randomly selected are the same (e.g. randomly select two While individuals)
N = total senior investment team members
W = number of White individuals
A = number of Asian individuals
B = number of Black individuals
H = number of Latino/Hispanic individuals
O = number of individuals with racial/ethnic category of “Other”
In this case, the ethnic diversity score is also 1 – this calculated probability, multiplied by 10 (for a scale of 0 to 10).
𝐸𝑡ℎ𝑛𝑖𝑐	
   𝐷 𝑖𝑣𝑒𝑟𝑠𝑖𝑡𝑦	
   𝑆 𝑐𝑜𝑟𝑒 = 1 − 𝑃" ×10
Below is an example of the Ethnic Diversity Score across a hypothetical 10 person firm with varying allocations.
W A B H O N Pr Score
2 2 2 2 2 10 11% 8.9
4 2 2 2 0 10 20% 8.0
6 2 2 0 0 10 38% 6.2
8 2 0 0 0 10 64% 3.6
10 0 0 0 0 10 100% 0
Note that while the 1st
orientation has a perfectly equal balance, there is always some chance that the two randomly selected
individuals will be the same (resulting in a score of 8.9 instead of intuitively a ‘perfect’ score); this is not an issue because for
similarly-sized firms, the score will still be better than the less diverse firms with similar headcount. For this reason we have
attempted to create sub-lists based on size (discussed below).
Age Score
The Age Score assigns a value to each senior investment team member based on his/her age.
To figure out what ages receive a perfect score, we looked at how old partners who did the best deals were when they
invested in those deals’ Series A or Series B, the earliest venture rounds where product-market fit is not readily apparent. To
do this, we looked at VentureSource’s list of top venture outcomes (defined as largest exits via M&A or IPO of VC-backed
companies) and compiled a list of all the partners who led the rounds in the corresponding Series A and/or B of these
outcomes. The results can be seen in the cumulative distribution function (CDF) below and the table with deals used can be
seen in Appendix 3.
Looking at this chart, 60% of the Series A’s and B’s of the largest exists were done by partners between the age of 35 and 46
(20% and 80%, respectively).
–
10.0%
20.0%
30.0%
40.0%
50.0%
60.0%
70.0%
80.0%
90.0%
100.0%
22 23 24 25 26 27 28 29 30 31 32 33 34 35 36 37 38 39 40 41 42 43 44 45 46 47 48 49 50 51 52 53 54 55 56 57 58 59 60 61 62 63 64 65
CDF	
  of	
  Ages	
  @	
  Series	
  A/B	
  of	
  Best	
  Deals
20%:	
  35	
  yrs
80%:	
  46	
  yrs
Median:	
  41
 
	
   7
For the age score, we assigned any individual with the age between 35 and 46 to a perfect score of 10. Before 35 (to a
minimum of 22) and after 46 (to a maximum of 65) a decreased score was given. In order to give more “future credit” to
those younger than 35, we decreased the scores below 35 linearly and after 46 exponentially (i.e. a score 1 year outside the
alley on the low end, 34, will be higher than the score 1 year outside the alley on the high end, 47). A firm’s age score is
simply the average of the age scores of the individuals.
The argument for considering age is that younger partners are:
(i)   More likely to be connected to newer technology
(ii)   More likely to be connected to younger founders
(iii)   More likely to be hungrier in their career
Note that this is purely conjecture to explain the data.
Composite Score: The Composite Score is the simple average between the Gender Diversity Score, Ethnic Diversity Score
and the Age Score. Calculating the composite score this way reflects the position that gender, ethnicity and age are equally
relevant variables in evaluating a fund’s future relevance.
Ultimately when comparing firms, we also grouped firms of similar size together and considered two approaches to do so,
presented on the first two pages of this document:
(i)   By AUM:
a.   Funds up to $250M AUM
b.   Funds from $251M to $1.0B AUM
c.   Funds with greater than $1.0B AUM
(ii)   By Headcount of “senior investment team” members:
a.   Funds with 5 people or less
b.   Funds with 6-10 people
c.   Funds with over 10 people
We submitted data points to firms in a request for comment to allow firms the ability to fact check the information.
–
2.0
4.0
6.0
8.0
10.0
22 23 24 25 26 27 28 29 30 31 32 33 34 35 36 37 38 39 40 41 42 43 44 45 46 47 48 49 50 51 52 53 54 55 56 57 58 59 60 61 62 63 64 65
Score	
  Ascribed	
  to	
  Each	
  Age
 
	
   8
Appendix 1: Investment Team Leadership vs. Full Team
The first three bars are based on data collected:
(i)   Senior Investment Team: Representation of main data collected. Includes General Partners, Partners, Managing
Directors, Venture Partners etc. on the investment team
(ii)   Junior Investment Team: Other members of the investment team such as Principals, VPs, Associates, Analysts,
Advisers, etc.
(iii)   Non-investment team: Generally includes operational / support roles such as finance, legal, etc.
NOTE: Categories (ii) and (iii) have an issue of data availability (i.e. not all firms show their finance team) and should be
considered more “directional”.
Regarding gender, it is clear that women are hired more frequently into the junior ranks but do not have the same presence on
the senior team. Further, many more women exist outside of the team. The US population estimates for 2020 is shown on
the far right – both the VC community and the tech industry is far from the 50/50 split.
Regarding race, the senior investment team in venture capital is 78% white which is less diverse than the large tech
companies and significantly worse than the US population estimates for 2020.
92%	
  
80%	
  
60%	
  
89%	
  
77%	
  
49%	
  
8%	
  
20%	
  
40%	
  
11%	
  
23%	
  
51%	
  
Senior	
  Investment	
  Team Junior	
  Investment	
  Team Non-­‐Investment	
  Team Y-­‐Combinator	
  (W'14) Large	
  Tech	
  Avg.	
  (Leaders) US	
  in	
  2020
Gender	
  Distribution
%	
  Men %	
  Women
78%	
  
63%	
  
86%	
  
70%	
  
60%	
  
20%	
  
32%	
  
13%	
  
21%	
  
6%	
  
1%	
   2%	
   1%	
   2%	
  
12%	
  
1%	
   2%	
   1%	
   3%	
  
19%	
  
0%	
  
3%	
  
Senior	
  Investment	
  Team Junior	
  Investment	
  Team Non-­‐Investment	
  Team Large	
  Tech	
  Avg.	
  (Leaders) US	
  in	
  2020
Race/Ethnic	
  Distribution
%	
  White %	
  Asian Black Hispanic Other	
  /	
  2+
 
	
   9
An updated scatter-plot of % women and % minorities can be found below. The vast majority of funds are below where the
US will be, and the magnitude of the disparity is largest when looking at representation of women vs. the US (i.e. firms are
very far away from 50%).
–
10%
20%
30%
40%
50%
60%
70%
80%
90%
100%
– 20% 40% 60% 80% 100%
%  Women
%  Minority
Felicis
Trinity
Mayfield
KPCB
Floodgate,  
Cowboy,
Social  Capital
Khosla
Scale
Canaan
US 2020:  
51%  Women
US 2020:  
39%  Minorities
Storm
Aspect
Tech Giants
 
	
   10
Appendix 2: US and Tech Giant Comps
The US Census data broken out is shown below.
The array of corresponding statistics for the leadership of large tech firms is below:
Our 2020
Designation Classification 2013 Stats %s
White	
  alone	
  	
  (non-­‐Hispanic) White 62.6% 199,400 59.6%
Black	
  or	
  African	
  American	
  alone Black 13.2% 41,594 12.4%
American	
  Indian	
  /	
  Alaskan	
  Native	
  alone Other	
  /	
  2+ 1.2% 2,432 0.7%
Asian	
  alone Asian 5.3% 19,255 5.8%
Native	
  Hawaiian	
  and	
  other	
  pacific	
  islander	
  alone Other	
  /	
  2+ 0.2% 595 0.2%
Two	
  or	
  more Other	
  /	
  2+ 2.4% 7,678 2.3%
Hispanic	
  or	
  Latino Hispanic 15.1% 63,551 19.0%
100.0% 334,505 100.0%
White 62.6% 59.6%
Asian 5.3% 5.8%
Black 13.2% 12.4%
Hispanic 15.1% 19.0%
Other	
  /	
  2+ 3.8% 3.2%
Total 100.0% 100.0%
US	
  Ethnic	
  Score 44% 41%
Male 155.7 165,036 49%
Female 160.8 169,467 51%
316.5 334,503 100%
US	
  Gender	
  Score 50% 50%
72% 75% 75% 77% 77% 77% 78% 83% 89% 92%
28% 25% 25% 23% 23% 23% 22% 17% 11%
8%
AAPL LNKD AMZN YHOO FB Tech  AVG GOOG MSFT YC  Founders
(W'14)
Senior  VCs
Gender
%  Men %  Women
63% 65% 71% 70% 71% 72% 73% 78% 78%
37% 35% 29% 30% 29% 28% 27% 22% 22%
AAPL LNKD MSFT Tech  AVG AMZN GOOG FB YHOO YC  Founders
(W'14)
Senior  VCs
Ethnicity
%  White %  Minority
 
	
   11
Appendix 3: Best Venture Outcomes
The following table shows the data used to calculate the distribution of ages of the partners who led the Series A / Series B
rounds of the best US-based deals. Highlighted rows indicate deals for which we could not find the partner, firms or dates, or
the company became insolvent shortly after exit—of these top 100 deals, 50 deals were used.
Name Round  Type Invested Post-­Valuation Closed  Date Series  A  Date Series  B  Date
1. Facebook IPO 6,840 104,178 5/18/2012 5/1/2005 4/1/2006
2. Google IPO 1,202 24,640 8/19/2004 6/7/1999 n/a
3. WhatsApp Acquisition 19,000 10/6/2014 4/8/2011 n/a
4. Twitter IPO 1,820 15,650 11/7/2013 7/1/2007 5/1/2008
5. Corvis IPO 1,139 14,168 7/28/2000 n/a n/a
6. Groupon IPO 700 13,384 11/4/2011 1/1/2008 12/1/2009
7. Continental  Cablevision Acquisition 11,800 12/22/1996 n/a n/a
8. Zynga IPO 1,000 9,044 12/16/2011 1/15/2008 7/18/2008
9. MetroPCS IPO 863 8,489 4/19/2007 10/1/1994 n/a
10. Cerent Acquisition 6,900 11/1/1999 n/a 4/1/1997
11. Webvan IPO 375 6,426 11/4/1999 n/a n/a
12. LendingClub IPO 755 6,302 12/11/2014 8/23/2007 3/19/2009
13. Workday IPO 637 5,411 10/12/2012 12/6/2006 n/a
14. Fitbit IPO 448 5,122 6/18/2015 10/10/2008 9/10/2010
15. LinkedIn IPO 217 5,053 5/19/2011 11/1/2003 10/1/2004
16. Clearwire IPO 600 4,925 3/8/2007 6/1/2004 n/a
17. Chromatis  Networks Acquisition 4,756 6/28/2000 10/1/1998 9/27/1999
18. Siara  Systems Acquisition 4,500 3/8/2000 11/15/1998 4/20/1999
19. GoPro IPO 214 3,696 6/24/2014 5/5/2011 n/a
20. ONI  Systems IPO 200 3,639 6/1/2000 12/1/1997 3/1/1998
21. Sirocco  Systems Acquisition 3,487 9/7/2000 4/27/1999 4/27/1999
22. Palo  Alto  Networks IPO 197 3,406 7/20/2012 1/1/2006 6/25/2007
23. Arista  Networks IPO 226 3,348 6/5/2014 n/a n/a
24. Hyperion  Solutions Acquisition 3,300 3/1/2007 n/a n/a
25. Vonage IPO 531 3,290 5/24/2006 n/a 11/24/2003
26. First  Republic  Bank IPO 105 3,270 12/9/2010 n/a n/a
27. Xros Acquisition 3,227 6/1/2000 1/15/1999 8/15/1999
28. Nest  Labs Acquisition 3,200 2/7/2014 9/21/2010 8/1/2011
29. Oplink  Communications IPO 247 3,177 10/4/2000 n/a n/a
30. Pandora  Media IPO 96 3,145 6/15/2011 1/1/2000 n/a
31. DoubleClick Acquisition 3,100 3/12/2008 6/10/1997 2/20/1998
32. Transmeta IPO 273 3,036 11/7/2000 n/a n/a
33. NorthPoint  Communications IPO 360 3,031 5/5/1999 n/a n/a
34. Sycamore  Networks IPO 284 3,029 10/21/1999 n/a n/a
35. Qtera Acquisition 3,004 1/28/2000 8/12/1998 4/19/1999
36. zulily IPO 140 3,000 11/15/2013 12/17/2009 8/4/2010
37. International  Power  Technology Acquisition 3,000 12/31/1991 n/a n/a
38. Veeva  Systems IPO 194 2,971 10/16/2013 n/a 6/5/2008
39. Handspring IPO 200 2,919 6/21/2000 n/a n/a
40. Cygnus  Solutions Acquisition 2,875 1/7/2000 2/15/1997 n/a
41. FireEye IPO 304 2,849 9/20/2013 1/1/2005 8/23/2006
42. ServiceNow IPO 162 2,830 6/29/2012 7/5/2005 n/a
43. TriZetto  Group Acquisition 2,700 11/3/2014 n/a n/a
44. StorageNetworks IPO 243 2,676 6/30/2000 n/a n/a
45. CoSine  Communications IPO 230 2,659 9/26/2000 n/a n/a
46. Wayfair IPO 305 2,553 10/2/2014 6/21/2011 n/a
47. Beats  Electronics  LLC Acquisition 2,500 8/1/2014 n/a n/a
48. National  Computer  Systems Acquisition 2,500 7/31/2000 n/a n/a
49. HomeAway IPO 160 2,469 6/29/2011 1/1/2005 1/1/2006
50. GT  Solar  International IPO 500 2,457 7/24/2008 n/a n/a
51. CIENA IPO 115 2,410 2/7/1997 4/1/1994 12/1/1994
52. Fanch  Communications Acquisition 2,400 11/1/1999 n/a n/a
53. Magma  Copper IPO 2,400 1/4/1996 n/a n/a
54. Akamai  Technologies IPO 234 2,378 10/28/1999 12/14/1998 4/30/1999
55. Avanex IPO 216 2,375 2/4/2000 6/29/1998 3/25/1999
56. eToys IPO 166 2,334 5/19/1999 n/a n/a
57. Ikaria Acquisition 2,300 4/17/2015 9/26/2005 n/a
58. LS  Power  Group Acquisition 2,300 4/2/2007 n/a n/a
59. Tritel IPO 237 2,296 12/13/1999 n/a n/a
60. Priceline.com IPO 160 2,277 3/30/1999 n/a n/a
61. Tableau  Software IPO 155 2,274 5/17/2013 1/1/2004 n/a
62. FreeMarkets IPO 173 2,177 12/9/1999 n/a n/a
63. Juno  Therapeutics IPO 265 2,131 12/19/2014 12/3/2013 8/5/2014
64. Intergraph  Corp. Acquisition 2,125 10/28/2010 n/a n/a
65. Tellium IPO 135 2,121 5/17/2001 n/a n/a
66. MP3.com IPO 346 2,004 7/21/1999 n/a n/a
67. Splunk IPO 213 2,001 4/19/2012 12/1/2004 1/1/2006
68. Oculus  VR Acquisition 2,000 7/21/2014 6/17/2013 12/12/2013
69. Fusion-­io IPO 204 1,990 6/9/2011 3/31/2008 4/7/2009
70. Etsy IPO 213 1,987 4/16/2015 11/1/2006 1/1/2007
71. Telecorp  PCS IPO 184 1,966 11/22/1999 n/a n/a
72. Box IPO 175 1,902 1/23/2015 10/1/2006 1/23/2008
73. Websense Acquisition 1,900 6/1/2015 n/a n/a
74. Tradex  Technologies Acquisition 1,860 3/8/2000 n/a 3/1/1998
75. Nimble  Storage IPO 168 1,836 12/13/2013 12/21/2007 12/24/2008
76. Broadband  Access  Systems Acquisition 1,835 9/29/2000 7/1/1998 n/a
77. Juniper  Networks IPO 163 1,816 6/24/1999 6/11/1996 8/5/1996
78. Green  Dot  Corp. IPO 1,816 7/22/2010 1/1/2003 n/a
79. Onvia.com IPO 168 1,806 3/1/2000 n/a n/a
80. AutoTrader.com Acquisition 1,800 1/3/2014 n/a n/a
81. Niku IPO 192 1,790 2/29/2000 n/a n/a
82. NetZero IPO 160 1,782 9/23/1999 n/a n/a
83. Legent Acquisition 1,780 5/25/1995 n/a n/a
84. VA  Linux  Systems IPO 132 1,755 12/9/1999 n/a n/a
85. KiOR IPO 150 1,754 6/24/2011 n/a n/a
86. Alios  BioPharma Acquisition 1,750 11/7/2014 n/a n/a
87. NetSuite IPO 161 1,727 12/20/2007 n/a n/a
88. Demand  Media IPO 77 1,720 1/26/2011 n/a n/a
89. Rackspace  Hosting IPO 159 1,716 8/8/2008 n/a 3/27/2000
90. AXT IPO 25 1,716 5/20/1998 n/a n/a
91. Liberty  Dialysis  LLC Acquisition 1,700 2/28/2012 n/a n/a
92. Castlight  Health IPO 178 1,675 3/14/2014 8/1/2009 n/a
93. Bindley  Western  Industries Acquisition 1,670 12/5/2000 n/a n/a
94. KAR  Auction  Services IPO 300 1,660 12/11/2009 n/a n/a
95. Reliant  Pharmaceuticals Acquisition 1,650 12/19/2007 n/a n/a
96. YouTube Acquisition 1,650 11/13/2006 11/1/2005 n/a
97. aQuantive IPO 126 1,632 2/29/2000 n/a n/a
98. Avici  Systems IPO 217 1,617 7/28/2000 5/1/1997 n/a
99. OnDeck  Capital IPO 200 1,612 12/17/2014 1/1/2006 1/1/2007
100. Bright  Horizons  Family  Solutions IPO 222 1,605 1/25/2013 n/a n/a
 
	
   12
We have a total of 127 datapoints across the 50 of the largest exits
above for which we have the actual or estimated age of the partner at
the time of the Series A or B.
Name Fund Investment Series Deal	
  Date Age	
  @	
  Deal
1. Jim	
  Breyer Accel	
  Partners Facebook Series	
  A 5/1/05 43
2. Reid	
  Hoffman Greylock	
  Partners Facebook Series	
  A 5/1/05 37
3. Peter	
  Thiel Founders	
  Fund Facebook Series	
  B 4/1/06 38
4. David	
  Sze Greylock	
  Partners Facebook Series	
  B 4/1/06 43
5. Paul	
  Madera Meritech	
  Capital	
  Partners Facebook Series	
  B 4/1/06 49
6. Ron	
  Conway SV	
  Angel Facebook Series	
  B 4/1/06 55
7. John	
  Doerr Kleiner	
  Perkins	
  Caufield	
  &	
  Byers Google Series	
  A 6/7/99 47
8. Michael	
  Moritz Sequoia	
  Capital Google Series	
  A 6/7/99 44
9. Jim	
  Goetz Sequoia	
  Capital WhatsApp Series	
  A 4/8/11 45
10. Brian	
  Pokorny SV	
  Angel Twitter Series	
  A 7/1/07 26
11. Ron	
  Conway SV	
  Angel Twitter Series	
  A 7/1/07 56
12. George	
  Zachary Charles	
  River	
  Ventures Twitter Series	
  A 7/1/07 40
13. Fred	
  Wilson Union	
  Square	
  Ventures Twitter Series	
  A 7/1/07 45
14. Chris	
  Sacca Lowercase	
  Capital Twitter Series	
  A 7/1/07 31
15. Marc	
  Andreessen Andreessen	
  Horowitz Twitter Series	
  A 7/1/07 36
16. Mike	
  Maples	
  Jr. Floodgate Twitter Series	
  A 7/1/07 38
17. Steve	
  Anderson Baseline	
  Ventures Twitter Series	
  A 7/1/07 37
18. Bijan	
  Sabet Spark	
  Capital Twitter Series	
  B 5/1/08 38
19. Joi	
  Ito MIT	
  Media	
  Lab Twitter Series	
  B 5/1/08 41
20. Harry	
  Weller NEA Groupon Series	
  A 1/1/08 37
21. Kevin	
  Efrusy Accel	
  Partners Groupon Series	
  B 12/1/09 36
22. Fred	
  Wilson Union	
  Square	
  Ventures Zynga Series	
  A 1/15/08 46
23. Andy	
  Russell Pilot	
  Group Zynga Series	
  A 1/15/08 36
24. Rich	
  Levandov Avalon	
  Ventures Zynga Series	
  A 1/15/08
25. Brad	
  Feld Foundry	
  Group Zynga Series	
  A 1/15/08 42
26. Peter	
  Thiel Founders	
  Fund Zynga Series	
  A 1/15/08 40
27. Reid	
  Hoffman Greylock	
  Partners Zynga Series	
  A 1/15/08 40
28. Brian	
  Pokorny SV	
  Angel Zynga Series	
  A 1/15/08 27
29. John	
  Doerr Kleiner	
  Perkins	
  Caufield	
  &	
  Byers Zynga Series	
  B 7/18/08 57
30. Sandy	
  Miller Institutional	
  Venture	
  Partners Zynga Series	
  B 7/18/08 58
31. Vinod	
  Khosla Khosla	
  Ventures Cerent Series	
  B 4/1/97 42
32. Dan	
  Ciporin Canaan	
  Partners LendingClub Series	
  A 8/23/07 48
33. Jeff	
  Crowe Norwest	
  Venture	
  Partners LendingClub Series	
  A 8/23/07 49
34. Rebecca	
  Lynn Canvas	
  Venture	
  Fund LendingClub Series	
  B 3/19/09 36
35. Jeff	
  Clavier SoftTech	
  VC FitBit Series	
  A 10/10/08 40
36. Jon	
  Callaghan True	
  Ventures FitBit Series	
  A 10/10/08 39
37. Brad	
  Feld Foundry	
  Group FitBit Series	
  B 9/10/10 44
38. Aydin	
  Senkut Felicis	
  Ventures Fitbit Series	
  B 9/10/10 39
39. Mark	
  Kvamme Sequoia	
  Capital LinkedIn Series	
  A 11/1/03 42
40. Josh	
  Kopelman First	
  Round	
  Capital LinkedIn Series	
  A 11/1/03 32
41. David	
  Sze Greylock	
  Partners LinkedIn Series	
  B 10/1/04 41
42. Dave	
  Flanagan Intel	
  Capital Clearwire Series	
  A 6/1/04 34
43. Seth	
  Neiman Crosspoint Chromatis	
  Networks Series	
  A 10/1/98 44
44. Vinod	
  Khosla Khosla	
  Ventures Siara	
  Systems Series	
  A 11/15/98 43
45. Promod	
  Haque Norwest	
  Venture	
  Partners Siara	
  Systems Series	
  A 11/15/98 50
46. Michael	
  Marks Riverwood	
  Capital GoPro Series	
  A 5/5/11 59
47. Ned	
  Gilhuly Sageview	
  Capital GoPro Series	
  A 5/5/11 50
48. John	
  Ball Steamboat	
  Ventures GoPro Series	
  A 5/5/11 47
49. Chris	
  Rust Cyphort GoPro Series	
  A 5/5/11 45
50. Lip-­‐Bu	
  Tan Walden	
  International GoPro Series	
  A 5/5/11 51
51. Kevin	
  Compton Kleiner	
  Perkins	
  Caufield	
  &	
  Byers ONI	
  Systems Series	
  A 12/1/97 39
52. Jon	
  Feiber Mohr	
  Davidow ONI	
  Systems Series	
  A 12/1/97 40
53. Felda	
  Hardymon Bessemer	
  Venture	
  Partners Sirocco	
  Systems Series	
  A 4/27/99 51
54. Roger	
  Evans Greylock	
  Partners Sirocco	
  Systems Series	
  A 4/27/99 49
55. Barry	
  Eggers Lightspeed	
  Venture	
  Partners Sirocco	
  Systems Series	
  A 4/27/99 35
56. Jim	
  Goetz Sequoia	
  Capital Palo	
  Alto	
  Networks Series	
  A 1/1/06 40
57. Asheem	
  Chandna Greylock	
  Partners Palo	
  Alto	
  Networks Series	
  A 1/1/06 41
58. Harry	
  Weller NEA Vonage Series	
  B 11/24/03 33
59. Thomas	
  Bredt Menlo	
  Ventures XROS Series	
  A 1/15/99 57
60. Randy	
  Komisar Kleiner	
  Perkins	
  Caufield	
  &	
  Byers Nest	
  Labs Series	
  A 9/21/10 54
61. Rob	
  Coneybeer Shasta	
  Ventures Nest	
  Labs Series	
  A 9/21/10 40
62. Bill	
  Maris Google	
  Ventures Nest	
  Labs Series	
  B 8/1/11 35
63. Peter	
  Nieh Lightspeed	
  Venture	
  Partners Nest	
  Labs Series	
  B 8/1/11 45
64. Larry	
  Kubal Labrador	
  Ventures Pandora	
  Media Series	
  A 1/1/00 47
65. Doug	
  Barry Selby	
  Ventures Pandora	
  Media Series	
  A 1/1/00 36
66. Larry	
  Marcus Walden	
  International Pandora	
  Media Series	
  A 1/1/00 48
67. Dave	
  Strohm Greylock	
  Partners DoubleClick Series	
  A 6/10/97 48
68. Deepak	
  Kamra Canaan	
  Partners DoubleClick Series	
  A 6/10/97 40
69. Ray	
  Rothrock Venrock DoubleClick Series	
  A 6/10/97 39
70. Todd	
  Dagres Spark	
  Capital Qtera Series	
  A 8/12/98 37
71. Todd	
  Brooks Mayfield	
  Fund Qtera Series	
  B 4/19/99 38
72. Jason	
  Stoffer Maveron Zulily Series	
  A 12/17/09 32
73. Eric	
  Carlborg August	
  Capital Zulily Series	
  B 8/4/10 45
74. Gus	
  Tai Trinity	
  Ventures Zulily Series	
  B 8/4/10 44
75. Gordon	
  Ritter Emergence	
  Capital Veeva	
  Systems Series	
  B 6/5/08 43
76. Dave	
  Strohm Greylock	
  Partners Cygnus	
  Solutions Series	
  A 2/15/97 48
77. John	
  Johnston August	
  Capital Cygnus	
  Solutions Series	
  A 2/15/97 41
78. Matthew	
  Howard Norwest	
  Venture	
  Partners FireEye Series	
  A 1/1/05 40
79. Gaurav	
  Garg Sequoia	
  Capital FireEye Series	
  A 1/1/05 38
80. Joe	
  Horowitz Icon	
  Ventures FireEye Series	
  B 8/23/06
81. Paul	
  Barber JMI	
  Equity ServiceNow Series	
  A 7/5/05 42
82. Alex	
  Finkelstein Spark	
  Capital Wayfair Series	
  A 6/21/11 34
83. Neeraj	
  Agrawal Battery	
  Ventures Wayfair Series	
  A 6/21/11 38
84. Michael	
  Kumin Great	
  Hill	
  Partners Wayfair Series	
  A 6/21/11 37
85. Ian	
  Lane HarvourVest Wayfair Series	
  A 6/21/11 33
86. Phil	
  Siegel Austin	
  Ventures HomeAway Series	
  A 1/1/05 39
87. Jeff	
  Brody Redpoint	
  Ventures HomeAway Series	
  A 1/1/05 43
88. Todd	
  Chaffee Institutional	
  Venture	
  Partners HomeAway Series	
  B 1/1/06 45
89. John	
  Moragne Trident	
  Capital HomeAway Series	
  B 1/1/06 45
90. Berry	
  Cash InterWest CIENA Series	
  A 4/1/94 52
91. David	
  Cowan Bessemer	
  Venture	
  Partners CIENA Series	
  B 12/1/94 28
92. Scott	
  Tobin Battery	
  Ventures Akamai	
  Technologies Series	
  A 12/14/98 27
93. Todd	
  Chaffee Institutional	
  Venture	
  Partners Akamai	
  Technologies Series	
  A 12/14/98 38
94. Andrew	
  Schwab 5am	
  Ventures Ikaria Series	
  A 9/26/05 33
95. Robert	
  Nelsen ARCH	
  Venture	
  Partners Ikaria Series	
  A 9/26/05 41
96. Bryan	
  Roberts Venrock Ikaria Series	
  A 9/26/05 37
97. Forest	
  Baskett,	
  PhD NEA Tableau	
  Software Series	
  A 1/1/04 60
98. Robert	
  Nelsen ARCH	
  Venture	
  Partners Juno	
  Therapeutics Series	
  A 12/3/13 50
99. Bong	
  Koh Venrock Juno	
  Therapeutics Series	
  A-­‐2 12/3/13 40
100. David	
  Hornik August	
  Capital Splunk Series	
  A 12/1/04 36
101. Thomas	
  Neustaetter JK&B	
  Capital Splunk Series	
  B 1/1/06 53
102. Antonio	
  Rodriguez Matrix	
  Partners Oculus	
  VR Series	
  A 6/17/13 38
103. Santo	
  Politi Spark	
  Capital Oculus	
  VR Series	
  A 6/17/13 46
104. Joe	
  Lonsdale Formation	
  8 Oculus	
  VR Series	
  A 6/17/13 30
105. Brian	
  Singerman Founders	
  Fund Oculus	
  VR Series	
  A 6/17/13 34
106. Chris	
  Dixon Andreessen	
  Horowitz Oculus	
  VR Series	
  B 12/12/13 40
107. Scott	
  Sandell NEA Fusion-­‐io Series	
  A 3/31/08 43
108. Chris	
  Schaepe Lightspeed	
  Venture	
  Partners Fusion-­‐io Series	
  B 4/7/09 43
109. Blake	
  Modersitzki Pelion	
  Venture	
  Partners Fusion-­‐io Series	
  B 4/7/09 39
110. Fred	
  Wilson Union	
  Square	
  Ventures Etsy Series	
  A 11/1/06 45
111. Josh	
  Stein Draper	
  Fisher	
  Jurvetson Box Series	
  A 10/1/06 32
112. Winston	
  Fu US	
  Venture	
  Partners Box Series	
  B 1/23/08 41
113. Steve	
  Jurvetson Draper	
  Fisher	
  Jurvetson TradeX	
  Technologies Series	
  B 3/1/98 30
114. Ping	
  Li Accel	
  Partners Nimble	
  Storage Series	
  A 12/21/07 35
115. Jim	
  Goetz Sequoia	
  Capital Nimble	
  Storage Series	
  A 12/21/07 42
116. Barry	
  Eggers Lightspeed	
  Venture	
  Partners Nimble	
  Storage Series	
  B 12/24/08 45
117. Andrew	
  Marcuvitz Matrix	
  Partners Broadband	
  Access	
  Systems Series	
  A 7/1/98
118. Vinod	
  Khosla Khosla	
  Ventures Juniper	
  Networks Series	
  A 6/11/96 41
119. Seth	
  Neiman Crosspoint Juniper	
  Networks Series	
  B 8/5/96 42
120. Andy	
  Rachleff Benchmark	
  Capital Juniper	
  Networks Series	
  B 8/5/96 37
121. Geoff	
  Yang Redpoint	
  Ventures Juniper	
  Networks Series	
  B 8/5/96 36
122. Peter	
  Barris NEA Juniper	
  Networks Series	
  B 8/5/96 43
123. Michael	
  Moritz Sequoia	
  Capital Green	
  Dot	
  Corp. Series	
  A 1/1/03 48
124. Douglas	
  Leone Sequoia	
  Capital Rackspace	
  Hosting Series	
  B 3/27/00 41
125. George	
  Still Norwest	
  Venture	
  Partners Rackspace	
  Hosting Series	
  B 3/27/00 41
126. Bryan	
  Roberts Venrock Castlight	
  Health Series	
  A 8/1/09 41
127. Roelof	
  Botha Sequoia	
  Capital Youtube Series	
  A 11/1/05 33
128. Jim	
  Swartz Accel	
  Partners Avici	
  Systems Series	
  A 5/1/97
129. Matt	
  Gorin Contour	
  Venture	
  Partners OnDeck	
  Capital Series	
  A 1/1/06
130. Matt	
  Harris Bain	
  Capital	
  Ventures OnDeck	
  Capital Series	
  A 1/1/06 33
131. David	
  Weiden Khosla	
  Ventures OnDeck	
  Capital Series	
  B 1/1/07 34
132. James	
  Robinson	
  III RRE	
  Ventures OnDeck	
  Capital Series	
  B 1/1/07 71

More Related Content

Similar to Vc diversity-methodology-write-up-v final

Financial_Management_Class_Notes (1).pdf
Financial_Management_Class_Notes (1).pdfFinancial_Management_Class_Notes (1).pdf
Financial_Management_Class_Notes (1).pdf
SIMBARASHEMABHEKA
 
Financial_Management_Class_Notes.pdf
Financial_Management_Class_Notes.pdfFinancial_Management_Class_Notes.pdf
Financial_Management_Class_Notes.pdf
SIMBARASHEMABHEKA
 
Corporate Venture Capital Group Investment Analysis 1995 to Q2 2008
Corporate Venture Capital Group Investment Analysis 1995 to Q2 2008Corporate Venture Capital Group Investment Analysis 1995 to Q2 2008
Corporate Venture Capital Group Investment Analysis 1995 to Q2 2008
mensa25
 

Similar to Vc diversity-methodology-write-up-v final (20)

Trading model data
Trading model dataTrading model data
Trading model data
 
Scott-Macon Aerospace, Defense and Government Services (May 2017)
Scott-Macon Aerospace, Defense and Government Services (May 2017)Scott-Macon Aerospace, Defense and Government Services (May 2017)
Scott-Macon Aerospace, Defense and Government Services (May 2017)
 
Scott-Macon Aerospace, Defense and Government Services (June 2017)
Scott-Macon Aerospace, Defense and Government Services (June 2017)Scott-Macon Aerospace, Defense and Government Services (June 2017)
Scott-Macon Aerospace, Defense and Government Services (June 2017)
 
Aerospace, Defense and Government Industry Update
Aerospace, Defense and Government Industry UpdateAerospace, Defense and Government Industry Update
Aerospace, Defense and Government Industry Update
 
Scott-Macon Aerospace, Defense and Government Industry Update
Scott-Macon Aerospace, Defense and Government Industry UpdateScott-Macon Aerospace, Defense and Government Industry Update
Scott-Macon Aerospace, Defense and Government Industry Update
 
Amartechnology Global - Executive Summary
Amartechnology Global - Executive SummaryAmartechnology Global - Executive Summary
Amartechnology Global - Executive Summary
 
Aerospace, Defense and Government Services Monthly Market Overview
Aerospace, Defense and Government Services Monthly Market OverviewAerospace, Defense and Government Services Monthly Market Overview
Aerospace, Defense and Government Services Monthly Market Overview
 
Scott-Macon Aerospace, Defense and Government Services (April 2017)
Scott-Macon Aerospace, Defense and Government Services (April 2017)Scott-Macon Aerospace, Defense and Government Services (April 2017)
Scott-Macon Aerospace, Defense and Government Services (April 2017)
 
Financial_Management_Class_Notes (1).pdf
Financial_Management_Class_Notes (1).pdfFinancial_Management_Class_Notes (1).pdf
Financial_Management_Class_Notes (1).pdf
 
Financial_Management_Class_Notes.pdf
Financial_Management_Class_Notes.pdfFinancial_Management_Class_Notes.pdf
Financial_Management_Class_Notes.pdf
 
Market Risk And Return PowerPoint Presentation Slides
Market Risk And Return PowerPoint Presentation Slides Market Risk And Return PowerPoint Presentation Slides
Market Risk And Return PowerPoint Presentation Slides
 
SaaS - 2014 Market Review
SaaS - 2014 Market ReviewSaaS - 2014 Market Review
SaaS - 2014 Market Review
 
Scott-Macon Aerospace & Defense (December 2019)
Scott-Macon Aerospace & Defense (December 2019)Scott-Macon Aerospace & Defense (December 2019)
Scott-Macon Aerospace & Defense (December 2019)
 
Global Weekly
Global WeeklyGlobal Weekly
Global Weekly
 
Tulip a eur_en
Tulip a eur_enTulip a eur_en
Tulip a eur_en
 
Aerospace & Defense Monthly Update (October 2018)
Aerospace & Defense Monthly Update (October 2018)Aerospace & Defense Monthly Update (October 2018)
Aerospace & Defense Monthly Update (October 2018)
 
Mid cap & small cap performance
Mid cap & small cap performanceMid cap & small cap performance
Mid cap & small cap performance
 
Scott-Macon Aerospace, Defense and Government Services (March 2017)
Scott-Macon Aerospace, Defense and Government Services (March 2017)Scott-Macon Aerospace, Defense and Government Services (March 2017)
Scott-Macon Aerospace, Defense and Government Services (March 2017)
 
Apac Countries in the Global Knowledge Economy
Apac Countries in the Global Knowledge EconomyApac Countries in the Global Knowledge Economy
Apac Countries in the Global Knowledge Economy
 
Corporate Venture Capital Group Investment Analysis 1995 to Q2 2008
Corporate Venture Capital Group Investment Analysis 1995 to Q2 2008Corporate Venture Capital Group Investment Analysis 1995 to Q2 2008
Corporate Venture Capital Group Investment Analysis 1995 to Q2 2008
 

Recently uploaded

一比一原版(WashU毕业证书)圣路易斯华盛顿大学毕业证成绩单学位证书
一比一原版(WashU毕业证书)圣路易斯华盛顿大学毕业证成绩单学位证书一比一原版(WashU毕业证书)圣路易斯华盛顿大学毕业证成绩单学位证书
一比一原版(WashU毕业证书)圣路易斯华盛顿大学毕业证成绩单学位证书
atedyxc
 
Financial Accounting and Analysis balancesheet.pdf
Financial Accounting and Analysis balancesheet.pdfFinancial Accounting and Analysis balancesheet.pdf
Financial Accounting and Analysis balancesheet.pdf
mukul381940
 
一比一原版(Cornell毕业证书)康奈尔大学毕业证成绩单学位证书
一比一原版(Cornell毕业证书)康奈尔大学毕业证成绩单学位证书一比一原版(Cornell毕业证书)康奈尔大学毕业证成绩单学位证书
一比一原版(Cornell毕业证书)康奈尔大学毕业证成绩单学位证书
atedyxc
 
一比一原版(Caltech毕业证书)加利福尼亚理工学院毕业证成绩单学位证书
一比一原版(Caltech毕业证书)加利福尼亚理工学院毕业证成绩单学位证书一比一原版(Caltech毕业证书)加利福尼亚理工学院毕业证成绩单学位证书
一比一原版(Caltech毕业证书)加利福尼亚理工学院毕业证成绩单学位证书
atedyxc
 
Bahawalpur Culture.pptx pptx pptx pttx pttx
Bahawalpur Culture.pptx pptx pptx pttx pttxBahawalpur Culture.pptx pptx pptx pttx pttx
Bahawalpur Culture.pptx pptx pptx pttx pttx
AbdulNasirNichari
 
原版一模一样(bu文凭证书)美国贝翰文大学毕业证文凭证书制作
原版一模一样(bu文凭证书)美国贝翰文大学毕业证文凭证书制作原版一模一样(bu文凭证书)美国贝翰文大学毕业证文凭证书制作
原版一模一样(bu文凭证书)美国贝翰文大学毕业证文凭证书制作
uotyyd
 
Prezentacja Q1 2024 EN strona www relacji
Prezentacja Q1 2024  EN strona www relacjiPrezentacja Q1 2024  EN strona www relacji
Prezentacja Q1 2024 EN strona www relacji
klaudiafilka
 
一比一原版(UCSB毕业证书)圣塔芭芭拉社区大学毕业证成绩单学位证书
一比一原版(UCSB毕业证书)圣塔芭芭拉社区大学毕业证成绩单学位证书一比一原版(UCSB毕业证书)圣塔芭芭拉社区大学毕业证成绩单学位证书
一比一原版(UCSB毕业证书)圣塔芭芭拉社区大学毕业证成绩单学位证书
atedyxc
 
一比一原版(UCSD毕业证书)加利福尼亚大学圣迭戈分校毕业证成绩单学位证书
一比一原版(UCSD毕业证书)加利福尼亚大学圣迭戈分校毕业证成绩单学位证书一比一原版(UCSD毕业证书)加利福尼亚大学圣迭戈分校毕业证成绩单学位证书
一比一原版(UCSD毕业证书)加利福尼亚大学圣迭戈分校毕业证成绩单学位证书
atedyxc
 
TriStar Gold- 05-13-2024 corporate presentation
TriStar Gold- 05-13-2024 corporate presentationTriStar Gold- 05-13-2024 corporate presentation
TriStar Gold- 05-13-2024 corporate presentation
Adnet Communications
 

Recently uploaded (20)

一比一原版(WashU毕业证书)圣路易斯华盛顿大学毕业证成绩单学位证书
一比一原版(WashU毕业证书)圣路易斯华盛顿大学毕业证成绩单学位证书一比一原版(WashU毕业证书)圣路易斯华盛顿大学毕业证成绩单学位证书
一比一原版(WashU毕业证书)圣路易斯华盛顿大学毕业证成绩单学位证书
 
NO1 Top Vashikaran Specialist in Uk Black Magic Specialist in Uk Black Magic ...
NO1 Top Vashikaran Specialist in Uk Black Magic Specialist in Uk Black Magic ...NO1 Top Vashikaran Specialist in Uk Black Magic Specialist in Uk Black Magic ...
NO1 Top Vashikaran Specialist in Uk Black Magic Specialist in Uk Black Magic ...
 
Financial Accounting and Analysis balancesheet.pdf
Financial Accounting and Analysis balancesheet.pdfFinancial Accounting and Analysis balancesheet.pdf
Financial Accounting and Analysis balancesheet.pdf
 
一比一原版(Cornell毕业证书)康奈尔大学毕业证成绩单学位证书
一比一原版(Cornell毕业证书)康奈尔大学毕业证成绩单学位证书一比一原版(Cornell毕业证书)康奈尔大学毕业证成绩单学位证书
一比一原版(Cornell毕业证书)康奈尔大学毕业证成绩单学位证书
 
How to exchange my pi coins on HTX in 2024
How to exchange my pi coins on HTX in 2024How to exchange my pi coins on HTX in 2024
How to exchange my pi coins on HTX in 2024
 
一比一原版(Caltech毕业证书)加利福尼亚理工学院毕业证成绩单学位证书
一比一原版(Caltech毕业证书)加利福尼亚理工学院毕业证成绩单学位证书一比一原版(Caltech毕业证书)加利福尼亚理工学院毕业证成绩单学位证书
一比一原版(Caltech毕业证书)加利福尼亚理工学院毕业证成绩单学位证书
 
Bahawalpur Culture.pptx pptx pptx pttx pttx
Bahawalpur Culture.pptx pptx pptx pttx pttxBahawalpur Culture.pptx pptx pptx pttx pttx
Bahawalpur Culture.pptx pptx pptx pttx pttx
 
原版一模一样(bu文凭证书)美国贝翰文大学毕业证文凭证书制作
原版一模一样(bu文凭证书)美国贝翰文大学毕业证文凭证书制作原版一模一样(bu文凭证书)美国贝翰文大学毕业证文凭证书制作
原版一模一样(bu文凭证书)美国贝翰文大学毕业证文凭证书制作
 
Managing personal finances wisely for financial stability and
Managing personal finances wisely for financial stability  andManaging personal finances wisely for financial stability  and
Managing personal finances wisely for financial stability and
 
project ratio analysis of bcom studies .
project ratio analysis of bcom studies .project ratio analysis of bcom studies .
project ratio analysis of bcom studies .
 
ACC311_Corporate Income Taxation in the Philippines
ACC311_Corporate Income Taxation  in the PhilippinesACC311_Corporate Income Taxation  in the Philippines
ACC311_Corporate Income Taxation in the Philippines
 
Economic Risk Factor Update: May 2024 [SlideShare]
Economic Risk Factor Update: May 2024 [SlideShare]Economic Risk Factor Update: May 2024 [SlideShare]
Economic Risk Factor Update: May 2024 [SlideShare]
 
Diversification in Investment Portfolio.pdf
Diversification in Investment Portfolio.pdfDiversification in Investment Portfolio.pdf
Diversification in Investment Portfolio.pdf
 
STRATEGIC MANAGEMENT VIETTEL TELECOM GROUP
STRATEGIC MANAGEMENT VIETTEL TELECOM GROUPSTRATEGIC MANAGEMENT VIETTEL TELECOM GROUP
STRATEGIC MANAGEMENT VIETTEL TELECOM GROUP
 
L1 2024 Prequisite QM persion milad1371.pdf
L1 2024 Prequisite QM persion milad1371.pdfL1 2024 Prequisite QM persion milad1371.pdf
L1 2024 Prequisite QM persion milad1371.pdf
 
Prezentacja Q1 2024 EN strona www relacji
Prezentacja Q1 2024  EN strona www relacjiPrezentacja Q1 2024  EN strona www relacji
Prezentacja Q1 2024 EN strona www relacji
 
一比一原版(UCSB毕业证书)圣塔芭芭拉社区大学毕业证成绩单学位证书
一比一原版(UCSB毕业证书)圣塔芭芭拉社区大学毕业证成绩单学位证书一比一原版(UCSB毕业证书)圣塔芭芭拉社区大学毕业证成绩单学位证书
一比一原版(UCSB毕业证书)圣塔芭芭拉社区大学毕业证成绩单学位证书
 
一比一原版(UCSD毕业证书)加利福尼亚大学圣迭戈分校毕业证成绩单学位证书
一比一原版(UCSD毕业证书)加利福尼亚大学圣迭戈分校毕业证成绩单学位证书一比一原版(UCSD毕业证书)加利福尼亚大学圣迭戈分校毕业证成绩单学位证书
一比一原版(UCSD毕业证书)加利福尼亚大学圣迭戈分校毕业证成绩单学位证书
 
How can I withdraw my pi coins to real money in India.
How can I withdraw my pi coins to real money in India.How can I withdraw my pi coins to real money in India.
How can I withdraw my pi coins to real money in India.
 
TriStar Gold- 05-13-2024 corporate presentation
TriStar Gold- 05-13-2024 corporate presentationTriStar Gold- 05-13-2024 corporate presentation
TriStar Gold- 05-13-2024 corporate presentation
 

Vc diversity-methodology-write-up-v final

  • 1.     1 VC Diversity October 2015 Methodology Write-up The composite score for firms is shown here. The remainder of this document explains the methodology behind the ranking. Ranking List, Grouped by $ AUM AUM$$$Mil. Gender$Score Ethnic$Score Age$Score (per$Venture Gender$Divrs. Gender$Score Ethnic$Divrs. Ethnic$Score Age Avg. Composite Firm Headcount Source) Male Female %$Women Prob.$(Pg) (1GPg)*10 White Asian Black Hispanic Other Prob.$(Pr) (1GPr)*10 Avg. Score Score Greater$Than$$1$Billion$AUM – 1. Social*Capital 8 $*1,155 4 4 50.0% 43% 5.7 4 4 – – – 43% 5.7 38.5 8.8 6.74 – 2. Battery*Ventures 10 4,500 9 1 10.0% 80% 2.0 8 2 – – – 64% 3.6 42.1 9.8 5.10 – 3. GGV*Capital 4 2,705 4 – – 100% 0.0 3 1 – – – 50% 5.0 44.8 10.0 5.00 – 4. Trinity*Ventures 9 1,500 7 2 22.2% 61% 3.9 4 5 – – – 44% 5.6 51.3 5.5 4.99 – 5. Kleiner*Perkins*Caufield*&*Byers 10 4,600 7 3 30.0% 53% 4.7 7 3 – – – 53% 4.7 47.7 5.5 4.95 – 6. Greylock*Partners 11 3,016 10 1 9.1% 82% 1.8 7 4 – – – 49% 5.1 45.4 7.9 4.93 – 7. Accel*Partners 8 7,790 8 – – 100% 0.0 5 3 – – – 46% 5.4 39.5 8.8 4.71 – 8. Khosla*Ventures 8 2,263 8 – – 100% 0.0 3 5 – – – 46% 5.4 44.7 8.7 4.68 – 9. Google*Ventures 12 2,000 11 1 8.3% 83% 1.7 10 1 1 – – 68% 3.2 38.0 8.9 4.58 – 10.Bain*Capital*Ventures 11 3,000 11 – – 100% 0.0 6 4 – 1 – 38% 6.2 45.0 7.4 4.53 – 11.Lightspeed*Venture*Partners 13 3,135 13 – – 100% 0.0 6 7 – – – 46% 5.4 42.9 8.1 4.51 – 12.Charles*River*Ventures 9 1,500 8 1 11.1% 78% 2.2 7 1 – 1 – 58% 4.2 41.2 6.8 4.38 – 13.Scale*Venture*Partners 7 1,200 4 3 42.9% 43% 5.7 7 – – – – 100% 0.0 46.9 7.3 4.32 – 14.Softbank*Capital 10 2,596 8 2 20.0% 64% 3.6 8 2 – – – 64% 3.6 46.6 5.6 4.25 – 15.Venrock 9 2,450 8 1 11.1% 78% 2.2 8 1 – – – 78% 2.2 46.8 8.2 4.21 – 16.Canaan*Partners 12 3,500 9 3 25.0% 59% 4.1 10 2 – – – 70% 3.0 49.1 5.5 4.19 – 17.Norwest*Venture*Partners 13 5,000 12 1 7.7% 85% 1.5 9 3 – 1 – 50% 5.0 50.8 5.9 4.16 – 18.Draper*Fisher*Jurvetson 11 5,760 9 2 18.2% 67% 3.3 9 2 – – – 67% 3.3 49.7 5.6 4.04 – 19.Shasta*Ventures 6 1,025 6 – – 100% 0.0 4 2 – – – 47% 5.3 48.2 6.8 4.03 – 20.Foundation*Capital 9 2,782 9 – – 100% 0.0 6 3 – – – 50% 5.0 48.6 6.7 3.90 – 21.DCM*Ventures 4 2,800 4 – – 100% 0.0 3 1 – – – 50% 5.0 49.3 6.3 3.77 – 22.Benchmark 6 3,302 6 – – 100% 0.0 5 1 – – – 67% 3.3 44.5 7.9 3.76 – 23.NEA 30 16,442 28 2 6.7% 87% 1.3 24 6 – – – 67% 3.3 48.4 6.3 3.64 – 24.Institutional*Venture*Partners 8 5,400 8 – – 100% 0.0 6 2 – – – 57% 4.3 47.3 6.6 3.62 – 25.General*Catalyst*Partners 11 3,000 11 – – 100% 0.0 8 3 – – – 56% 4.4 45.6 6.5 3.62 – 26.Crosslink*Capital 6 1,600 6 – – 100% 0.0 4 2 – – – 47% 5.3 51.8 5.5 3.60 – 27.Spark*Capital 9 1,825 9 – – 100% 0.0 8 1 – – – 78% 2.2 42.4 8.5 3.58 – 28.Menlo*Ventures 11 2,000 10 1 9.1% 82% 1.8 9 2 – – – 67% 3.3 51.1 5.5 3.53 – 29.Tiger*Global*Management 3 10,000 3 – – 100% 0.0 3 – – – – 100% 0.0 37.7 10.0 3.33 – 30.Sequoia*Capital 14 4,470 14 – – 100% 0.0 12 2 – – – 74% 2.6 46.0 6.8 3.16 – 31.Founders*Fund 6 2,160 6 – – 100% 0.0 6 – – – – 100% 0.0 38.2 9.4 3.13 – 32.Mayfield*Fund 5 3,000 5 – – 100% 0.0 – 5 – – – 100% 0.0 43.4 9.3 3.10 – 33.FirstMark*Capital 14 2,200 14 – – 100% 0.0 13 1 – – – 86% 1.4 45.7 7.8 3.09 – 34.Redpoint*Ventures 13 3,800 13 – – 100% 0.0 11 2 – – – 72% 2.8 46.3 6.3 3.05 – 35.Index*Ventures 3 3,733 3 – – 100% 0.0 3 – – – – 100% 0.0 42.0 8.9 2.98 – 36.Foundry*Group 4 1,128 4 – – 100% 0.0 4 – – – – 100% 0.0 46.0 8.5 2.84 – 37. Andreessen*Horowitz 16 4,289 15 1 6.3% 88% 1.3 15 1 – – – 88% 1.3 50.0 6.1 2.85 – 38.US*Venture*Partners 6 1,225 5 1 16.7% 67% 3.3 6 – – – – 100% 0.0 50.3 4.9 2.74 – 39.Matrix*Partners 9 5,050 9 – – 100% 0.0 8 – – 1 – 78% 2.2 49.2 6.0 2.73 – 40.August*Capital 7 1,300 7 – – 100% 0.0 6 1 – – – 71% 2.9 51.0 4.9 2.59 – 41.Tenaya*Capital 5 1,487 5 – – 100% 0.0 5 – – – – 100% 0.0 47.0 7.3 2.43 – 42.Bessemer*Venture*Partners 13 5,600 13 – – 100% 0.0 13 – – – – 100% 0.0 45.0 7.0 2.33 – 43.Meritech*Capital*Partners 6 2,064 6 – – 100% 0.0 6 – – – – 100% 0.0 45.8 6.3 2.09 – 44.Atlas*Life*Sciences 5 2,545 5 – – 100% 0.0 5 – – – – 100% 0.0 51.0 6.1 2.02 – 45.Madrona*Venture*Group 6 1,300 6 – – 100% 0.0 6 – – – – 100% 0.0 53.8 5.4 1.79 – 46.Bluerun*Ventures 2 1,065 2 – – 100% 0.0 2 – – – – 100% 0.0 53.0 3.9 1.29 $250$Million$to$$1$Billion – 1. Y*Combinator 11 1,000 10 1 9.1% 82% 1.8 6 4 1 – – 38% 6.2 36.4 8.1 5.35 – 2. Formation*8 10 948 9 1 10.0% 80% 2.0 6 4 – – – 47% 5.3 34.6 7.2 4.84 – 3. Upfront*Ventures 6 658 5 1 16.7% 67% 3.3 5 – 1 – – 67% 3.3 47.3 7.3 4.65 – 4. True*Ventures 7 890 7 – – 100% 0.0 4 3 – – – 43% 5.7 47.0 7.9 4.54 – 5. Iconiq*Capital 5 528 5 – – 100% 0.0 4 1 – – – 60% 4.0 40.8 9.4 4.46 – 6. Thrive*Capital 6 597 6 – – 100% 0.0 3 3 – – – 40% 6.0 32.5 7.3 4.44 – 7. Emergence*Capital 7 575 6 1 14.3% 71% 2.9 6 – – 1 – 71% 2.9 47.6 6.6 4.12 – 8. Storm*Ventures 6 825 6 – – 100% 0.0 2 3 – 1 – 27% 7.3 53.2 4.8 4.05 – 9. Greycroft*Partners 9 593 8 1 11.1% 78% 2.2 9 – – – – 100% 0.0 47.6 7.8 3.35 – 10.RRE*Ventures 6 810 6 – – 100% 0.0 5 1 – – – 67% 3.3 54.2 5.6 2.97 – 11.First*Round*Capital 7 748 7 – – 100% 0.0 7 – – – – 100% 0.0 47.4 7.2 2.38 – 12.Pelion*Venture*Partners 5 610 5 – – 100% 0.0 5 – – – – 100% 0.0 47.6 7.1 2.38 – 13.Sutter*Hill*Ventures 7 700 7 – – 100% 0.0 7 – – – – 100% 0.0 49.3 6.2 2.06 – 14.Union*Square*Ventures 5 883 5 – – 100% 0.0 5 – – – – 100% 0.0 52.8 4.6 1.53 $250$Million$and$Less – 1. Floodgate 2 224 1 1 50.0% – 10.0 1 1 – – – – 10.0 42.5 9.3 9.78 – 2. Cowboy*Ventures 2 97 1 1 50.0% – 10.0 1 1 – – – – 10.0 39.0 9.2 9.74 – 3. Felicis*Ventures 4 245 3 1 25.0% 50% 5.0 2 2 – – – 33% 6.7 38.8 10.0 7.22 – 4. Aspect*Ventures 2 150 – 2 100.0% 100% 0.0 1 1 – – – – 10.0 48.0 7.6 5.87 – 5. SoftTech*VC 3 155 3 – – 100% 0.0 2 – 1 – – 33% 6.7 40.3 9.6 5.41 – 6. Ribbit*Capital 3 224 3 – – 100% 0.0 2 – – 1 – 33% 6.7 39.7 9.2 5.30 – 7. Canvas*Venture*Fund 5 175 4 1 20.0% 60% 4.0 4 1 – – – 60% 4.0 51.6 5.7 4.58 – 8. Lowercase*Capital 2 30 2 – – 100% 0.0 2 – – – – 100% 0.0 36.0 8.8 2.95 – 9. Accomplice*VC 7 200 7 – – 100% 0.0 7 – – – – 100% 0.0 45.4 6.9 2.29 – 10.SV*Angel 5 100 5 – – 100% 0.0 5 – – – – 100% 0.0 37.8 5.7 1.91 – 11.Blumberg*Capital 2 240 2 – – 100% 0.0 2 – – – – 100% 0.0 52.0 4.8 1.61 Total 546 $$166,467 505 41 7.5% 86% 1.4 425 110 4 7 – 65% 3.5 45.9 7.0 3.98  
  • 2.     2 Ranking List, Grouped by Headcount of Senior Investment Team Members AUM$$$Mil. Gender$Score Ethnic$Score Age$Score (per$Venture Gender$Divrs. Gender$Score Ethnic$Divrs. Ethnic$Score Age Avg. Composite Firm Headcount Source) Male Female %$Women Prob.$(Pg) (1GPg)*10 White Asian Black Hispanic Other Prob.$(Pr) (1GPr)*10 Avg. Score Score Greater$than$10$People – 1. Y%Combinator 11 $%1,000 10 1 9.1% 82% 1.8 6 4 1 – – 38% 6.2 36.4 8.1 5.35 – 2. Greylock%Partners 11 3,016 10 1 9.1% 82% 1.8 7 4 – – – 49% 5.1 45.4 7.9 4.93 – 3. Google%Ventures 12 2,000 11 1 8.3% 83% 1.7 10 1 1 – – 68% 3.2 38.0 8.9 4.58 – 4. Bain%Capital%Ventures 11 3,000 11 – – 100% 0.0 6 4 – 1 – 38% 6.2 45.0 7.4 4.53 – 5. Lightspeed%Venture%Partners 13 3,135 13 – – 100% 0.0 6 7 – – – 46% 5.4 42.9 8.1 4.51 – 6. Canaan%Partners 12 3,500 9 3 25.0% 59% 4.1 10 2 – – – 70% 3.0 49.1 5.5 4.19 – 7. Norwest%Venture%Partners 13 5,000 12 1 7.7% 85% 1.5 9 3 – 1 – 50% 5.0 50.8 5.9 4.16 – 8. Draper%Fisher%Jurvetson 11 5,760 9 2 18.2% 67% 3.3 9 2 – – – 67% 3.3 49.7 5.6 4.04 – 9. NEA 30 16,442 28 2 6.7% 87% 1.3 24 6 – – – 67% 3.3 48.4 6.3 3.64 – 10.General%Catalyst%Partners 11 3,000 11 – – 100% 0.0 8 3 – – – 56% 4.4 45.6 6.5 3.62 – 11.Menlo%Ventures 11 2,000 10 1 9.1% 82% 1.8 9 2 – – – 67% 3.3 51.1 5.5 3.53 – 12.Sequoia%Capital 14 4,470 14 – – 100% 0.0 12 2 – – – 74% 2.6 46.0 6.8 3.16 – 13.FirstMark%Capital 14 2,200 14 – – 100% 0.0 13 1 – – – 86% 1.4 45.7 7.8 3.09 – 14.Redpoint%Ventures 13 3,800 13 – – 100% 0.0 11 2 – – – 72% 2.8 46.3 6.3 3.05 – 15.Andreessen%Horowitz 16 4,289 15 1 6.3% 88% 1.3 15 1 – – – 88% 1.3 50.0 6.1 2.85 – 16.Bessemer%Venture%Partners 13 5,600 13 – – 100% 0.0 13 – – – – 100% 0.0 45.0 7.0 2.33 6$to$10$People – 1. Social%Capital 8 1,155 4 4 50.0% 43% 5.7 4 4 – – – 43% 5.7 38.5 8.8 6.74 – 2. Battery%Ventures 10 4,500 9 1 10.0% 80% 2.0 8 2 – – – 64% 3.6 42.1 9.8 5.10 – 3. Trinity%Ventures 9 1,500 7 2 22.2% 61% 3.9 4 5 – – – 44% 5.6 51.3 5.5 4.99 – 4. Kleiner%Perkins%Caufield%&%Byers 10 4,600 7 3 30.0% 53% 4.7 7 3 – – – 53% 4.7 47.7 5.5 4.95 – 5. Formation%8 10 948 9 1 10.0% 80% 2.0 6 4 – – – 47% 5.3 34.6 7.2 4.84 – 6. Accel%Partners 8 7,790 8 – – 100% 0.0 5 3 – – – 46% 5.4 39.5 8.8 4.71 – 7. Khosla%Ventures 8 2,263 8 – – 100% 0.0 3 5 – – – 46% 5.4 44.7 8.7 4.68 – 8. Upfront%Ventures 6 658 5 1 16.7% 67% 3.3 5 – 1 – – 67% 3.3 47.3 7.3 4.65 – 9. True%Ventures 7 890 7 – – 100% 0.0 4 3 – – – 43% 5.7 47.0 7.9 4.54 – 10.Scale%Venture%Partners 7 1,200 4 3 42.9% 43% 5.7 7 – – – – 100% 0.0 46.7 7.7 4.48 – 11.Thrive%Capital 6 597 6 – – 100% 0.0 3 3 – – – 40% 6.0 32.5 7.3 4.44 – 12.Charles%River%Ventures 9 1,500 8 1 11.1% 78% 2.2 7 1 – 1 – 58% 4.2 41.2 6.8 4.38 – 13.Softbank%Capital 10 2,596 8 2 20.0% 64% 3.6 8 2 – – – 64% 3.6 46.6 5.6 4.25 – 14.Emergence%Capital 7 575 6 1 14.3% 71% 2.9 6 – – 1 – 71% 2.9 47.6 6.6 4.12 – 15.Storm%Ventures 6 825 6 – – 100% 0.0 2 3 – 1 – 27% 7.3 53.2 4.8 4.05 – 16.Shasta%Ventures 6 1,025 6 – – 100% 0.0 4 2 – – – 47% 5.3 48.2 6.8 4.03 – 17.Venrock 9 2,450 8 1 11.1% 78% 2.2 8 1 – – – 78% 2.2 47.9 7.5 3.99 – 18.Foundation%Capital 9 2,782 9 – – 100% 0.0 6 3 – – – 50% 5.0 48.6 6.7 3.90 – 19.Benchmark 6 3,302 6 – – 100% 0.0 5 1 – – – 67% 3.3 44.5 7.9 3.76 – 20.Institutional%Venture%Partners 8 5,400 8 – – 100% 0.0 6 2 – – – 57% 4.3 47.3 6.6 3.62 – 21.Crosslink%Capital 6 1,600 6 – – 100% 0.0 4 2 – – – 47% 5.3 51.8 5.5 3.60 – 22.Spark%Capital 9 1,825 9 – – 100% 0.0 8 1 – – – 78% 2.2 42.4 8.5 3.58 – 23.Greycroft%Partners 9 593 8 1 11.1% 78% 2.2 9 – – – – 100% 0.0 47.6 7.8 3.35 – 24.Founders%Fund 6 2,160 6 – – 100% 0.0 6 – – – – 100% 0.0 38.2 9.4 3.13 – 25.RRE%Ventures 6 810 6 – – 100% 0.0 5 1 – – – 67% 3.3 54.2 5.6 2.97 – 26.US%Venture%Partners 6 1,225 5 1 16.7% 67% 3.3 6 – – – – 100% 0.0 50.3 4.9 2.74 – 27.Matrix%Partners 9 5,050 9 – – 100% 0.0 8 – – 1 – 78% 2.2 49.2 6.0 2.73 – 28.August%Capital 7 1,300 7 – – 100% 0.0 6 1 – – – 71% 2.9 51.0 4.9 2.59 – 29.First%Round%Capital 7 748 7 – – 100% 0.0 7 – – – – 100% 0.0 47.4 7.2 2.38 – 30.Accomplice%VC 7 200 7 – – 100% 0.0 7 – – – – 100% 0.0 45.4 6.9 2.29 – 31. Meritech%Capital%Partners 6 2,064 6 – – 100% 0.0 6 – – – – 100% 0.0 45.8 6.3 2.09 – 32.Sutter%Hill%Ventures 7 700 7 – – 100% 0.0 7 – – – – 100% 0.0 49.3 6.2 2.06 – 33.Madrona%Venture%Group 6 1,300 6 – – 100% 0.0 6 – – – – 100% 0.0 53.8 5.4 1.79 5$or$Less$People – 1. Floodgate 2 224 1 1 50.0% – 10.0 1 1 – – – – 10.0 42.5 9.3 9.78 – 2. Cowboy%Ventures 2 97 1 1 50.0% – 10.0 1 1 – – – – 10.0 39.0 9.2 9.74 – 3. Felicis%Ventures 4 245 3 1 25.0% 50% 5.0 2 2 – – – 33% 6.7 38.8 10.0 7.22 – 4. Aspect%Ventures 2 150 – 2 100.0% 100% 0.0 1 1 – – – – 10.0 48.0 7.6 5.87 – 5. SoftTech%VC 3 155 3 – – 100% 0.0 2 – 1 – – 33% 6.7 40.3 9.6 5.41 – 6. Ribbit%Capital 3 224 3 – – 100% 0.0 2 – – 1 – 33% 6.7 39.7 9.2 5.30 – 7. GGV%Capital 4 2,705 4 – – 100% 0.0 3 1 – – – 50% 5.0 44.8 10.0 5.00 – 8. Canvas%Venture%Fund 5 175 4 1 20.0% 60% 4.0 4 1 – – – 60% 4.0 51.6 5.7 4.58 – 9. Iconiq%Capital 5 528 5 – – 100% 0.0 4 1 – – – 60% 4.0 40.8 9.4 4.46 – 10.DCM%Ventures 4 2,800 4 – – 100% 0.0 3 1 – – – 50% 5.0 49.3 6.3 3.77 – 11.Tiger%Global%Management 3 10,000 3 – – 100% 0.0 3 – – – – 100% 0.0 37.7 10.0 3.33 – 12.Mayfield%Fund 5 3,000 5 – – 100% 0.0 – 5 – – – 100% 0.0 43.4 9.3 3.10 – 13.Index%Ventures 3 3,733 3 – – 100% 0.0 3 – – – – 100% 0.0 42.0 8.9 2.98 – 14.Lowercase%Capital 2 30 2 – – 100% 0.0 2 – – – – 100% 0.0 36.0 8.8 2.95 – 15.Foundry%Group 4 1,128 4 – – 100% 0.0 4 – – – – 100% 0.0 46.0 8.5 2.84 – 16.Tenaya%Capital 5 1,487 5 – – 100% 0.0 5 – – – – 100% 0.0 47.0 7.3 2.43 – 17.Pelion%Venture%Partners 5 610 5 – – 100% 0.0 5 – – – – 100% 0.0 47.6 7.1 2.38 – 18.Atlas%Life%Sciences 5 2,545 5 – – 100% 0.0 5 – – – – 100% 0.0 51.0 6.1 2.02 – 19.SV%Angel 5 100 5 – – 100% 0.0 5 – – – – 100% 0.0 37.8 5.7 1.91 – 20.Blumberg%Capital 2 240 2 – – 100% 0.0 2 – – – – 100% 0.0 52.0 4.8 1.61 – 21.Union%Square%Ventures 5 883 5 – – 100% 0.0 5 – – – – 100% 0.0 52.8 4.6 1.53 – 22.Bluerun%Ventures 2 1,065 2 – – 100% 0.0 2 – – – – 100% 0.0 53.0 3.9 1.29 Total 546 $$166,467 505 41 7.5% 86% 1.4 425 110 4 7 – 65% 3.5 45.9 7.0 3.98  
  • 3.     3 Ranking List Overall of Senior Investment Team Members AUM$$$Mil. Gender$Score Ethnic$Score Age$Score (per$Venture Gender$Divrs. Gender$Score Ethnic$Divrs. Ethnic$Score Age Avg. Composite Firm Headcount Source) Male Female %$Women Prob.$(Pg) (1GPg)*10 White Asian Black Hispanic Other Prob.$(Pr) (1GPr)*10 Avg. Score Score Overall$Scores – 1. Floodgate 2 $.224 1 1 50.0% – 10.0 1 1 – – – – 10.0 42.5 9.3 9.78 – 2. Cowboy.Ventures 2 97 1 1 50.0% – 10.0 1 1 – – – – 10.0 39.0 9.2 9.74 – 3. Felicis.Ventures 4 245 3 1 25.0% 50% 5.0 2 2 – – – 33% 6.7 38.8 10.0 7.22 – 4. Social.Capital 8 1,155 4 4 50.0% 43% 5.7 4 4 – – – 43% 5.7 38.5 8.8 6.74 – 5. Aspect.Ventures 2 150 – 2 100.0% 100% 0.0 1 1 – – – – 10.0 48.0 7.6 5.87 – 6. SoftTech.VC 3 155 3 – – 100% 0.0 2 – 1 – – 33% 6.7 40.3 9.6 5.41 – 7. Y.Combinator 11 1,000 10 1 9.1% 82% 1.8 6 4 1 – – 38% 6.2 36.4 8.1 5.35 – 8. Ribbit.Capital 3 224 3 – – 100% 0.0 2 – – 1 – 33% 6.7 39.7 9.2 5.30 – 9. Battery.Ventures 10 4,500 9 1 10.0% 80% 2.0 8 2 – – – 64% 3.6 42.1 9.8 5.10 – 10. GGV.Capital 4 2,705 4 – – 100% 0.0 3 1 – – – 50% 5.0 44.8 10.0 5.00 – 11. Trinity.Ventures 9 1,500 7 2 22.2% 61% 3.9 4 5 – – – 44% 5.6 51.3 5.5 4.99 – 12. Kleiner.Perkins.Caufield.&.Byers 10 4,600 7 3 30.0% 53% 4.7 7 3 – – – 53% 4.7 47.7 5.5 4.95 – 13. Greylock.Partners 11 3,016 10 1 9.1% 82% 1.8 7 4 – – – 49% 5.1 45.4 7.9 4.93 – 14. Formation.8 10 948 9 1 10.0% 80% 2.0 6 4 – – – 47% 5.3 34.6 7.2 4.84 – 15. Accel.Partners 8 7,790 8 – – 100% 0.0 5 3 – – – 46% 5.4 39.5 8.8 4.71 – 16. Khosla.Ventures 8 2,263 8 – – 100% 0.0 3 5 – – – 46% 5.4 44.7 8.7 4.68 – 17. Upfront.Ventures 6 658 5 1 16.7% 67% 3.3 5 – 1 – – 67% 3.3 47.3 7.3 4.65 – 18. Google.Ventures 12 2,000 11 1 8.3% 83% 1.7 10 1 1 – – 68% 3.2 38.0 8.9 4.58 – 19. Canvas.Venture.Fund 5 175 4 1 20.0% 60% 4.0 4 1 – – – 60% 4.0 51.6 5.7 4.58 – 20. True.Ventures 7 890 7 – – 100% 0.0 4 3 – – – 43% 5.7 47.0 7.9 4.54 – 21. Bain.Capital.Ventures 11 3,000 11 – – 100% 0.0 6 4 – 1 – 38% 6.2 45.0 7.4 4.53 – 22. Lightspeed.Venture.Partners 13 3,135 13 – – 100% 0.0 6 7 – – – 46% 5.4 42.9 8.1 4.51 – 23. Scale.Venture.Partners 7 1,200 4 3 42.9% 43% 5.7 7 – – – – 100% 0.0 46.7 7.7 4.48 – 24. Iconiq.Capital 5 528 5 – – 100% 0.0 4 1 – – – 60% 4.0 40.8 9.4 4.46 – 25. Thrive.Capital 6 597 6 – – 100% 0.0 3 3 – – – 40% 6.0 32.5 7.3 4.44 – 26. Charles.River.Ventures 9 1,500 8 1 11.1% 78% 2.2 7 1 – 1 – 58% 4.2 41.2 6.8 4.38 – 27. Softbank.Capital 10 2,596 8 2 20.0% 64% 3.6 8 2 – – – 64% 3.6 46.6 5.6 4.25 – 28. Canaan.Partners 12 3,500 9 3 25.0% 59% 4.1 10 2 – – – 70% 3.0 49.1 5.5 4.19 – 29. Norwest.Venture.Partners 13 5,000 12 1 7.7% 85% 1.5 9 3 – 1 – 50% 5.0 50.8 5.9 4.16 – 30. Emergence.Capital 7 575 6 1 14.3% 71% 2.9 6 – – 1 – 71% 2.9 47.6 6.6 4.12 – 31. Storm.Ventures 6 825 6 – – 100% 0.0 2 3 – 1 – 27% 7.3 53.2 4.8 4.05 – 32. Draper.Fisher.Jurvetson 11 5,760 9 2 18.2% 67% 3.3 9 2 – – – 67% 3.3 49.7 5.6 4.04 – 33. Shasta.Ventures 6 1,025 6 – – 100% 0.0 4 2 – – – 47% 5.3 48.2 6.8 4.03 – 34. Venrock 9 2,450 8 1 11.1% 78% 2.2 8 1 – – – 78% 2.2 47.9 7.5 3.99 – 35. Foundation.Capital 9 2,782 9 – – 100% 0.0 6 3 – – – 50% 5.0 48.6 6.7 3.90 – 36. DCM.Ventures 4 2,800 4 – – 100% 0.0 3 1 – – – 50% 5.0 49.3 6.3 3.77 – 37. Benchmark 6 3,302 6 – – 100% 0.0 5 1 – – – 67% 3.3 44.5 7.9 3.76 – 38. NEA 30 16,442 28 2 6.7% 87% 1.3 24 6 – – – 67% 3.3 48.4 6.3 3.64 – 39. Institutional.Venture.Partners 8 5,400 8 – – 100% 0.0 6 2 – – – 57% 4.3 47.3 6.6 3.62 – 40. General.Catalyst.Partners 11 3,000 11 – – 100% 0.0 8 3 – – – 56% 4.4 45.6 6.5 3.62 – 41. Crosslink.Capital 6 1,600 6 – – 100% 0.0 4 2 – – – 47% 5.3 51.8 5.5 3.60 – 42. Spark.Capital 9 1,825 9 – – 100% 0.0 8 1 – – – 78% 2.2 42.4 8.5 3.58 – 43. Menlo.Ventures 11 2,000 10 1 9.1% 82% 1.8 9 2 – – – 67% 3.3 51.1 5.5 3.53 – 44. Greycroft.Partners 9 593 8 1 11.1% 78% 2.2 9 – – – – 100% 0.0 47.6 7.8 3.35 – 45. Tiger.Global.Management 3 10,000 3 – – 100% 0.0 3 – – – – 100% 0.0 37.7 10.0 3.33 – 46. Sequoia.Capital 14 4,470 14 – – 100% 0.0 12 2 – – – 74% 2.6 46.0 6.8 3.16 – 47. Founders.Fund 6 2,160 6 – – 100% 0.0 6 – – – – 100% 0.0 38.2 9.4 3.13 – 48. Mayfield.Fund 5 3,000 5 – – 100% 0.0 – 5 – – – 100% 0.0 43.4 9.3 3.10 – 49. FirstMark.Capital 14 2,200 14 – – 100% 0.0 13 1 – – – 86% 1.4 45.7 7.8 3.09 – 50. Redpoint.Ventures 13 3,800 13 – – 100% 0.0 11 2 – – – 72% 2.8 46.3 6.3 3.05 – 51. Index.Ventures 3 3,733 3 – – 100% 0.0 3 – – – – 100% 0.0 42.0 8.9 2.98 – 52. RRE.Ventures 6 810 6 – – 100% 0.0 5 1 – – – 67% 3.3 54.2 5.6 2.97 – 53. Lowercase.Capital 2 30 2 – – 100% 0.0 2 – – – – 100% 0.0 36.0 8.8 2.95 – 54. Andreessen.Horowitz 16 4,289 15 1 6.3% 88% 1.3 15 1 – – – 88% 1.3 50.0 6.1 2.85 – 55. Foundry.Group 4 1,128 4 – – 100% 0.0 4 – – – – 100% 0.0 46.0 8.5 2.84 – 56. US.Venture.Partners 6 1,225 5 1 16.7% 67% 3.3 6 – – – – 100% 0.0 50.3 4.9 2.74 – 57. Matrix.Partners 9 5,050 9 – – 100% 0.0 8 – – 1 – 78% 2.2 49.2 6.0 2.73 – 58. August.Capital 7 1,300 7 – – 100% 0.0 6 1 – – – 71% 2.9 51.0 4.9 2.59 – 59. Tenaya.Capital 5 1,487 5 – – 100% 0.0 5 – – – – 100% 0.0 47.0 7.3 2.43 – 60. First.Round.Capital 7 748 7 – – 100% 0.0 7 – – – – 100% 0.0 47.4 7.2 2.38 – 61. Pelion.Venture.Partners 5 610 5 – – 100% 0.0 5 – – – – 100% 0.0 47.6 7.1 2.38 – 62. Bessemer.Venture.Partners 13 5,600 13 – – 100% 0.0 13 – – – – 100% 0.0 45.0 7.0 2.33 – 63. Accomplice.VC 7 200 7 – – 100% 0.0 7 – – – – 100% 0.0 45.4 6.9 2.29 – 64. Meritech.Capital.Partners 6 2,064 6 – – 100% 0.0 6 – – – – 100% 0.0 45.8 6.3 2.09 – 65. Sutter.Hill.Ventures 7 700 7 – – 100% 0.0 7 – – – – 100% 0.0 49.3 6.2 2.06 – 66. Atlas.Life.Sciences 5 2,545 5 – – 100% 0.0 5 – – – – 100% 0.0 51.0 6.1 2.02 – 67. SV.Angel 5 100 5 – – 100% 0.0 5 – – – – 100% 0.0 37.8 5.7 1.91 – 68. Madrona.Venture.Group 6 1,300 6 – – 100% 0.0 6 – – – – 100% 0.0 53.8 5.4 1.79 – 69. Blumberg.Capital 2 240 2 – – 100% 0.0 2 – – – – 100% 0.0 52.0 4.8 1.61 – 70. Union.Square.Ventures 5 883 5 – – 100% 0.0 5 – – – – 100% 0.0 52.8 4.6 1.53 – 71. Bluerun.Ventures 2 1,065 2 – – 100% 0.0 2 – – – – 100% 0.0 53.0 3.9 1.29 Total 546 $$166,467 505 41 7.5% 86% 1.4 425 110 4 7 – 65% 3.5 45.9 7.0 3.98 %"of"total 92.5% 7.5% 77.8% 20.1% 0.7% 1.3% –  
  • 4.     4 This methodology walk-through addresses the following areas: (i)   Firm selection (ii)   People selection (iii)   Demographic variable estimation (iv)   Ranking methodology (v)   Appendix: Supplementary schedules are included at the end I. Firm Selection To compose a study of VC demographics, we wanted to select a representative number of funds with the following characteristics: (i)   Firms based in the US: We are focusing on the diversity decisions of US firms, so international firms were excluded (ii)   Traditional technology VC firms: We are focused on VC firms that invest mainly in technology-related startups; notably this excludes biomedical / life science-focused VC firms or firms (though we include life sciences team members if within a broader fund); we oriented around firms that have a Series A / Series B practice but included any investors in growth stage products if broken out (e.g. DFJ, Sequoia) (iii)   Largest Firms: Using a combination of VentureSource and Mattermark, we force-ranked VC firms by AUM and only looked at funds above $275M of AUM – we wanted to capture the firms which on a $ capital basis represented a sizable portion of the market. (iv)   Active Firms: We did not include any firms that are less active which we estimated as either not having raised a new fund in the last 5 years or that were not building their portfolio with new investments; this was based on public signals or VentureSource (v)   High Mindshare: We included certain firms that commanded a high mindshare score from Mattermark to the extent they weren’t already included (e.g. if below $275M AUM) This resulted in a list of 71 firms representing over $160B in AUM, per VentureSource (see p. 1). We consider this a starting point and can add additional peer firms as time goes on. II. People Selection For each of the firms, we wanted to measure the diversity of the “investment team leadership”. We are defining “investment team leadership” as anyone holding the title of General Partner, Partner, Managing Director, and any other variation of the senior investment titles on the investment team. We also include active Venture Partners and Board Partners to the extent they are actively involved on the investment team. For A16Z, KPCB, Sequoia and Y-Combinator who designate all their team members as “Partner”, we approximated the leadership team based on tenure, experience, leading deals and taking board seats. We do not include any junior investment team members (e.g. Associates, Vice Presidents or Principals) or other teams (operating or growth teams, finance team, or other non-investment team functions). We also excluded people based in international offices of US VC firms as we are focusing on team diversity within the US. This gave us a list of 546 investment team leaders across the 71 firms. There are a few reasons to focus on “investment team leaders”: (i)   Leaders drive the direction of the firm: These individuals most directly make decisions that affect the direction of the firm, have investment-decision power and represent the firm on boards (ii)   Total would paint a different picture: People have already caught on that the few women hired in VC tend to be hired in non-senior positions and/or non-investment team roles1 ; Appendix 1 has our results on this disparity (iii)   Data is stable and consistent: Firms more consistently disclose the leaders on the website versus other team members, so data availability is an issue for a total view. In addition, turnover is significantly higher at the junior level, even on the investment team, as firms have different policies (e.g. 2-year programs). III. Demographic Variable Estimation For each of the individuals, we measured the following: (i)   Gender (ii)   Race / Ethnicity: We used the same definitions as the 2010 US census, which the large public tech firms also follow in their diversity monitoring. Categories are the following:                                                                                                                 1 CNBC (http://www.cnbc.com/2015/03/27/waiting-for-pao-verdict-where-are-women-at-top-vc-funds.html); Fortune (http://fortune.com/2014/02/06/venture-capitals-stunning-lack-of-female-decision-makers/)
  • 5.     5 a.   “White” refers to a person having origins in any of the original peoples of Europe, the Middle East, or North Africa b.   “Black or African American” refers to a person having origins in any of the Black racial groups of Africa c.   “Asian” refers to a person having origins in any of the original peoples of the Far East, Southeast Asia, or the Indian subcontinent d.   “Hispanic” refers to people who identify their origin as Hispanic, Latino or Spanish e.   “Other” includes Native Hawaiian, Other Pacific Islander, American Indian or Alaskan Native (iii)   Age: We calculated age based on publicly available date-of-birth information. In instances where the date-of- birth wasn’t available, we estimated age with LinkedIn by taking high school graduation year minus 18 or college graduation year minus 22 and used 6/30 as the month/day. NOTE: We were only able to find a data point for age for 532 individuals (97% of total). IV. Ranking Methodology The ranking methodology combines 3 variables: (i)   A gender diversity score (ii)   A race diversity score (iii)   An age score For the gender diversity score and the ethnic diversity score, we use a diversity index based on probability to measure the degree of concentration when individuals are classified into types. Simply stated, we create a diversity score based on the probability that two investment team leaders taken at random from a VC firm will represent the same type. This approach uses the same principal as the Simpson index (ecology) and Herfindahl index (economics)2 and has already been used in population diversity studies3 . Gender Diversity Score The gender diversity score is calculated using the probability that any two individuals selected at random will be the same gender. This is calculated as follows: 𝑃" =   1 𝑁(𝑁 − 1) × 𝑀 𝑀 − 1 + 𝑊 𝑊 − 1 Pg = probability that two people randomly selected are the same (i.e. randomly select two men or two women) N = total senior investment team members at a firm M = number of men W = number of women Therefore, for a firm with 2 men and 2 women, the probability of randomly picking two people that are the same is: 𝑃" =   1 4(4 − 1) × 2 2 − 1 + 2 2 − 1 = 33.3% The gender score is simply 1 – this calculated probability, multiplied by 10 (for a scale of 0 to 10), or in the above example, 6.7. 𝐺𝑒𝑛𝑑𝑒𝑟   𝐷 𝑖𝑣𝑒𝑟𝑠𝑖𝑡𝑦   𝑆 𝑐𝑜𝑟𝑒 = 1 − 𝑃" ×10 The benefit of this methodology is that absolute diversity (i.e. agnostic to gender) is valued. In other words, a firm with only men will receive a probability of picking 2 people at random that are the same of 100% which would translate into a gender score of 0, but a firm with only women would also receive a gender score of 0. The higher the score, the better the diversity profile. Ethnic Diversity Score The ethnicity score is based on the same principle as the gender score, only expanded to all the racial/ethnic categories: White, Asian, Black, Latino/Hispanic, Other. 𝑃B =   1 𝑁(𝑁 − 1) × 𝑊 𝑊 − 1 + 𝐴 𝐴 − 1 + 𝐵 𝐵 − 1 + 𝐻 𝐻 − 1 + 𝑂 𝑂 − 1                                                                                                                 2 Diversity Index: https://en.wikipedia.org/wiki/Diversity_index#Simpson_index 3 USAToday: http://usatoday30.usatoday.com/news/nation/census/county-by-county-diversity.htm  
  • 6.     6 Pr = probability that two people randomly selected are the same (e.g. randomly select two While individuals) N = total senior investment team members W = number of White individuals A = number of Asian individuals B = number of Black individuals H = number of Latino/Hispanic individuals O = number of individuals with racial/ethnic category of “Other” In this case, the ethnic diversity score is also 1 – this calculated probability, multiplied by 10 (for a scale of 0 to 10). 𝐸𝑡ℎ𝑛𝑖𝑐   𝐷 𝑖𝑣𝑒𝑟𝑠𝑖𝑡𝑦   𝑆 𝑐𝑜𝑟𝑒 = 1 − 𝑃" ×10 Below is an example of the Ethnic Diversity Score across a hypothetical 10 person firm with varying allocations. W A B H O N Pr Score 2 2 2 2 2 10 11% 8.9 4 2 2 2 0 10 20% 8.0 6 2 2 0 0 10 38% 6.2 8 2 0 0 0 10 64% 3.6 10 0 0 0 0 10 100% 0 Note that while the 1st orientation has a perfectly equal balance, there is always some chance that the two randomly selected individuals will be the same (resulting in a score of 8.9 instead of intuitively a ‘perfect’ score); this is not an issue because for similarly-sized firms, the score will still be better than the less diverse firms with similar headcount. For this reason we have attempted to create sub-lists based on size (discussed below). Age Score The Age Score assigns a value to each senior investment team member based on his/her age. To figure out what ages receive a perfect score, we looked at how old partners who did the best deals were when they invested in those deals’ Series A or Series B, the earliest venture rounds where product-market fit is not readily apparent. To do this, we looked at VentureSource’s list of top venture outcomes (defined as largest exits via M&A or IPO of VC-backed companies) and compiled a list of all the partners who led the rounds in the corresponding Series A and/or B of these outcomes. The results can be seen in the cumulative distribution function (CDF) below and the table with deals used can be seen in Appendix 3. Looking at this chart, 60% of the Series A’s and B’s of the largest exists were done by partners between the age of 35 and 46 (20% and 80%, respectively). – 10.0% 20.0% 30.0% 40.0% 50.0% 60.0% 70.0% 80.0% 90.0% 100.0% 22 23 24 25 26 27 28 29 30 31 32 33 34 35 36 37 38 39 40 41 42 43 44 45 46 47 48 49 50 51 52 53 54 55 56 57 58 59 60 61 62 63 64 65 CDF  of  Ages  @  Series  A/B  of  Best  Deals 20%:  35  yrs 80%:  46  yrs Median:  41
  • 7.     7 For the age score, we assigned any individual with the age between 35 and 46 to a perfect score of 10. Before 35 (to a minimum of 22) and after 46 (to a maximum of 65) a decreased score was given. In order to give more “future credit” to those younger than 35, we decreased the scores below 35 linearly and after 46 exponentially (i.e. a score 1 year outside the alley on the low end, 34, will be higher than the score 1 year outside the alley on the high end, 47). A firm’s age score is simply the average of the age scores of the individuals. The argument for considering age is that younger partners are: (i)   More likely to be connected to newer technology (ii)   More likely to be connected to younger founders (iii)   More likely to be hungrier in their career Note that this is purely conjecture to explain the data. Composite Score: The Composite Score is the simple average between the Gender Diversity Score, Ethnic Diversity Score and the Age Score. Calculating the composite score this way reflects the position that gender, ethnicity and age are equally relevant variables in evaluating a fund’s future relevance. Ultimately when comparing firms, we also grouped firms of similar size together and considered two approaches to do so, presented on the first two pages of this document: (i)   By AUM: a.   Funds up to $250M AUM b.   Funds from $251M to $1.0B AUM c.   Funds with greater than $1.0B AUM (ii)   By Headcount of “senior investment team” members: a.   Funds with 5 people or less b.   Funds with 6-10 people c.   Funds with over 10 people We submitted data points to firms in a request for comment to allow firms the ability to fact check the information. – 2.0 4.0 6.0 8.0 10.0 22 23 24 25 26 27 28 29 30 31 32 33 34 35 36 37 38 39 40 41 42 43 44 45 46 47 48 49 50 51 52 53 54 55 56 57 58 59 60 61 62 63 64 65 Score  Ascribed  to  Each  Age
  • 8.     8 Appendix 1: Investment Team Leadership vs. Full Team The first three bars are based on data collected: (i)   Senior Investment Team: Representation of main data collected. Includes General Partners, Partners, Managing Directors, Venture Partners etc. on the investment team (ii)   Junior Investment Team: Other members of the investment team such as Principals, VPs, Associates, Analysts, Advisers, etc. (iii)   Non-investment team: Generally includes operational / support roles such as finance, legal, etc. NOTE: Categories (ii) and (iii) have an issue of data availability (i.e. not all firms show their finance team) and should be considered more “directional”. Regarding gender, it is clear that women are hired more frequently into the junior ranks but do not have the same presence on the senior team. Further, many more women exist outside of the team. The US population estimates for 2020 is shown on the far right – both the VC community and the tech industry is far from the 50/50 split. Regarding race, the senior investment team in venture capital is 78% white which is less diverse than the large tech companies and significantly worse than the US population estimates for 2020. 92%   80%   60%   89%   77%   49%   8%   20%   40%   11%   23%   51%   Senior  Investment  Team Junior  Investment  Team Non-­‐Investment  Team Y-­‐Combinator  (W'14) Large  Tech  Avg.  (Leaders) US  in  2020 Gender  Distribution %  Men %  Women 78%   63%   86%   70%   60%   20%   32%   13%   21%   6%   1%   2%   1%   2%   12%   1%   2%   1%   3%   19%   0%   3%   Senior  Investment  Team Junior  Investment  Team Non-­‐Investment  Team Large  Tech  Avg.  (Leaders) US  in  2020 Race/Ethnic  Distribution %  White %  Asian Black Hispanic Other  /  2+
  • 9.     9 An updated scatter-plot of % women and % minorities can be found below. The vast majority of funds are below where the US will be, and the magnitude of the disparity is largest when looking at representation of women vs. the US (i.e. firms are very far away from 50%). – 10% 20% 30% 40% 50% 60% 70% 80% 90% 100% – 20% 40% 60% 80% 100% %  Women %  Minority Felicis Trinity Mayfield KPCB Floodgate,   Cowboy, Social  Capital Khosla Scale Canaan US 2020:   51%  Women US 2020:   39%  Minorities Storm Aspect Tech Giants
  • 10.     10 Appendix 2: US and Tech Giant Comps The US Census data broken out is shown below. The array of corresponding statistics for the leadership of large tech firms is below: Our 2020 Designation Classification 2013 Stats %s White  alone    (non-­‐Hispanic) White 62.6% 199,400 59.6% Black  or  African  American  alone Black 13.2% 41,594 12.4% American  Indian  /  Alaskan  Native  alone Other  /  2+ 1.2% 2,432 0.7% Asian  alone Asian 5.3% 19,255 5.8% Native  Hawaiian  and  other  pacific  islander  alone Other  /  2+ 0.2% 595 0.2% Two  or  more Other  /  2+ 2.4% 7,678 2.3% Hispanic  or  Latino Hispanic 15.1% 63,551 19.0% 100.0% 334,505 100.0% White 62.6% 59.6% Asian 5.3% 5.8% Black 13.2% 12.4% Hispanic 15.1% 19.0% Other  /  2+ 3.8% 3.2% Total 100.0% 100.0% US  Ethnic  Score 44% 41% Male 155.7 165,036 49% Female 160.8 169,467 51% 316.5 334,503 100% US  Gender  Score 50% 50% 72% 75% 75% 77% 77% 77% 78% 83% 89% 92% 28% 25% 25% 23% 23% 23% 22% 17% 11% 8% AAPL LNKD AMZN YHOO FB Tech  AVG GOOG MSFT YC  Founders (W'14) Senior  VCs Gender %  Men %  Women 63% 65% 71% 70% 71% 72% 73% 78% 78% 37% 35% 29% 30% 29% 28% 27% 22% 22% AAPL LNKD MSFT Tech  AVG AMZN GOOG FB YHOO YC  Founders (W'14) Senior  VCs Ethnicity %  White %  Minority
  • 11.     11 Appendix 3: Best Venture Outcomes The following table shows the data used to calculate the distribution of ages of the partners who led the Series A / Series B rounds of the best US-based deals. Highlighted rows indicate deals for which we could not find the partner, firms or dates, or the company became insolvent shortly after exit—of these top 100 deals, 50 deals were used. Name Round  Type Invested Post-­Valuation Closed  Date Series  A  Date Series  B  Date 1. Facebook IPO 6,840 104,178 5/18/2012 5/1/2005 4/1/2006 2. Google IPO 1,202 24,640 8/19/2004 6/7/1999 n/a 3. WhatsApp Acquisition 19,000 10/6/2014 4/8/2011 n/a 4. Twitter IPO 1,820 15,650 11/7/2013 7/1/2007 5/1/2008 5. Corvis IPO 1,139 14,168 7/28/2000 n/a n/a 6. Groupon IPO 700 13,384 11/4/2011 1/1/2008 12/1/2009 7. Continental  Cablevision Acquisition 11,800 12/22/1996 n/a n/a 8. Zynga IPO 1,000 9,044 12/16/2011 1/15/2008 7/18/2008 9. MetroPCS IPO 863 8,489 4/19/2007 10/1/1994 n/a 10. Cerent Acquisition 6,900 11/1/1999 n/a 4/1/1997 11. Webvan IPO 375 6,426 11/4/1999 n/a n/a 12. LendingClub IPO 755 6,302 12/11/2014 8/23/2007 3/19/2009 13. Workday IPO 637 5,411 10/12/2012 12/6/2006 n/a 14. Fitbit IPO 448 5,122 6/18/2015 10/10/2008 9/10/2010 15. LinkedIn IPO 217 5,053 5/19/2011 11/1/2003 10/1/2004 16. Clearwire IPO 600 4,925 3/8/2007 6/1/2004 n/a 17. Chromatis  Networks Acquisition 4,756 6/28/2000 10/1/1998 9/27/1999 18. Siara  Systems Acquisition 4,500 3/8/2000 11/15/1998 4/20/1999 19. GoPro IPO 214 3,696 6/24/2014 5/5/2011 n/a 20. ONI  Systems IPO 200 3,639 6/1/2000 12/1/1997 3/1/1998 21. Sirocco  Systems Acquisition 3,487 9/7/2000 4/27/1999 4/27/1999 22. Palo  Alto  Networks IPO 197 3,406 7/20/2012 1/1/2006 6/25/2007 23. Arista  Networks IPO 226 3,348 6/5/2014 n/a n/a 24. Hyperion  Solutions Acquisition 3,300 3/1/2007 n/a n/a 25. Vonage IPO 531 3,290 5/24/2006 n/a 11/24/2003 26. First  Republic  Bank IPO 105 3,270 12/9/2010 n/a n/a 27. Xros Acquisition 3,227 6/1/2000 1/15/1999 8/15/1999 28. Nest  Labs Acquisition 3,200 2/7/2014 9/21/2010 8/1/2011 29. Oplink  Communications IPO 247 3,177 10/4/2000 n/a n/a 30. Pandora  Media IPO 96 3,145 6/15/2011 1/1/2000 n/a 31. DoubleClick Acquisition 3,100 3/12/2008 6/10/1997 2/20/1998 32. Transmeta IPO 273 3,036 11/7/2000 n/a n/a 33. NorthPoint  Communications IPO 360 3,031 5/5/1999 n/a n/a 34. Sycamore  Networks IPO 284 3,029 10/21/1999 n/a n/a 35. Qtera Acquisition 3,004 1/28/2000 8/12/1998 4/19/1999 36. zulily IPO 140 3,000 11/15/2013 12/17/2009 8/4/2010 37. International  Power  Technology Acquisition 3,000 12/31/1991 n/a n/a 38. Veeva  Systems IPO 194 2,971 10/16/2013 n/a 6/5/2008 39. Handspring IPO 200 2,919 6/21/2000 n/a n/a 40. Cygnus  Solutions Acquisition 2,875 1/7/2000 2/15/1997 n/a 41. FireEye IPO 304 2,849 9/20/2013 1/1/2005 8/23/2006 42. ServiceNow IPO 162 2,830 6/29/2012 7/5/2005 n/a 43. TriZetto  Group Acquisition 2,700 11/3/2014 n/a n/a 44. StorageNetworks IPO 243 2,676 6/30/2000 n/a n/a 45. CoSine  Communications IPO 230 2,659 9/26/2000 n/a n/a 46. Wayfair IPO 305 2,553 10/2/2014 6/21/2011 n/a 47. Beats  Electronics  LLC Acquisition 2,500 8/1/2014 n/a n/a 48. National  Computer  Systems Acquisition 2,500 7/31/2000 n/a n/a 49. HomeAway IPO 160 2,469 6/29/2011 1/1/2005 1/1/2006 50. GT  Solar  International IPO 500 2,457 7/24/2008 n/a n/a 51. CIENA IPO 115 2,410 2/7/1997 4/1/1994 12/1/1994 52. Fanch  Communications Acquisition 2,400 11/1/1999 n/a n/a 53. Magma  Copper IPO 2,400 1/4/1996 n/a n/a 54. Akamai  Technologies IPO 234 2,378 10/28/1999 12/14/1998 4/30/1999 55. Avanex IPO 216 2,375 2/4/2000 6/29/1998 3/25/1999 56. eToys IPO 166 2,334 5/19/1999 n/a n/a 57. Ikaria Acquisition 2,300 4/17/2015 9/26/2005 n/a 58. LS  Power  Group Acquisition 2,300 4/2/2007 n/a n/a 59. Tritel IPO 237 2,296 12/13/1999 n/a n/a 60. Priceline.com IPO 160 2,277 3/30/1999 n/a n/a 61. Tableau  Software IPO 155 2,274 5/17/2013 1/1/2004 n/a 62. FreeMarkets IPO 173 2,177 12/9/1999 n/a n/a 63. Juno  Therapeutics IPO 265 2,131 12/19/2014 12/3/2013 8/5/2014 64. Intergraph  Corp. Acquisition 2,125 10/28/2010 n/a n/a 65. Tellium IPO 135 2,121 5/17/2001 n/a n/a 66. MP3.com IPO 346 2,004 7/21/1999 n/a n/a 67. Splunk IPO 213 2,001 4/19/2012 12/1/2004 1/1/2006 68. Oculus  VR Acquisition 2,000 7/21/2014 6/17/2013 12/12/2013 69. Fusion-­io IPO 204 1,990 6/9/2011 3/31/2008 4/7/2009 70. Etsy IPO 213 1,987 4/16/2015 11/1/2006 1/1/2007 71. Telecorp  PCS IPO 184 1,966 11/22/1999 n/a n/a 72. Box IPO 175 1,902 1/23/2015 10/1/2006 1/23/2008 73. Websense Acquisition 1,900 6/1/2015 n/a n/a 74. Tradex  Technologies Acquisition 1,860 3/8/2000 n/a 3/1/1998 75. Nimble  Storage IPO 168 1,836 12/13/2013 12/21/2007 12/24/2008 76. Broadband  Access  Systems Acquisition 1,835 9/29/2000 7/1/1998 n/a 77. Juniper  Networks IPO 163 1,816 6/24/1999 6/11/1996 8/5/1996 78. Green  Dot  Corp. IPO 1,816 7/22/2010 1/1/2003 n/a 79. Onvia.com IPO 168 1,806 3/1/2000 n/a n/a 80. AutoTrader.com Acquisition 1,800 1/3/2014 n/a n/a 81. Niku IPO 192 1,790 2/29/2000 n/a n/a 82. NetZero IPO 160 1,782 9/23/1999 n/a n/a 83. Legent Acquisition 1,780 5/25/1995 n/a n/a 84. VA  Linux  Systems IPO 132 1,755 12/9/1999 n/a n/a 85. KiOR IPO 150 1,754 6/24/2011 n/a n/a 86. Alios  BioPharma Acquisition 1,750 11/7/2014 n/a n/a 87. NetSuite IPO 161 1,727 12/20/2007 n/a n/a 88. Demand  Media IPO 77 1,720 1/26/2011 n/a n/a 89. Rackspace  Hosting IPO 159 1,716 8/8/2008 n/a 3/27/2000 90. AXT IPO 25 1,716 5/20/1998 n/a n/a 91. Liberty  Dialysis  LLC Acquisition 1,700 2/28/2012 n/a n/a 92. Castlight  Health IPO 178 1,675 3/14/2014 8/1/2009 n/a 93. Bindley  Western  Industries Acquisition 1,670 12/5/2000 n/a n/a 94. KAR  Auction  Services IPO 300 1,660 12/11/2009 n/a n/a 95. Reliant  Pharmaceuticals Acquisition 1,650 12/19/2007 n/a n/a 96. YouTube Acquisition 1,650 11/13/2006 11/1/2005 n/a 97. aQuantive IPO 126 1,632 2/29/2000 n/a n/a 98. Avici  Systems IPO 217 1,617 7/28/2000 5/1/1997 n/a 99. OnDeck  Capital IPO 200 1,612 12/17/2014 1/1/2006 1/1/2007 100. Bright  Horizons  Family  Solutions IPO 222 1,605 1/25/2013 n/a n/a
  • 12.     12 We have a total of 127 datapoints across the 50 of the largest exits above for which we have the actual or estimated age of the partner at the time of the Series A or B. Name Fund Investment Series Deal  Date Age  @  Deal 1. Jim  Breyer Accel  Partners Facebook Series  A 5/1/05 43 2. Reid  Hoffman Greylock  Partners Facebook Series  A 5/1/05 37 3. Peter  Thiel Founders  Fund Facebook Series  B 4/1/06 38 4. David  Sze Greylock  Partners Facebook Series  B 4/1/06 43 5. Paul  Madera Meritech  Capital  Partners Facebook Series  B 4/1/06 49 6. Ron  Conway SV  Angel Facebook Series  B 4/1/06 55 7. John  Doerr Kleiner  Perkins  Caufield  &  Byers Google Series  A 6/7/99 47 8. Michael  Moritz Sequoia  Capital Google Series  A 6/7/99 44 9. Jim  Goetz Sequoia  Capital WhatsApp Series  A 4/8/11 45 10. Brian  Pokorny SV  Angel Twitter Series  A 7/1/07 26 11. Ron  Conway SV  Angel Twitter Series  A 7/1/07 56 12. George  Zachary Charles  River  Ventures Twitter Series  A 7/1/07 40 13. Fred  Wilson Union  Square  Ventures Twitter Series  A 7/1/07 45 14. Chris  Sacca Lowercase  Capital Twitter Series  A 7/1/07 31 15. Marc  Andreessen Andreessen  Horowitz Twitter Series  A 7/1/07 36 16. Mike  Maples  Jr. Floodgate Twitter Series  A 7/1/07 38 17. Steve  Anderson Baseline  Ventures Twitter Series  A 7/1/07 37 18. Bijan  Sabet Spark  Capital Twitter Series  B 5/1/08 38 19. Joi  Ito MIT  Media  Lab Twitter Series  B 5/1/08 41 20. Harry  Weller NEA Groupon Series  A 1/1/08 37 21. Kevin  Efrusy Accel  Partners Groupon Series  B 12/1/09 36 22. Fred  Wilson Union  Square  Ventures Zynga Series  A 1/15/08 46 23. Andy  Russell Pilot  Group Zynga Series  A 1/15/08 36 24. Rich  Levandov Avalon  Ventures Zynga Series  A 1/15/08 25. Brad  Feld Foundry  Group Zynga Series  A 1/15/08 42 26. Peter  Thiel Founders  Fund Zynga Series  A 1/15/08 40 27. Reid  Hoffman Greylock  Partners Zynga Series  A 1/15/08 40 28. Brian  Pokorny SV  Angel Zynga Series  A 1/15/08 27 29. John  Doerr Kleiner  Perkins  Caufield  &  Byers Zynga Series  B 7/18/08 57 30. Sandy  Miller Institutional  Venture  Partners Zynga Series  B 7/18/08 58 31. Vinod  Khosla Khosla  Ventures Cerent Series  B 4/1/97 42 32. Dan  Ciporin Canaan  Partners LendingClub Series  A 8/23/07 48 33. Jeff  Crowe Norwest  Venture  Partners LendingClub Series  A 8/23/07 49 34. Rebecca  Lynn Canvas  Venture  Fund LendingClub Series  B 3/19/09 36 35. Jeff  Clavier SoftTech  VC FitBit Series  A 10/10/08 40 36. Jon  Callaghan True  Ventures FitBit Series  A 10/10/08 39 37. Brad  Feld Foundry  Group FitBit Series  B 9/10/10 44 38. Aydin  Senkut Felicis  Ventures Fitbit Series  B 9/10/10 39 39. Mark  Kvamme Sequoia  Capital LinkedIn Series  A 11/1/03 42 40. Josh  Kopelman First  Round  Capital LinkedIn Series  A 11/1/03 32 41. David  Sze Greylock  Partners LinkedIn Series  B 10/1/04 41 42. Dave  Flanagan Intel  Capital Clearwire Series  A 6/1/04 34 43. Seth  Neiman Crosspoint Chromatis  Networks Series  A 10/1/98 44 44. Vinod  Khosla Khosla  Ventures Siara  Systems Series  A 11/15/98 43 45. Promod  Haque Norwest  Venture  Partners Siara  Systems Series  A 11/15/98 50 46. Michael  Marks Riverwood  Capital GoPro Series  A 5/5/11 59 47. Ned  Gilhuly Sageview  Capital GoPro Series  A 5/5/11 50 48. John  Ball Steamboat  Ventures GoPro Series  A 5/5/11 47 49. Chris  Rust Cyphort GoPro Series  A 5/5/11 45 50. Lip-­‐Bu  Tan Walden  International GoPro Series  A 5/5/11 51 51. Kevin  Compton Kleiner  Perkins  Caufield  &  Byers ONI  Systems Series  A 12/1/97 39 52. Jon  Feiber Mohr  Davidow ONI  Systems Series  A 12/1/97 40 53. Felda  Hardymon Bessemer  Venture  Partners Sirocco  Systems Series  A 4/27/99 51 54. Roger  Evans Greylock  Partners Sirocco  Systems Series  A 4/27/99 49 55. Barry  Eggers Lightspeed  Venture  Partners Sirocco  Systems Series  A 4/27/99 35 56. Jim  Goetz Sequoia  Capital Palo  Alto  Networks Series  A 1/1/06 40 57. Asheem  Chandna Greylock  Partners Palo  Alto  Networks Series  A 1/1/06 41 58. Harry  Weller NEA Vonage Series  B 11/24/03 33 59. Thomas  Bredt Menlo  Ventures XROS Series  A 1/15/99 57 60. Randy  Komisar Kleiner  Perkins  Caufield  &  Byers Nest  Labs Series  A 9/21/10 54 61. Rob  Coneybeer Shasta  Ventures Nest  Labs Series  A 9/21/10 40 62. Bill  Maris Google  Ventures Nest  Labs Series  B 8/1/11 35 63. Peter  Nieh Lightspeed  Venture  Partners Nest  Labs Series  B 8/1/11 45 64. Larry  Kubal Labrador  Ventures Pandora  Media Series  A 1/1/00 47 65. Doug  Barry Selby  Ventures Pandora  Media Series  A 1/1/00 36 66. Larry  Marcus Walden  International Pandora  Media Series  A 1/1/00 48 67. Dave  Strohm Greylock  Partners DoubleClick Series  A 6/10/97 48 68. Deepak  Kamra Canaan  Partners DoubleClick Series  A 6/10/97 40 69. Ray  Rothrock Venrock DoubleClick Series  A 6/10/97 39 70. Todd  Dagres Spark  Capital Qtera Series  A 8/12/98 37 71. Todd  Brooks Mayfield  Fund Qtera Series  B 4/19/99 38 72. Jason  Stoffer Maveron Zulily Series  A 12/17/09 32 73. Eric  Carlborg August  Capital Zulily Series  B 8/4/10 45 74. Gus  Tai Trinity  Ventures Zulily Series  B 8/4/10 44 75. Gordon  Ritter Emergence  Capital Veeva  Systems Series  B 6/5/08 43 76. Dave  Strohm Greylock  Partners Cygnus  Solutions Series  A 2/15/97 48 77. John  Johnston August  Capital Cygnus  Solutions Series  A 2/15/97 41 78. Matthew  Howard Norwest  Venture  Partners FireEye Series  A 1/1/05 40 79. Gaurav  Garg Sequoia  Capital FireEye Series  A 1/1/05 38 80. Joe  Horowitz Icon  Ventures FireEye Series  B 8/23/06 81. Paul  Barber JMI  Equity ServiceNow Series  A 7/5/05 42 82. Alex  Finkelstein Spark  Capital Wayfair Series  A 6/21/11 34 83. Neeraj  Agrawal Battery  Ventures Wayfair Series  A 6/21/11 38 84. Michael  Kumin Great  Hill  Partners Wayfair Series  A 6/21/11 37 85. Ian  Lane HarvourVest Wayfair Series  A 6/21/11 33 86. Phil  Siegel Austin  Ventures HomeAway Series  A 1/1/05 39 87. Jeff  Brody Redpoint  Ventures HomeAway Series  A 1/1/05 43 88. Todd  Chaffee Institutional  Venture  Partners HomeAway Series  B 1/1/06 45 89. John  Moragne Trident  Capital HomeAway Series  B 1/1/06 45 90. Berry  Cash InterWest CIENA Series  A 4/1/94 52 91. David  Cowan Bessemer  Venture  Partners CIENA Series  B 12/1/94 28 92. Scott  Tobin Battery  Ventures Akamai  Technologies Series  A 12/14/98 27 93. Todd  Chaffee Institutional  Venture  Partners Akamai  Technologies Series  A 12/14/98 38 94. Andrew  Schwab 5am  Ventures Ikaria Series  A 9/26/05 33 95. Robert  Nelsen ARCH  Venture  Partners Ikaria Series  A 9/26/05 41 96. Bryan  Roberts Venrock Ikaria Series  A 9/26/05 37 97. Forest  Baskett,  PhD NEA Tableau  Software Series  A 1/1/04 60 98. Robert  Nelsen ARCH  Venture  Partners Juno  Therapeutics Series  A 12/3/13 50 99. Bong  Koh Venrock Juno  Therapeutics Series  A-­‐2 12/3/13 40 100. David  Hornik August  Capital Splunk Series  A 12/1/04 36 101. Thomas  Neustaetter JK&B  Capital Splunk Series  B 1/1/06 53 102. Antonio  Rodriguez Matrix  Partners Oculus  VR Series  A 6/17/13 38 103. Santo  Politi Spark  Capital Oculus  VR Series  A 6/17/13 46 104. Joe  Lonsdale Formation  8 Oculus  VR Series  A 6/17/13 30 105. Brian  Singerman Founders  Fund Oculus  VR Series  A 6/17/13 34 106. Chris  Dixon Andreessen  Horowitz Oculus  VR Series  B 12/12/13 40 107. Scott  Sandell NEA Fusion-­‐io Series  A 3/31/08 43 108. Chris  Schaepe Lightspeed  Venture  Partners Fusion-­‐io Series  B 4/7/09 43 109. Blake  Modersitzki Pelion  Venture  Partners Fusion-­‐io Series  B 4/7/09 39 110. Fred  Wilson Union  Square  Ventures Etsy Series  A 11/1/06 45 111. Josh  Stein Draper  Fisher  Jurvetson Box Series  A 10/1/06 32 112. Winston  Fu US  Venture  Partners Box Series  B 1/23/08 41 113. Steve  Jurvetson Draper  Fisher  Jurvetson TradeX  Technologies Series  B 3/1/98 30 114. Ping  Li Accel  Partners Nimble  Storage Series  A 12/21/07 35 115. Jim  Goetz Sequoia  Capital Nimble  Storage Series  A 12/21/07 42 116. Barry  Eggers Lightspeed  Venture  Partners Nimble  Storage Series  B 12/24/08 45 117. Andrew  Marcuvitz Matrix  Partners Broadband  Access  Systems Series  A 7/1/98 118. Vinod  Khosla Khosla  Ventures Juniper  Networks Series  A 6/11/96 41 119. Seth  Neiman Crosspoint Juniper  Networks Series  B 8/5/96 42 120. Andy  Rachleff Benchmark  Capital Juniper  Networks Series  B 8/5/96 37 121. Geoff  Yang Redpoint  Ventures Juniper  Networks Series  B 8/5/96 36 122. Peter  Barris NEA Juniper  Networks Series  B 8/5/96 43 123. Michael  Moritz Sequoia  Capital Green  Dot  Corp. Series  A 1/1/03 48 124. Douglas  Leone Sequoia  Capital Rackspace  Hosting Series  B 3/27/00 41 125. George  Still Norwest  Venture  Partners Rackspace  Hosting Series  B 3/27/00 41 126. Bryan  Roberts Venrock Castlight  Health Series  A 8/1/09 41 127. Roelof  Botha Sequoia  Capital Youtube Series  A 11/1/05 33 128. Jim  Swartz Accel  Partners Avici  Systems Series  A 5/1/97 129. Matt  Gorin Contour  Venture  Partners OnDeck  Capital Series  A 1/1/06 130. Matt  Harris Bain  Capital  Ventures OnDeck  Capital Series  A 1/1/06 33 131. David  Weiden Khosla  Ventures OnDeck  Capital Series  B 1/1/07 34 132. James  Robinson  III RRE  Ventures OnDeck  Capital Series  B 1/1/07 71