Definitions and Terminology
•Microevolution
– Changes within populations or species in gene
frequencies and distributions of traits
• Macroevolution
– Higher level changes, e.g. generation of new
species or higher–level classification
3.
Gene
• Section ofa chromosome that encodes the
information to build a protein
• Location is known as a “locus”
4.
Allele
• Varieties ofthe information at a particular
locus
• Every organism has two alleles (can be
same or different)
• No limit to the number of alleles in a
population
5.
Zygosity
• Homozygous:
– Twocopies of the same allele at one locus
• Heterozygous:
– Two different alleles at one locus
6.
Genotype
• Genetic informationcontained at a locus
• Which alleles are actually present at a locus
• Example:
– Alleles available: R and W
– Possible genotypes:
• RR, RW, WW
Phenotype
• Example 1:
–Alleles R (red) and W (white), codominance
– Genotypes: RR, RW, WW
– Phenotypes: Red, Pink, White
9.
Phenotype
• Example 2:
–Alleles R (red) and w (white), simple
dominance
– Genotypes: RR, Rw, ww
– Phenotypes: Red, Red, white
10.
Dominant and RecessiveAlleles
• Dominant alleles:
– “Dominate” over other alleles
– Will be expressed, while a recessive allele is
suppressed
• Recessive alleles:
– Alleles that are suppressed in the presence of a
dominant allele
11.
Gene Pool
• Thecollection of available alleles in a
population
• The distribution of these alleles across the
population is not taken into account!
12.
Allele frequency
• Thefrequency of an allele in a population
• Example:
– 50 individuals = 100 alleles
– 25 R alleles = 25/100 = 25% R
= 0.25 is the frequency of R
– 75 W alleles = 75/100 W = 75% W
= 0.75 is the frequency of W
13.
Allele frequency
• Note:
•The sum of the frequencies for each allele
in a population is always equal to 1.0!
• Frequencies are percentages, and the total
percentage must be 100
– 100% = 1.00
14.
Other important frequencies
•Genotype frequency
– The percentage of each genotype present in a
population
• Phenotype frequency
– The percentage of each phenotype present in a
population
15.
Evolution
• Now wecan define evolution as the change
in genotype frequencies over time
16.
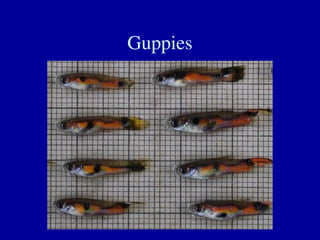
Genetic Variation
• Thevery stuff of evolution!
• Without genetic variation, there can be no
evolution
Why is phenotypicvariation not
as important?
• Phenotypic variation is the result of:
– Genotypic variation
– Environmental variation
– Other effects
• Such as maternal or paternal effects
• Not completely heritable!
20.
Hardy-Weinberg Equilibrium
• Fiveconditions under which evolution
cannot occur
• All five must be met:
• If any one is violated, the population will
evolve!
21.
HWE: Five conditions
•No net change in allele frequencies due to
mutation
• Members of the population mate randomly
• New alleles do not enter the population via
immigrating individuals
• The population is large
• Natural selection does not occur
22.
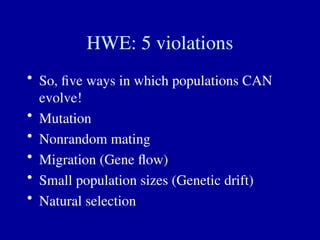
HWE: 5 violations
•So, five ways in which populations CAN
evolve!
• Mutation
• Nonrandom mating
• Migration (Gene flow)
• Small population sizes (Genetic drift)
• Natural selection
23.
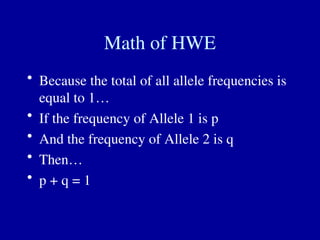
Math of HWE
•Because the total of all allele frequencies is
equal to 1…
• If the frequency of Allele 1 is p
• And the frequency of Allele 2 is q
• Then…
• p + q = 1
24.
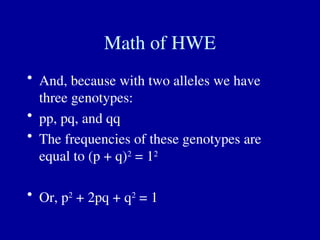
Math of HWE
•And, because with two alleles we have
three genotypes:
• pp, pq, and qq
• The frequencies of these genotypes are
equal to (p + q)2
= 12
• Or, p2
+ 2pq + q2
= 1
25.
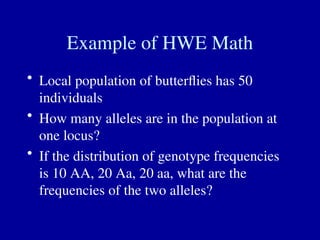
Example of HWEMath
• Local population of butterflies has 50
individuals
• How many alleles are in the population at
one locus?
• If the distribution of genotype frequencies
is 10 AA, 20 Aa, 20 aa, what are the
frequencies of the two alleles?
26.
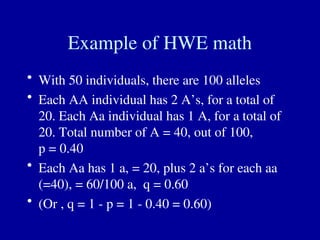
Example of HWEmath
• With 50 individuals, there are 100 alleles
• Each AA individual has 2 A’s, for a total of
20. Each Aa individual has 1 A, for a total of
20. Total number of A = 40, out of 100,
p = 0.40
• Each Aa has 1 a, = 20, plus 2 a’s for each aa
(=40), = 60/100 a, q = 0.60
• (Or , q = 1 - p = 1 - 0.40 = 0.60)
27.
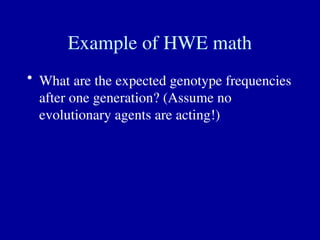
Example of HWEmath
• What are the expected genotype frequencies
after one generation? (Assume no
evolutionary agents are acting!)
28.
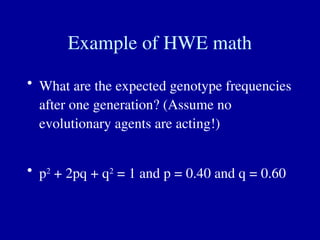
Example of HWEmath
• What are the expected genotype frequencies
after one generation? (Assume no
evolutionary agents are acting!)
• p2
+ 2pq + q2
= 1 and p = 0.40 and q = 0.60
29.
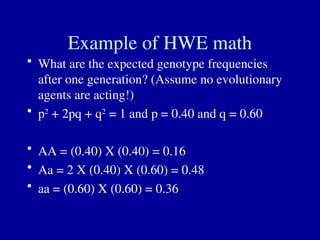
Example of HWEmath
• What are the expected genotype frequencies
after one generation? (Assume no evolutionary
agents are acting!)
• p2
+ 2pq + q2
= 1 and p = 0.40 and q = 0.60
• AA = (0.40) X (0.40) = 0.16
• Aa = 2 X (0.40) X (0.60) = 0.48
• aa = (0.60) X (0.60) = 0.36
30.
Mutation
• Mutation isthe source of genetic variation!
• No other source for entirely new alleles
31.
Rates of mutation
•Vary widely across:
– Species
– Genes
– Loci (plural of locus)
– Environments
32.
Rates of mutation
•Measured by phenotypic effects in humans:
– Rate of 10-6
to 10-5
per gamete per generation
• Total number of genes?
– Estimates range from about 30,000 to over
100,000!
– Nearly everyone is a mutant!
33.
Rates of mutation
•Mutation rate of the HIV–AIDS virus:
– One error every 104
to 105
base pairs
• Size of the HIV–AIDS genome:
– About 104
to 105
base pairs
• So, about one mutation per replication!
Rates of mutation
•Rates of mutation generally high
• Leads to a high load of deleterious
(harmful) mutations
• Sex may be a way to eliminate or reduce the
load of deleterious mutations!
36.
Types of mutations
•Point mutations
– Base-pair substitutions
– Caused by chance errors during synthesis or
repair of DNA
– Leads to new alleles (may or may not change
phenotypes)
37.
Types of mutations
•Gene duplication
– Result of unequal crossing over during meiosis
– Leads to redundant genes
• Which may mutate freely
• And may thus gain new functions
38.
Types of mutations
•Chromosome duplication
– Caused by errors in meiosis (mitosis in plants)
– Common in plants
• Leads to polyploidy
• Can lead to new species of plants
– Due to inability to interbreed
39.
Effects of mutations
•Relatively speaking…
• Most mutations have little effect
• Many are actually harmful
• Few are beneficial
40.
How can mutationslead to big
changes?
• Accumulation of many small mutations,
each with a small effect
• Accumulation of several small mutations,
each with a large effect
• One large mutation with a large effect
• Mutation in a regulatory sequence (affects
regulation of development)
Random mating
• Underrandom mating, the chance of any
individual in a population mating is exactly
the same as for any other individual in the
population
• Generally, hard to find in nature
• But, can approximate in many large
populations over short periods of time
44.
Non-random mating
• Violationsof random mating lead to
changes in genotypic frequencies, not allele
frequencies
• But, can lead to changes in effective
population size…